GME LONG IDEA GME has been in a downtrend for a while. The first signal for long was in April 2024 when price was in an oversold region and there was a divergence on the awesome oscillator. This was followed by a breakout of downtrend. From around 16, price went up to 64.
The current price action shows that price is about to rally up again. A weekly bullish candle closing above 30 is a good signal for a long. Price has broken out of a downtrend and support level, closing above these key levels is a good signal to target the high. An aggressive trader or investor may buy at a current price. While a conservative trader may wait for price to close and buy the following week or wait for price to retrace to the support level before placing the buy. To spread risk, one can buy at the current price, add more positions when price retraces to the key level. This will save from missing out and also balance the risk.
Entry could be at current price or 30 while the target can be 48 or 65.
The confluences for the buy are as follows:
1. Downtrend breakout with a weekly bullish candle closing above it.
2. Price respecting uptrend
3. Awesome oscillator resuming bullish momentum
4. Price breaking out of support level.
Disclaimer: this is not a financial advice. The outcome maybe different from the projection. If you can't accept the risk, don't take the signal.
M-oscillator

AMD LONG IDEAAMD stock has been in a downtrend for a while. This is also confirmed with the awesome oscillator being in oversold region. However, there's a breakout of the downtrend. This is also supported with price breaking and closing above a support level. An aggressive trader or investor can buy at the current market price. While a conservative trader or investor can wait for price to pull back to the support level before buying.
The entry will be 101.70 while the stop will be 76.05 and the final target will be 226.77.
Confluence for this signal are as follows:
1. Awesome oscillator in oversold region
2. Awesome oscillator divergence
3. Downtrend breakout
4. Weekly bullish candle closing above down trend line and support level.
5. Price respecting uptrend
Disclaimer: This is not a financial advice. The outcome maybe different from the projection. If you can't accept the risk, don't take the signal.

USD/CHF: Ducks in a Row for a Dive Below .8200?USD/CHF is teetering on .8200 horizontal support, with a break of the level opening the door for a move towards the April low at .8040.
With price and momentum indicators both trending lower, and Friday’s bearish engulfing candle warning of further dollar weakness, the ducks appear to be lining up for downside near term.
If the price breaks .8200 and holds there, consider initiating shorts with a stop above the level for protection. .8100 and .8040 screen as potential targets.
Good luck!
DS

The bulls need to stay in control!Hopefully, BTC will break this; otherwise, we're looking at a significant bearish divergence on the weekly timeframe.

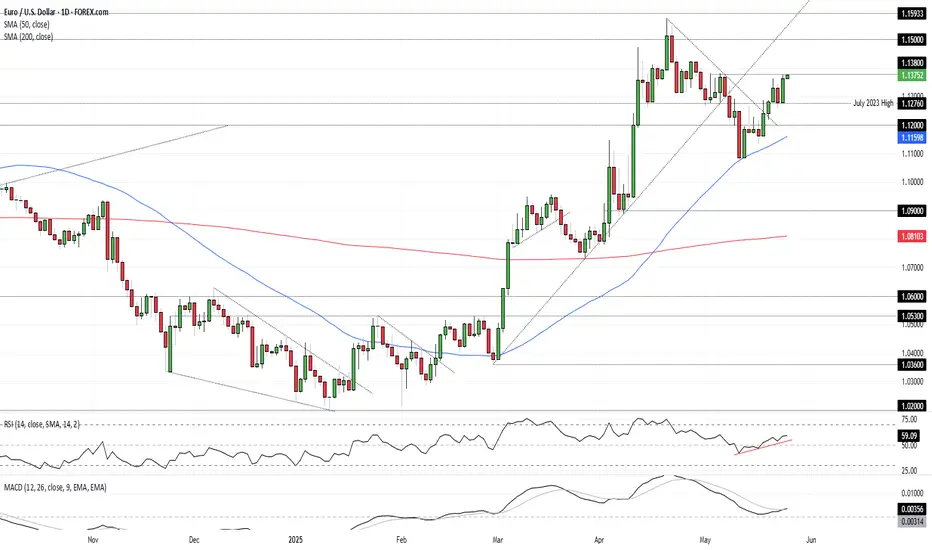
EUR/USD: Engulfing candle, momentum signals boost bullish caseThe case for EUR/USD upside was looking good even before Donald Trump’s latest tariff backflip on EU imports, with Friday’s engulfing candle joining momentum indicators like RSI (14) and MACD in generating bullish signals.
With the price banging on the door of minor resistance at 1.1380, a bullish setup has been generated. If the price can clear 1.1380 and hold there, longs could be established on the break with a stop beneath for protection. Offers may emerge around 1.1420 where the pair topped out in late April, making that screen as an initial target. For those seeking greater risk-reward, 1.1500 has proven to be a strong resistance zone over the years, making that another level to aim for.
While the U.S. dollar has benefitted from similar tariff backflips previously, they are now widely expected by traders, meaning the tailwind they used to provide may no longer apply.
Good luck!
DS
MRDIY - Low RISK ?MRDIY - CURRENT PRICE : RM1.62
MRDIY is BULLISH because :
1. Price is above EMA 50
2. Price is above ICHIMOKU CLOUD
3. RSI is above 50
4. The high is getting higher and the low also getting higher
ENTRY PRICE : RM1.60 - RM1.62
TARGET PRICE : RM1.72 , RM1.80 , RM1.90
SUPPORT : RM1.51 (The low of bullish HAMMER candle)

BTCUSD (15m) – Wave 12345 Completed with Bullish Divergence & SN🕒 Timeframe: 15-Minute
💰 Pair: BTC/USD
⸻
🔍 Wave Structure & Momentum Analysis
Using Elliott Wave Theory, we can clearly identify a completed 5-wave impulsive move down:
• (1) → (2) → (3) → (4) → (5)
• Wave (5) completes with a bullish divergence against the Awesome Oscillator (AO), signaling weakening bearish momentum.
• Both price and AO show a clear divergence between wave (3) and wave (5), hinting at a possible reversal or corrective phase.
⸻
🔁 Break of Structure & SNR Zone
• Price is currently reacting to a key Support-turned-Resistance (SNR) level around 107,724.
• A confirmed break and close above this SNR will mark a break of structure, strengthening the bullish case.
• I will wait for the price to close above 107,724 on the 15M timeframe to confirm this break.
⸻
🧠 What’s Next? ABC Retracement for Entry
• Upon break of structure, I will look for a nearest bullish Supply & Demand (SND) zone as a potential entry point.
• Ideally, I will wait for an ABC corrective retracement (after the break) to enter long.
• Entry will be placed at the base of the SND zone formed during the corrective leg.
⸻
📌 Trade Plan Summary
• ✅ Wave 12345 completed (impulse wave down).
• ✅ Bullish divergence confirmed with AO.
• ⚠️ Watching for break and close above 107,724 (key SNR).
• 🔎 If broken, wait for ABC correction into SND zone to initiate long position.
• 🎯 Target: Mid to Upper structure zone based on previous supply.
• ❌ Invalidation: If price fails to break above 107,724 or breaks below recent swing low (wave 5), setup is void.
⸻
📈 Technical Confluence
• Elliott Wave Count
• AO Divergence
• Break of Structure (BoS)
• SNR Level
• Awaiting ABC Pullback into SND
⸻
💬 Let me know what you think! Are you seeing the same structure? Waiting patiently for confirmation before entering.
#BTCUSD #ElliottWave #BreakOfStructure #SupplyAndDemand #AO #CryptoAnalysis #SmartMoney #15MinChart

Momentum Trade in Jio Fin1. Cup and Handle breakout
2. Volume pop up
3. MACD signal turning green
4. RSI above 50
5. Good risk to reward

GBP/USD H1 Analysis – Fibonacci Exhaustion + Bearish DivergencePair: GBP/USD
Timeframe: 1-Hour
Technical Tools Used:
• Price Action & Structure
• Fibonacci Extension
• Awesome Oscillator (AO)
⸻
📌 Key Technical Highlights:
✅ Price reached 4.236 Fibonacci Exhaustion Level
✅ Clear Break of Structure (BOS) to the downside
✅ Bearish Divergence spotted on AO
✅ Bearish Targets identified using Fibonacci Extension
⸻
🔍 Market Overview:
GBP/USD recently completed a strong bullish impulse and tapped into the 4.236 Fibonacci exhaustion zone around 1.34686, a level often associated with trend exhaustion.
Following this, a Break of Structure (BOS) was confirmed, signaling potential weakening of bullish momentum and a possible trend reversal.
⸻
📉 Bearish Confluence – AO Divergence:
The Awesome Oscillator (AO) confirms bearish divergence:
• Price made a higher high.
• AO made a lower high.
This suggests that bullish momentum is fading despite higher price levels — a classic early warning of potential reversal.
⸻
🎯 Fibonacci Extension Take-Profit Zones:
Using the latest swing leg and BOS as the reference, the Fibonacci extension tool reveals several high-probability take-profit zones:
• ✅ TP1: 1.618 Extension @ 1.33770
• ✅ TP2: 2.618 & 2.786 Extensions @ 1.33204 – 1.33051
• 🧊 Extreme Targets: 4.236+ Extensions near 1.32288 and below, if strong bearish momentum continues.
⸻
💡 Trading Plan:
This setup offers a clean bearish opportunity based on:
• Completion of an extended bullish leg
• Break of market structure
• Momentum divergence via AO
• Strong Fibonacci confluence
Bias: Bearish
Trigger: Wait for pullback or retest followed by bearish confirmation (e.g., rejection candle or engulfing pattern).
Risk: As always, use clear stop-loss above recent high and manage risk appropriately.
⸻
👍 If you found this analysis helpful, give it a like and follow for more updates.
💬 Drop your thoughts or questions below — let’s discuss your setups too!

AUD/CAD: Ducks in a Row for a Drop Below .8880?The ducks look to be lining up for AUD/CAD downside.
It was comprehensively rejected at the 200DMA a fortnight ago, followed by wedge break on Tuesday before sliding below the 50DMA on Thursday. It now sits perched on .8880, a level it attracted buying from earlier this month.
With RSI (14) sub-50 and MACD crossing over from above, momentum signals are shifting neutral to moderately bearish, favouring downside. With both moving averages trending lower, it reinforces the bearish picture.
If AUD/CAD breaks beneath .8880, considering initiating shorts targeting a return to support at .8800. A stop above .8880 would provide protection against reversal.
Should it hold .8880, the bearish backdrop suggests there are better setups to consider than flipping the trade and going long.
Good luck!
DS

RACE Wave Analysis – 22 May 2025- RACE reversed from round resistance level 500.00
- Likely to fall to support level 460.00
RACE earlier reversed from the strong resistance area between the major round resistance level 500.00 (which has been reversing the price from the middle of 2024) and the upper weekly Bollinger Band.
The last time the price reversed down from the resistance level 500.00 it formed the weekly Japanese candlesticks reversal Evening Star – signalling the strength of this resistance level.
Given the overbought reading on the weekly Stochastic indicator, RACE can be expected to fall to the next support level 460.00.

0.26 is a critical level for $DogeAfter spending about two months in the accumulation box Doge is trying to go on a journey of its own. $0.26 is a critical level. If CRYPTOCAP:DOGE manages to break it we might see the usual oscillations boom in the coming weeks.

$SPY Bollinger Bands and RSI Oversold SignalThe AMEX:SPY aka S&P 500 is delivering a daily Bollinger Bands and RSI oversold signal today
In the last ten years there has been a bigger recovery shortly after such an signal

GBP/JPY Elliott Wave Completion + AO Divergence @ Zone 4.23 | BUHey traders! 👋
Here’s an exciting setup on GBP/JPY (1H) — we might be at the early stage of a major reversal, and you’ll want this on your radar. Let's break it down with Elliott Wave theory, the Awesome Oscillator (AO), and some powerful Fibonacci confluence.
🧠 Elliott Wave Count – 5-Wave Impulse Completed
We have a clean 5-wave bearish impulsive structure:
1️⃣ Wave (1): Sharp drop kicks off the trend.
2️⃣ Wave (2): Classic pullback, respecting structure.
3️⃣ Wave (3): Longest and most powerful wave down.
4️⃣ Wave (4): Corrective triangle/flat with weakening bear momentum.
5️⃣ Wave (5): Final push into a key demand zone, but lacks strength.
🛑 What makes this special? Wave (5) lands right into “Zone 4.23” — a Fibonacci extension (423.6%) of the corrective leg — acting as a magnet for price exhaustion.
📊 AO Divergence – Early Warning Signal!
Check the Awesome Oscillator (AO):
Price makes lower lows (Wave 3 → Wave 5)
AO makes higher lows — textbook bullish divergence 🔍
This is smart money exhaustion: the bears are running out of steam, even though price is still pushing lower. When momentum diverges from price, a reversal is highly probable.
📌 ZONE 4.23 – Fibonacci Confluence + Demand Zone
This zone (191.900 – 192.300) is no ordinary support. It combines:
📐 423.6% Fibonacci extension (a powerful exhaustion level)
🟦 Historical demand zone from previous impulsive rally
🤖 Price reacting instantly on touch = algorithmic buying likely
⚠️ What Comes Next – Break of Structure (BOS) = Entry Trigger
We’re not rushing in blindly. Here’s the plan:
Wait for BOS: Price must break above Wave (4) structure (~193.200).
AO flips green: Extra confirmation of new bullish momentum.
Retest of BOS or Zone 4.23: That’s our golden buy entry.
Target Zone: Use Fibonacci retracement of full Wave 1–5 down. First targets:
🎯 38.2% = 193.800
🎯 61.8% = 194.900
🎯 Full correction = 196.000+
🎯 Conclusion: This Is a Setup with EDGE
✅ Completed Elliott Wave
✅ AO Divergence = Hidden strength
✅ Fibonacci 4.23 Confluence
✅ Demand Zone bounce
✅ Clear BOS-based entry plan
🔥 Are You Ready for the Reversal?
Drop a comment if you're watching this setup too 👇
Like ❤️ + Follow if you want more clean, actionable Elliott Wave + AO confluence setups like this!
📈 Let’s catch the move before the crowd reacts.
#GBPJPY #ElliottWave #AO #Divergence #ForexTrading #TechnicalAnalysis #BuySetup #SmartMoney #Fib4.23 #BreakOfStructure #TrendReversal

Color Your Trades: MACD 4C vs the Classic📊 Coloring Momentum: Comparing Standard MACD vs MACD 4C
Momentum indicators are a trader’s compass—but not all compasses are created equal. In this post, we compare the classic MACD with the visually enhanced MACD 4C , a four-color histogram tool that adds clarity and nuance to trend and momentum analysis.
Let’s break down how both tools work, how we use them at Xuantify, and how you can decide which one fits your strategy best.
🔍 What Are These Indicators?
Standard MACD (Moving Average Convergence Divergence) is a time-tested momentum indicator that plots the difference between two EMAs (typically 12 and 26) and a signal line (usually a 9 EMA of the MACD line). It’s simple, effective, and widely used.
MACD 4C , developed by vkno422 , builds on the classic MACD by introducing a four-color histogram and divergence detection , making it easier to interpret momentum shifts and trend strength visually.
Key Differences:
Standard MACD: Two lines + histogram (single color)
MACD 4C: Histogram only, but with four colors to show trend strength and direction
MACD 4C includes bullish/bearish divergence detection
🧠 How We Use Them at Xuantify
We use both indicators—but for different purposes.
1. Standard MACD – Clean Confirmation
We use it for classic trend confirmation and crossover signals . It’s great for traders who prefer minimalism and are comfortable interpreting line-based momentum.
2. MACD 4C – Visual Momentum Clarity
We use MACD 4C when we want a more intuitive, color-coded view of momentum. The four-color histogram helps us quickly spot trend strength, exhaustion, and divergence.
🧭 Color Coding in MACD 4C
MACD 4C uses four histogram colors (default settings):
Lime/Green : Bullish momentum building or continuing
Red/Maroon : Bearish momentum building or continuing
This makes it easier to:
Spot momentum shifts
Identify trend continuation
Detect divergence at a glance
⚙️ Settings That Matter
Both indicators allow customization, but MACD 4C offers more visual tuning:
MACD 4C:
Adjustable fast/slow MA and signal smoothing
Toggle divergence detection
Color-coded histogram for quick reads
Standard MACD:
Clean, minimal, and widely supported
Best for traders who prefer traditional setups
🔗 Best Combinations with These Indicators
We combine MACD tools with:
Structure Tools – BOS/CHOCH for context
Liquidity Zones – To spot where momentum may reverse
Volume Profile – To confirm strength behind moves
Fair Value Gaps (FVGs) – For precision entries
⚠️ What to Watch Out For
Both indicators are lagging by nature—they rely on moving averages. MACD 4C’s divergence detection can help anticipate reversals, but it’s still best used as a confirmation tool , not a standalone signal.
🔁 Repainting Behavior
Both the standard MACD and MACD 4C are non-repainting . Once a histogram bar or crossover is printed, it remains fixed. This makes them reliable for real-time trading and backtesting .
⏳ Lagging or Leading?
These are lagging indicators , designed to confirm trends—not predict them. MACD 4C’s divergence feature adds a leading element , but it should always be used with structure and price action for confirmation.
🚀 Final Thoughts
If you’re a visual trader who wants more clarity from your momentum tools, MACD 4C is a powerful upgrade. If you prefer simplicity and tradition, the standard MACD still holds its ground.
Try both, test them in your strategy, and see which one sharpens your edge.

Gold monthly RSI ( 22MAY2025 )Gold is still rising to the upside, but look at the monthly RSI @ overbought area

It looks like BTC.D isn't finished yetBTC.D broke above the golden pocket of its previous down move, and the daily MACD crossed bullish. It looks like another leg up.

Hang Seng Futures: Bulls Need 23,600 to StickIf Hang Seng futures continue to bounce from 23,600, it sets up a decent long opportunity with the price trending higher and momentum indicators and moving averages still favouring dip buying. The price is currently taking a peek beneath the level.
If it can rebound—as seen earlier in the session—longs could be considered above 23,600 with a stop beneath the session low for protection. Wednesday’s high of 23,884 stands out as a potential target, with a break above that opening the door to a retest of 24,050 resistance.
Failure to reclaim 23,600 would invalidate the setup.
Good luck!
DS

3M Wave Analysis – 21 May 2025
- 3M reversed from multi-month resistance level 154.00
- Likely to fall to support level 145.00
3M recently reversed down from the multi-month resistance level 154.00 (which has been reversing the price from the end of January) intersecting with the upper daily Bollinger Band.
The downward reversal from the resistance level 154.00 formed the daily Japanese candlesticks reversal pattern Evening Star.
Given the strength of the resistance level 154.00 and the overbought daily Stochastic, 3M can be expected to fall to the next support level 145.00.

Going short on the Nasdaq 100CAPITALCOM:US100
The Nasdaq 100 has moved up impulsively on a 5-wave move over the past 6 weeks, which is very bullish long term. However, in the short term, it is overextended, with the RSI indicator over the 70 level.
I expect it to decline over the next couple of weeks to the area marked in the green rectangle, between the 50% and the 78.6% Fibonacci Retracement level.
I hope you find this interesting.
Good luck to you

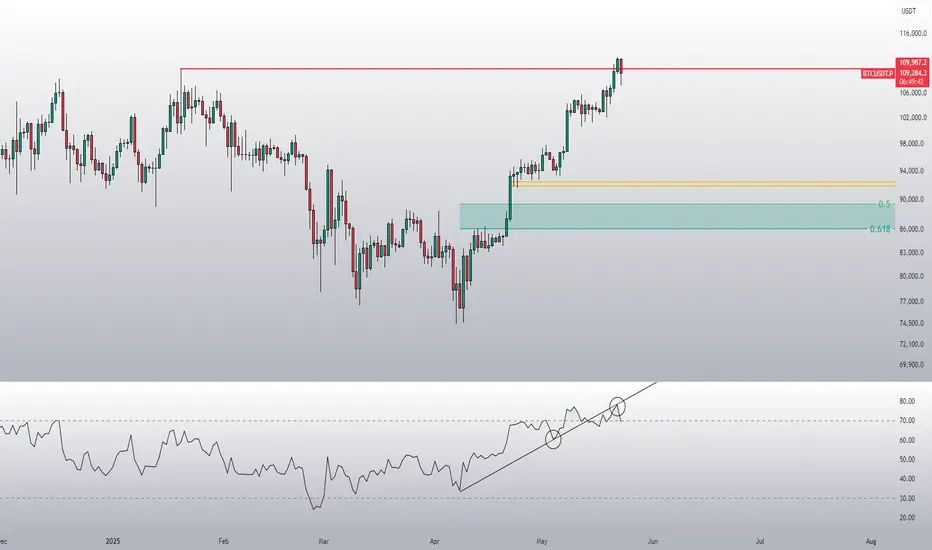
Going Short on BitcoinBINANCE:BTCUSDT
Bitcoin has moved up strongly in the last 5 weeks in a 5-wave up move, which is very bullish long term. However, after a 5-wave move, there is usually a 3-wave corrective move to the opposite direction. The most common target will be the Golden Pocket, which is between the 61.8% Fibonacci Retracement and the 78.6% Fibonacci Retracement. Which would be between $86,500 USDT and $81,200 USDT. This move will probably take several weeks, probably between 2 and 4 weeks, before it resumes to the upside.
Another point to consider is that the RSI indicator has reached overbought levels, above the 70 level. I would like to see it near oversold levels, 30 level, before considering going long.
I hope you find this interesting.
Good luck to you

Why I think EURUSD will sell this week...Technical AnalysisHey Rich Friends,
Happy Monday! I wanted to share my analysis on EURUSD and why I think it will sell. This is only a technical analysis so please check the news and cross-reference your own charts. Here is what I am looking at:
- Momentum has picked up for the sellers after the swing high was hit. This means a downtrend has started and is picking up.
- The market structure was broken on the downside on M15 and H1. There was a retest and previous support became resistance.
- The stoch is facing down, both lines have crossed below 80, slow line (orange) is above the fast line (blue) which is a bearish confirmation for me.
Additional information:
- I will wait for both lines of the stoch to cross below 50 to confirm the down trend.
- I will use previous highs as my SL and previous lows as my TPs.
Good luck if you decide to take this trade, let me know how it goes.
Peace and Profits,
Cha
