SUI - Only way is up.BINANCE:SUIUSDT (1W CHART) Technical Analysis Update
SUI is currently trading at $2.77and showing overall bullish sentiment
Price has touches the trending support and managed to bounce back from the support, this is a good sign. I see a good opportunity for long trade here with a decent stoploss.
Entry level: $ 2.77
Stop Loss Level: $ 1.77
TakeProfit 1: $ 3.6997
TakeProfit 2: $ 4.2126
TakeProfit 3: $ 5.7785
TakeProfit 4: $ 9.5494
TakeProfit 5: $ 14.1762
Max Leverage: 5x
Position Size: 1% of capital
Remember to set your stop loss.
Follow our TradingView account for more technical analysis updates. | Like, share, and comment your thoughts.
Cheers
GreenCrypto
M-pattern

XRP About to Break Out! 3.40 Target.Trading Fam,
It's really this simple. This is a bullish triangle. Three hits in the premium buy zone (bottom of the triangle) and we're done. Once we break, there will be some resistance at that VRVP PoC (2.39) and then we're gone. 3.40 is an easy target.
Stew

GER40 Short The trend on this trade has finally started to turn so we can expect the start of the short season
H4, H1, and M15 are overbought
There are 2 clear patterns on H1 and M30
There is a head and shoulders present in M15 with massive divergence
Stoploss above 150 pips
First target at 23300

NRBBEARING
NSE:NRBBEARING
Note :
1. One should go long with a Stop Loss, below the Trendline or the Previous Swing Low.
2. Risk :Reward ratio should be minimum 1:2.
3. Plan your trade as per the Money Management and Risk Appetite.
Disclaimer :
>You are responsible for your profits and loss.
>The idea shared here is purely for Educational purpose.
>Follow back, for more ideas and their notifications on your email.
>Support and Like incase the idea works for you.

BEMLNSE:BEML
Note :
1. One should go long with a Stop Loss, below the Trendline or the Previous Swing Low.
2. Risk :Reward ratio should be minimum 1:2.
3. Plan your trade as per the Money Management and Risk Appetite.
Disclaimer :
>You are responsible for your profits and loss.
>The idea shared here is purely for Educational purpose.
>Follow back, for more ideas and their notifications on your email.
>Support and Like incase the idea works for you.

USDCHF: Up for a ride?What we just saw on USDCHF is a classic move that catches many traders off guard:
Price swept the Previous Day’s Low (PDL)
That’s where most retail traders get stopped out.
It’s also where smart money often steps in.
Break of Structure (BOS) followed immediately
A clean shift in direction.
Momentum flipped bullish.
Fair Value Gap (FVG) below
That’s likely where price will return to rebalance.
If price respects that zone, the next destination?
The liquidity resting above.
This is one of those setups that reminds me:
It’s not about catching every move. It’s about understanding why the move happened.
Let’s see how it plays out.

They called it consolidation. I called it accumulation.Price was coiled in a defined OB + FVG combo — building pressure while the rest of the market slept. The moment we swept the low into the Order Block, the trade became personal. This wasn’t noise — it was alignment.
Why I entered:
Daily FVG + OB overlap — textbook Smart Money entry zone
Volume spike at the OB low, signaling smart accumulation
Structural BOS confirmation on intraday after sweep
What followed was an impulsive push through inefficiencies, climbing level by level toward pre-defined liquidity pools.
Targets:
TP1: 2.6464 — rebalancing zone
TP2: 3.00 — clean inefficiency top
TP3: 3.39 — liquidity magnet
Trade thesis:
Entry was set between 2.05–2.10, stop placed with precision below the OB. No guessing. Just calculated structure + narrative.
I don’t chase moves. I let price come to my zone. And when it does, I strike with full conviction.
Final words:
“Your edge doesn’t scream. It sits quietly in imbalance — waiting.”

Turbulent Week Ahead? Gold Outlook June 9-13, 2025Hey fellow traders,
Let's dive into the OANDA:XAUUSD outlook for the upcoming week, June 9-13, 2025. The recent price action has been a rollercoaster 🎢, and the next few days promise even more fireworks 🎇.
Looking back at the 30-minute chart from May 22 to June 6, gold saw an initial consolidation, then a strong rally to multi-week highs near 3,420. However, this was followed by a sharp, dramatic reversal, pushing prices back below 3,300. This "bull trap" 🐂 pattern suggests underlying weakness and potential preemptive market positioning.
Another view on this could be the possibility that a gap on the chart at 3300-3295 of around $5 could get closed. Since strong support is right below this, it could serve as a good launchpad 🚀 for an upward rally. Let's see if the upcoming Asia session on Monday triggers this because its only - $14 from $3309.
Key Drivers for the Week Ahead:
📅 June 9, 2025 (Monday)
US-China High-Level Trade Talks Commence in London
High-level delegations from the United States and China began trade discussions in London. This meeting followed an announcement by President Donald Trump on Friday, June 6, 2025, who described a preceding 90-minute phone call with Chinese President Xi Jinping as "very positive".
The US delegation included Treasury Secretary Scott Bessent, Commerce Secretary Howard
Lutnick, and US Trade Representative Jamieson Greer, reflecting a coordinated approach to addressing complex trade issues. The talks were primarily aimed at resolving the ongoing bilateral trade war, with a particular focus on tariffs and the global supply of critical rare earth minerals.5 While no specific time for the commencement of talks was provided, it is understood they began during London's daytime, approximately (10:12 CEST / 04:12 EDT).
These discussions occurred in the context of a temporary 90-day agreement reached on May 12, 2025, which had seen the US reduce its tariffs on Chinese imports from 145% to 30%, and China reciprocate by lowering its tariffs on US goods from 125% to 10%.9 However, this temporary truce is set to expire in early August, and President Trump had recently accused China of violating the agreement, specifically regarding critical mineral exports. The broader bilateral relationship remains strained by issues extending beyond tariffs, including restrictions on advanced chips, student visas, and concerns over China's state-dominated economic model.
The prompt scheduling of these high-level talks immediately after a leader-to-leader call suggests a tactical move towards de-escalation of immediate trade tensions, aiming to prevent a full-blown trade war. The objective appears to be managing current conflicts rather than achieving a fundamental resolution, especially with the May 12 agreement nearing its expiration. The core disputes, such as control over rare earths and technology, are deeply entrenched and reflect a broader geopolitical competition rather than mere economic disagreements. This pattern of temporary de-escalation followed by persistent underlying tensions indicates a long-term,structural competition. It suggests that trade policy is increasingly intertwined with national security and geopolitical strategy, implying that businesses should anticipate continued volatility and strategic decoupling in certain sectors, rather than a return to pre-trade war normalcy.
Other big movers for gold will be the US inflation reports. 💥
📅 Wednesday, June 11 (14:30 CEST / 08:30 EDT):
We get the crucial US Consumer Price Index (CPI) data.
Watch for Core CPI (YoY) with a forecast of 2.9% and headline CPI (YoY) at 2.5%.
📅 Thursday, June 12 (14:30 CEST / 08:30 EDT):
The US Producer Price Index (PPI) follows.
Forecasts are for Core PPI (YoY) at 3.0% and headline PPI (YoY) at 2.6%.
📊 These numbers are critical. If inflation comes in hotter 🔥 than expected, it will likely strengthen the US Dollar 💵 and push real interest rates higher 📈, making gold less attractive. This could trigger further declines 📉, especially given the current market structure. Conversely, cooler 🧊 inflation could spark a significant rebound 🔄.
Beyond US data, keep an eye 👁️ on speeches from various European Central Bank (ECB) officials throughout the week, including President Lagarde on Tuesday (23:15 CEST / 17:15 EDT). Their collective tone 🎤 could influence EUR/USD dynamics and indirectly impact the US Dollar Index, offering a counterbalance ⚖️ or amplification to gold's movements.
Key Numbers and Technical Levels to Watch:
Gold is currently sitting on a substantial speculative net long position of 187.9K contracts. This is a massive amount of bullish bets 📊🐂, making gold highly vulnerable to rapid liquidation 💣 if the fundamental picture turns sour. A "long squeeze" could amplify any downside move.
Immediate Support: The 3,300 level is paramount. A decisive break below it would signal further weakness. Below that, 3,250 is strong technical support where we saw a bounce previously.
Overhead Resistance: Look for resistance at 3,350-3,360, and then the recent peak of 3,420. Reclaiming these levels would require a significant shift in sentiment.
Expect high volatility ⚡, especially around the US inflation releases. Trade smart 🧠, manage your risk ⚖️, and stay nimble! 🏃
Geopolitical News Landscape 🌍
India / Pakistan
The ceasefire from May 10 is holding, but diplomatic relations remain frosty. India has launched a global image campaign to gain support, while Pakistan insists on dialogue and accountability.
Outlook: Without substantial agreements on border terrorism and water issues, tensions will stay latently high, with potential for new escalation risks. ⚠️
Gaza Conflict
Violence escalated again in early June. Israel intensified attacks, killing civilians seeking aid in Gaza City, and at least six people were killed at a distribution point.
Outlook: The humanitarian situation continues to worsen 🚨, and international mediation efforts are urgently needed. However, an immediate ceasefire seems unrealistic. ❌
Russia / Ukraine
In the first week of June, Russia launched one of its largest series of attacks: hundreds of drones and missiles hit Kharkiv and Kyiv, resulting in civilian casualties. Simultaneously, a planned prisoner exchange has stalled.
Outlook: Strategic air attacks will likely continue 💥, and the prisoner exchange remains deadlocked. Without a diplomatic initiative, the conflict will stay entrenched. 🕳️
U.S.–China Trade War
Following talks between Trump and Xi, new negotiation rounds are expected in London. China has opened up rare earth exports, a sign of cautious de-escalation.
Outlook: If dialogue channels open 🗣️, systemic trust could grow, but genuine reforms remain uncertain. 🤔
🌐 Global Trade War
The OECD has lowered its growth outlook to 2.9%, warning of protectionism 🧱 and delayed investments. The ECB is also maintaining synchronization with the FED.
Outlook: Without de-escalation, the world faces a global economic slowdown 🐌 and permanent fragmentation of supply chains. 🔗
🏛 Trump vs. Powell
Trump has again complained about the FOMC's hesitancy, nicknaming Powell “Too Late,” and demanding a full 1% interest rate cut.
Outlook: Pressure is mounting 📣. Whether the Fed yields depends on if inflation and labor data allow for a loose policy. 🎯
💵 U.S. Inflation – May 2025
Forward-looking data shows a weakening services sector and consumer prices rising again as tariffs pass through. Official CPI data for May 2025 will be released on June 11.
Outlook: Higher inflation could halt the Fed's "dereflexion" course — a dilemma ⚖️ between growth 📈 and price stability. 🛑
Technical View 📐
Regarding the major Head and Shoulders (H&S) reversal pattern on the 4H chart I shared previously, I'd like to explain some new developments that are altering its potential outcome.
Since the price has re-entered and fallen below the neckline, I activated my "second brain cell" 🧠 to guess what could be next. This led me to revise the larger 4-hour chart structure with the adjustments shown in the accompanying image.
As you can also see in the updated version below, a reversed H&S pattern remains a possibility, as the proportions still appear valid. 🔄
Potential Scenarios for Gold 🧩
Under this revised idea, Gold could potentially reach the neckline entry at 3397 (+88) from the current price. This is one plausible scenario. ✅
Alternatively, the price could drop further to the "Head" at 3120 (-191 from the current 3309), which would, of course, invalidate this H&S pattern. ❗
While this is speculative 🔮, given that trading often involves psychological movements and their resulting impacts, I believe this is a favorable approach to forecasting.
Another reason to see it as bullish is the formed standard bull flag 🚩🐂.
Please take the time to let me know what you think about this. 💬
-------------------------------------------------------------------------
This is just my personal market idea and not financial advice! 📢 Trading gold and other financial instruments carries risks – only invest what you can afford to lose. Always do your own analysis, use solid risk management, and trade responsibly.
Good luck and safe trading! 🚀📊

$MSTR bear flag forming; Daily $350 targetHello, quick mobile chart posting here. Simple looking bear flagging forming. Bitcoin having some downside action, I imagine Saylor will be buying some Bitcoin soon again as well. This should see $350. Looking for a short. + geopolitical turmoil hits crypto/Bitcoin the hardest and most violent. The 20 and 50 EMA are aligned as well with the Supertrend Downtrend showing $350.
WSL.

Bitcoin - Breakout incoming towards $115k?Introduction
Bitcoin (BTC) has been consolidating just below a key resistance level over the past several days. This period of sideways movement, without any significant pullbacks, reflects notable strength in the market. Such price behavior often precedes a strong directional move, and in this case, the technical setup continues to favor the possibility of a bullish breakout.
1H BullFlag Pattern
On the 1-hour timeframe, BTC is forming a well-defined bull flag pattern, which is typically a bullish continuation signal. This flag began to develop after BTC surged from approximately $105,000 to $110,000, creating the flagpole that represents the initial wave of upward momentum.
Since that move, price has entered a consolidation phase, forming the flag portion of the pattern with declining volume and tighter price action. If BTC breaks out above the upper boundary of this flag, the measured move target projects a rally toward the $115,000 level. Reaching this target would represent a new all-time high for Bitcoin, signaling a continuation of the broader uptrend.
4H Fair Value Gap (FVG), Downside Scenario
Although the overall structure favors a bullish outcome, it is important to acknowledge the potential for a short-term retracement. On the 4-hour chart, there is a Fair Value Gap (FVG) between $105,700 and $106,800. If BTC fails to break out immediately, this zone becomes a logical area to monitor.
Price may revisit this imbalance to fill the gap left behind by the recent upward move. A dip into this area could present a strong opportunity for long entries, particularly if buyers step in with conviction. Filling this FVG would allow for a more balanced structure before BTC attempts a sustained move higher.
Conclusion
BTC continues to show impressive resilience as it consolidates near its prior highs. The presence of a bull flag on the lower timeframes, coupled with minimal downside volatility, suggests that a breakout above resistance is becoming increasingly likely.
However, reclaiming the previous all-time high remains a critical step before targeting the projected $115,000 level. How BTC reacts to that key resistance area will provide important insight into the strength of this rally.
At this stage, the bullish case remains the higher probability scenario, while any short-term pullback into the FVG zone could offer a healthy reset and a potential long setup for continuation toward new highs.
Thanks for your support.
- Make sure to follow me so you don't miss out on the next analysis!
- Drop a like and leave a comment!

EUR/USD Weekly Outlook | Harmonic Butterfly PatternHere is a professional TradingView publish description for your EUR/USD Weekly Butterfly Pattern Analysis:
---
🦋 EUR/USD Weekly Outlook | Harmonic Butterfly Pattern
Pair: EUR/USD
Timeframe: 1W (Weekly)
Strategy: Harmonic Pattern Recognition – Butterfly Pattern
Bias: Bearish Reversal Setup
---
🔍 Pattern Analysis:
Butterfly Harmonic Pattern completed with precision at the 1.272–1.414 extension zone, forming the critical D-point near 1.14700.
Price has reacted sharply from the PRZ (Potential Reversal Zone), aligning with a historical supply zone.
Confluence from Fibonacci extensions:
AB = 0.786 retracement
BC = 0.382 to 0.886 retracement
CD = 1.618 to 2.618 extension
📉 Bearish rejection expected from this high-probability reversal zone.
---
📌 Key Levels:
PRZ (Potential Reversal Zone): 1.14500 – 1.15000
First Target Zone (Support Block): 1.11500 – 1.10500
Invalidation (Pattern Failure): Close above 1.15500
---
📅 Projection: This weekly harmonic butterfly suggests a potential trend reversal or deep pullback. We may see EUR/USD targeting lower support as D-point gets respected. Watch for signs of weakness such as long-wick rejections, bearish engulfing patterns, or RSI divergence confirmation.
---
💡 Conclusion: EUR/USD is at a critical juncture. If the butterfly holds, this could be a high RR short opportunity for swing traders. Patience is key—confirmation on lower timeframes will validate entry.
---
📊 #EURUSD #ButterflyPattern #HarmonicTrading #ForexAnalysis #TechnicalAnalysis #SwingTradeSetup

11.06.25 Morning ForecastPairs on Watch -
PEPPERSTONE:COCOA
FX:GBPAUD
FX:CHFJPY
A short overview of the instruments I am looking at for today, multi-timeframe analysis down to what I will be looking at for an entry. Enjoy!

09.06.25 Morning ForecastPairs on Watch -
FX:USDJPY
FX:AUDNZD
FX:AUDJPY
FX:CHFJPY
A short overview of the instruments I am looking at for today, multi-timeframe analysis down to what I will be looking at for an entry. Enjoy!

NMDCNSE:NMDC
Note :
1. One should go long with a Stop Loss, below the Trendline or the Previous Swing Low.
2. Risk :Reward ratio should be minimum 1:2.
3. Plan your trade as per the Money Management and Risk Appetite.
Disclaimer :
>You are responsible for your profits and loss.
>The idea shared here is purely for Educational purpose.
>Follow back, for more ideas and their notifications on your email.
>Support and Like incase the idea works for you.

MINDACORPNSE:MINDACORP
Note :
1. One should go long with a Stop Loss, below the Trendline or the Previous Swing Low.
2. Risk :Reward ratio should be minimum 1:2.
3. Plan your trade as per the Money Management and Risk Appetite.
Disclaimer :
>You are responsible for your profits and loss.
>The idea shared here is purely for Educational purpose.
>Follow back, for more ideas and their notifications on your email.
>Support and Like incase the idea works for you.

$ENS / USDT 1D FAKEOUT ON FLAG? Incoming Pump? 📊 $ENS/USDT Perpetual Contract – Daily Timeframe Analysis
🟢 Bullish Setup
A bullish flag is forming on the daily chart — a continuation pattern indicating potential upward movement.
- Price recently entered into the golden pocket of the Fibonacci retracement tool marked from $16.881 – $25.241 on the third touch of the flag's resistance, triggering a fakeout, it now rests in the first Fair Value Gap.
- The strong wick rejection on the 3rd retest of the resistance/supply indicates bearish strength, momentarily pushing price lower.
- Despite this, the overall pattern remains valid as long as price respects the Golden Pocket and FVG zone below.
✅ If price closes above the golden pocket, it could present an excellent leveraged entry or spot position, with high reward potential off 67%.
🔴 Bearish Scenario
- So far, every test of the **4H supply zone** has resulted in rejection — showing persistent seller control at short-term resistance.
- If buyers fail to defend the golden pocket and recover the bullish trendline, the structure confirms a break. (Downtrend)
The confirmation of bearish pressure is the:
1) Large wick (Creating a shooting start candle pattern)
- Signaling bearish reversal.
2) Large Bearish Marubozu Candle.
- Indicates strong continuation of a downtrend.
3) Candle close below Trend line support.
- Showing Bears were able to successful make a major move.
🔽 In that case, we look to short after FVG confirmation and scalp down toward the daily demand zone.
📌 Patience is key. Let the price show intent before entering.
Please let me know what your thoughts are!

GiftNifty at Best Support !!This is the 4 hour chart of GiftNifty
And GiftNifty having good Law of Polarity at 24500 range
If this level is sustain, then we may see higher prices in GiftNifty
Thank You !!

SOLARINDSNSE:SOLARINDS
Note :
1. One should go long with a Stop Loss, below the Trendline or the Previous Swing Low.
2. Risk :Reward ratio should be minimum 1:2.
3. Plan your trade as per the Money Management and Risk Appetite.
Disclaimer :
>You are responsible for your profits and loss.
>The idea shared here is purely for Educational purpose.
>Follow back, for more ideas and their notifications on your email.
>Support and Like incase the idea works for you.

BTC High Time Frame Bullish BATThere is Bullish BAT on the 4hr etc., lining up with the 200MA. Thank you

LTCUSDTThe tool watches for a strong upward move (called the flagpole).
Then it looks for a small pullback or sideways move (called the flag).

BNB will rest after reaching 1000BNB has successfully bounced back from the support area and heading towards the next resistance which is around 900-1000. This target is easily achievable for BNB since is fundamentally strong and BNB ecosystem is heavily used.
I'm expecting BNB to reach 1000 in 3rd of this year.
Follow Our TradingView Account for More Technical Analysis Updates, | Like, Share and Comment Your thoughts.
Cheers
GreenCrypto

Tatasteel on the MoveTatasteel NSE:TATASTEEL on the Move. You can make a safe Target for 160 and exit.

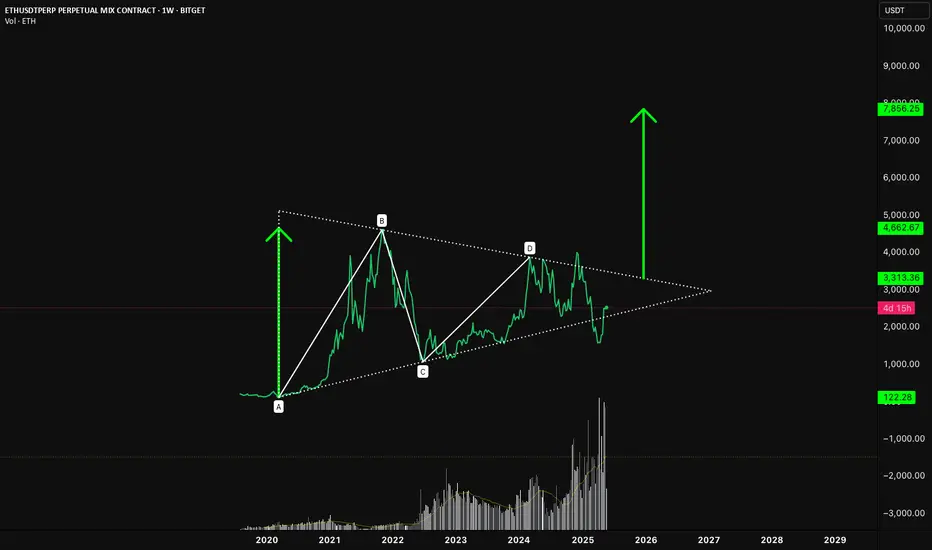
ETH/USDT – The Ethmuda TriangleZoom out.
Since the 2021 highs, Ethereum has spent years grinding sideways, printing what now looks like a textbook symmetrical triangle. Labeled here as an ABCD compression pattern, this structure has been tightening since the macro top (B), slowly building energy within narrowing volatility.
🔺 Structure Breakdown:
• A to B: The explosive bull run from the March 2020 low to the all-time high.
• B to C: A deep correction that shook out weak hands and set the bottom.
• C to D: A multi-year coil of consolidation, forming higher lows and lower highs.
• D to ?: We’re now nearing the apex, where compression typically leads to expansion.
📍 The Trigger Zone
The key level to watch is $4,000–$4,200. A clean breakout above this zone would invalidate the downtrend line and break the triangle to the upside. From a pattern-measured move perspective, the height of the triangle (A to B) projected from the breakout point suggests potential upside into the $7,800–$8,000 region.
🧠 Why This Matters
• Volume has been tapering throughout the structure — classic behaviour in large triangles.
• Market sentiment remains uncertain, making a breakout all the more impactful.
• Ethereum fundamentals are arguably stronger than they were in 2021 — Layer 2s, institutional use cases, and new ETH ETF speculation all add fuel.
📊 Potential Target:
• Immediate resistance: $3,300
• Breakout trigger: $4,000–$4,200
• Projected move: ~$8,000
🕰️ When? Well.. who knows but it does sort of line-up with my previous idea using a SOL/USDT chart that says early next year.. and not this year.
This is the type of setup plays out pretty well on lower timeframes, why not a massive one? The real question is: Are we on the verge of expansion after compression?
Let the chart do the talking.
⚡️ Not Financial Advice