TSLA Breakout Retest: What Could Signal Bullish Surge NASDAQ:TSLA Breakout Retest: What Could Signal Bullish Surge – Is Tesla poised for a major move? In this video, I break down the breakout retest pattern on TSLA’s weekly chart, focusing on the critical near term levels. A validated breakout could hint at a higher time frame bullish scenario! I’ll cover:
Rules to validate or invalidate the pattern
Conservative and aggressive price targets
My personal targets based on years of trading experience
Don’t miss this Tesla stock analysis for 2025!
What to Watch For:
Breakout confirmation at $490
Stop-loss zones and risk management
Potential bullish surge targets
M-pattern

$PENGU Falling Wedge Bullish Daily CSECY:PENGU forming a falling wedge this will explote soon guaranteed I’m loading hard already! See you at the top!

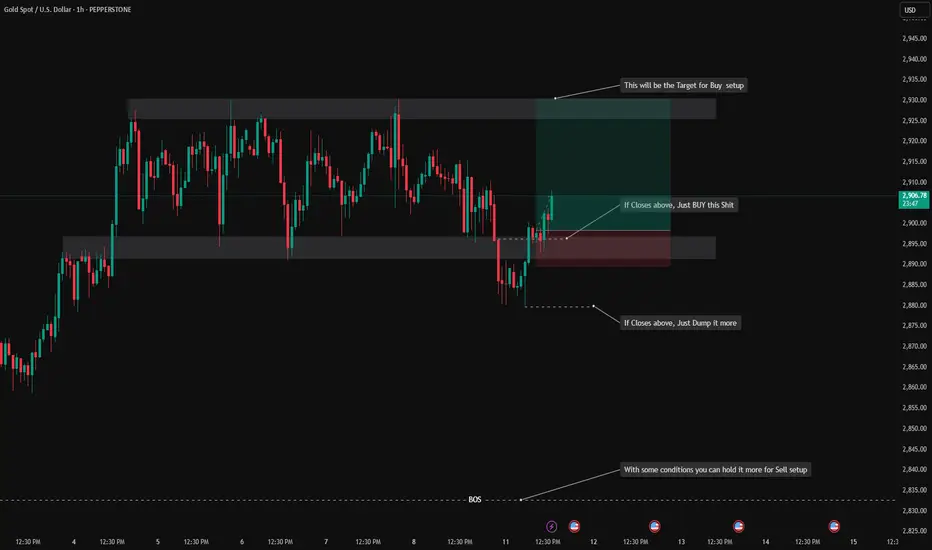
XAUUSD 1H, 11/03/2025, 02:00PMAs i explained this Gold setup its going up. SL below entry candle, Target as mentioned.
JPN225 Short 1. There are multiple patterns on this trade
2. This is with the H4 trend
3. Stop loss of 150 pips
4. M15 and M30 are overbought but might be too early to say there is a lot of divergence

BTC's Potential Up to 77K & Down to 130K? Here’s WhyBINANCE:BTCUSDT has both bullish and bearish scenarios in play now.
These days, the crypto market has been stagnant—no real pump, no real dump.
🔻 If it drops, how low will it go?
There’s a potential multiple-top pattern.
If CRYPTOCAP:BTC breaks below the neckline at $92,000 with volume—or fails to reclaim it—then the target drop sits at $77,000.
🚀 If it pumps, how high can it go?
A potential multiple-bottom pattern is forming.
If MARKETSCOM:BITCOIN breaks above the neckline at $107,000 with volume—or successfully retests it—then the target is $130,000.
🔥 Short-term strategy
The Feb 3rd candle had significant volume and has been a key resistance level multiple times.
This makes it a strong reference point for entries.
(See orange & light blue arrows.)
1️⃣ Long Setup
Entry trigger: $102,500 (Feb 3rd high)
Stop loss: $91,231 (Feb 3rd low)
2️⃣ Short Setup
Entry trigger: $91,231 (Feb 3rd low)
Stop loss: $102,500 (Feb 3rd high)
💡 Prices vary across exchanges. Use the prices from your trading platform.
🔴 Read my signature & publications for more info you don’t want to miss.
🔥 for more future script "guesses" like this!

SOL Potential drops -55% to $131? Here’s WhyBINANCE:SOLUSDT might be forming another right shoulder of a W-bottom (light blue line). The target drop is around $131, which happens to be the mid-point (0.5) of the descending channel—a reasonable support level.
The first right shoulder has already formed, and its drop was exactly the same as the left shoulder—both at -47%.
However, the best-case scenario would be if it finds support at the upper boundary of the descending channel. Let's see if it can hold there.
🔴 Read my signature & publications for more info you don’t want to miss.
🔥 for more future "guesses" like this!
🔥 I've dropped an analysis for the 2025 altseason on the right hand side if you're using computer, and scroll down a bit to see the link if you're using mobile.

GOLD Daily, H4, H1 Forecasts, Technical Analysis & Trading IdeasDaily Timeframe:
TVC:GOLD has been rising rapidly recently but has almost stopped since February 11, when it hit its uptrend channel line.
With the RSI hitting resistance at 77 and showing signs of falling, there is a high probability that a corrective wave is about to begin.
Four-hour Timeframe:
A rising wedge pattern has formed in the price.
As long as the price does not break the resistance at 2955 and the red line of the rising wedge continues upwards, a downward wave is expected to begin.
A strong bearish divergence has also formed in the RSI.
One-hour Timeframe:
A head and shoulders pattern is forming.
If the price can break the neckline downward and the blue trend line of the rising wedge is also broken, the probability of a downward wave will be very high.

US30 LONG 1) All timeframes are oversold
2) There is very strong support at this level as it has been stuck here for a week
3) There is a pattern on H4
4) Against the trend so try to get out at M15 Overbought
5) 120 pip stop loss

CAMLINFINENSE:CAMLINFINE
Note :
1. One should go long with a Stop Loss, below the Trendline or the Previous Swing Low.
2. Risk :Reward ratio should be minimum 1:2.
3. Plan your trade as per the Money Management and Risk Appetite.
Disclaimer :
>You are responsible for your profits and loss.
>The idea shared here is purely for Educational purpose.
>Follow back, for more ideas and their notifications on your email.
>Support and Like incase the idea works for you.

Gold confirmed the breakouthello guys!
as you can see the triangle pattern formed and the price breaks it out!
so the next target will be the blue area!
around the $2990 area!

GER40 SHORT1. This is against the trend but there is a pattern on M15
2. There is a previous days high resisting this trade
3. There is a lot of divergence on each timeframe
4. If this is able to break the H1 moving average it will be a long fall
5. First chance take half profit at M15 oversold
6. Stop loss of 60 pips

NAS100 SHORT1. There is a pattern on H4, H1 and M30
2. This trade is against the H4 trend so aim to get out quickly
3. Stop loss of 70 pips
4. All timeframes are overbought and there is a lot of divergence
5. Talk half profit at M15 Oversold

EURNZD - Sell Setup at Key Resistance ZoneOANDA:EURNZD is currently trading in a clear resistance zone that has consistently acted as a barrier for bullish momentum. This area aligns with prior supply levels and could attract some seller interest.
If rejection patterns, such as bearish engulfing candles or long upper wicks, emerge, I anticipate a move toward 1.83500 . However, a break above this zone could signal a potential shift in market sentiment.
This is not financial advice but rather how I approach support/resistance zones. Remember, always wait for confirmation before jumping in.

BTC's Potential Up & Down Price Target (Short-Term)BINANCE:BTCUSDT has both bullish and bearish scenarios in play now.
These days, the crypto market has been stagnant—no real pump, no real dump.
🔻 If it drops, how low will it go?
There’s a potential multiple-top pattern.
If CRYPTOCAP:BTC breaks below the neckline at $92,000 with volume—or fails to reclaim it—then the target drop sits at $77,000.
🚀 If it pumps, how high can it go?
A potential multiple-bottom pattern is forming.
If MARKETSCOM:BITCOIN breaks above the neckline at $107,000 with volume—or successfully retests it—then the target is $130,000.
🔥 Short-term strategy
The Feb 3rd candle had significant volume and has been a key resistance level multiple times.
This makes it a strong reference point for entries.
(See orange & light blue arrows.)
1️⃣ Long Setup
Entry trigger: $102,500 (Feb 3rd high)
Stop loss: $91,231 (Feb 3rd low)
2️⃣ Short Setup
Entry trigger: $91,231 (Feb 3rd low)
Stop loss: A$102,500 (Feb 3rd high)
💡 Prices vary across exchanges. Use the levels from your trading platform.
🔴 Read my signature & publications for more info you don’t want to miss.
🔥 for more future script "guesses" like this!

Wait for the Swing DownThis is tempting to buy, but patience is key with swing trading to reduce risk. Coming from the world of crypto, this seems like it would take an eternity (2years). But it helps to know the direction it's headed if you did want to scalp it in smaller time frames.
Green arrow represents the safer swing trade.
Orange arrow represents same bull trend but will still end up in that buy zone anyways.
No RSI divergence yet, and MACD still mostly above 0.

Pattern Identification ExerciseHere I run through an exercise I first started carrying out around 4 years ago. It is a brilliant tool to help train yours eyes to spot patterns within the market, log the data across multiple different instruments and find specific characteristics with that instrument.
The importance behind carrying out an exercise like this is training your lens to spot these in the live markets, and also stacking your confidence so when you see these develop you are able to approach them in the best way possible.
Any questions just drop them below 👇

GER30 SHORT GOOD RISK TO REWARD1.All timeframes are overbought
2. This has a previous days high and it constantly getting resisted at this level
3. There is a pattern on H1
4. Against the trend but there is a lot of divergence and consolidation
5. If this is unable to break the H1 trendline must get out immediately
6. 60 pip stop loss

AUDJPY Is Recovering After The Wedge PatternAUDJPY pair is sharply and impulsively recovering after we spotted the wedge pattern, so it’s now rising in minimum three waves A/1-B/2-C/3 that can retrace the price back to the starting point of the wedge pattern and back to 99-100 area, especially if we consider an unfilled GAP at 98.35 level. Currently we can see it making a five-wave impulse into wave A/1, so after corrective pullback in wave B/2, be aware of a bigger rally within wave C or maybe even wave 3 if goes decisively above 100 area.
The ending diagonal (wedge) pattern is a special type of wave that occurs in wave 5 of an impulse or wave C of a correction. An ending diagonal pattern is a type of pattern that can occur at the completion of a strong move. It reflects a “calming” of the market sentiment such that price still moves generally in the direction of the larger move, but not strongly enough to produce an impulsive wave. Ending diagonals consist of five waves, labeled 1-2-3-4-5, where each wave subdivides into three legs. Waves 1 and 4 overlap in price, while wave 3 can not be the shortest amongst waves 1, 3 and 5.
The reason why they are so interesting is because they are indicating a reversal, usually a strong one, which can retrace the price back to the starting point of the pattern.

Is ETH Done Dropping?A few days ago, the crypto market experienced another brutal sell-off, leaving most traders in despair.
But historically, whales love to shake people out before pushing prices up.
Looking back at past bull runs, it’s common to see a sharp crash forming a bearish pattern, only for the price to suddenly skyrocket—leaving everyone behind.
Will it happen again this time?
I can’t say for sure.
But based on the overall market structure— BINANCE:BTCUSDT , BINANCE:ETHUSDT , CRYPTOCAP:BTC.D , CRYPTOCAP:OTHERS , CRYPTOCAP:TOTAL3 —the bull market still seems intact.
Now, let’s talk about ETH.
The recent crash completely invalidated the inverse head-and-shoulders pattern, and that massive wick just happened to hit the weekly M-top target (light blue line).
Zooming out, the massive symmetrical triangle (yellow lines) from 2022 is still holding.
It looks like the whales intentionally broke below the triangle to create a bearish illusion and scare people into selling.
They did the same thing last August to November—three months of shaking out weak hands at the lower edge of the triangle.
At the time, many turned bearish.
Then, whales pumped ETH back into the triangle and even broke the upper boundary.
So right now, we see similar bearish traps :
An M-top that didn’t break the neckline.
A fake breakdown below the triangle’s lower edge without follow-through.
To me, this seems like another deliberate move to clean up weak hands.
Short-term, we’ve probably already hit the bottom.
From here, we’ll watch how the chart develops.
If you’re looking to enter, now seems like a reasonable time—but make sure you set a strict stop-loss.
🔴 for more future script "guesses" like this!

NASDAQ Long1. There is a pattern on M5
2. This trade is with with the H4 Trend
3. Good risk to reward of 1:2.5
4. Stop loss of 70 pips
5. Quick trade as this is likely to come back down so take half profit at M15 Overbought

BTC, time to prepare for the range breakout!Hello everyone,
I detected some interesting patterns in the current Bitcoin daily chart.
The first range boundary was set mid of November 24, the upper range boundary on Dezember 17. The retest of the lower boundary was at January 13. Maybe you realise the time between the price events is very similiar, so I would expect to see a breakout to happen around the 10th of February (+/- 5 days) . This aligns very well with the seasonal pattern (February is the strongest month for BTC in historical data).
Also we are printing higher lows and are back in the upper part of the range, which is a good position to get ready for the breakout. Targets in the region of 120k are very likely within the next weeks. This aligns very well with the wave count I follow for a while now. You can see the bigger picture in other ideas I published.

Crude Oil Analysis near resistance areaAs the market continues to react to various economic indicators and geopolitical developments, Crude Oil prices are currently at a pivotal point.
Below are two potential scenarios based on the current market conditions.
Current Analysis: Crude Oil is currently facing a critical resistance zone between $71.5 and $72.8. Based on the price action and market sentiment, I foresee two potential scenarios:
Scenario 1: Bearish Reversal
Resistance Strength: The resistance at $71.5 and $72.8 is strong.
Expected Movement: If the price fails to break through this resistance, I anticipate a rebound, leading to a decline towards the $68-$69 area.
Action Plan:
Entry Signal: Monitor for bearish price action signals, such as a Shooting Star or a Bearish Engulfing Pattern, indicating a potential reversal.
Entry Point: Enter a short position upon confirmation of the bearish signal.
Target: Set a target at the $68-$69 range.
Stop Loss: Place a stop loss at $72.8 to manage risk effectively.
Scenario 2: Bullish Breakout
Resistance Strength: The resistance at $71.5 and $72.8 is weak.
Expected Movement: If the price successfully breaks above this resistance, I expect it to rally towards the $77-$77.5 area.
Action Plan:
Entry Signal: Wait for a confirmed close above $72.8, ideally accompanied by a strong bullish candle (preferably a long green candle) to validate the breakout.
Entry Point: Enter a long position upon confirmation of the breakout.
Target: Set a target in the $78-$79 range.
Stop Loss: Place a stop loss at $71.5 to protect against potential reversals.
Summary
The key levels to watch are $71.5 and $72.8 for potential reversals or breakouts. I will wait for confirmation through price action signals befare takeing a decision.

DOW Upside 47600 OR Downside 40024 Technical AnalysisResistance from Channel
Election Rally Over
Strict Sanctions and Reciprocations
