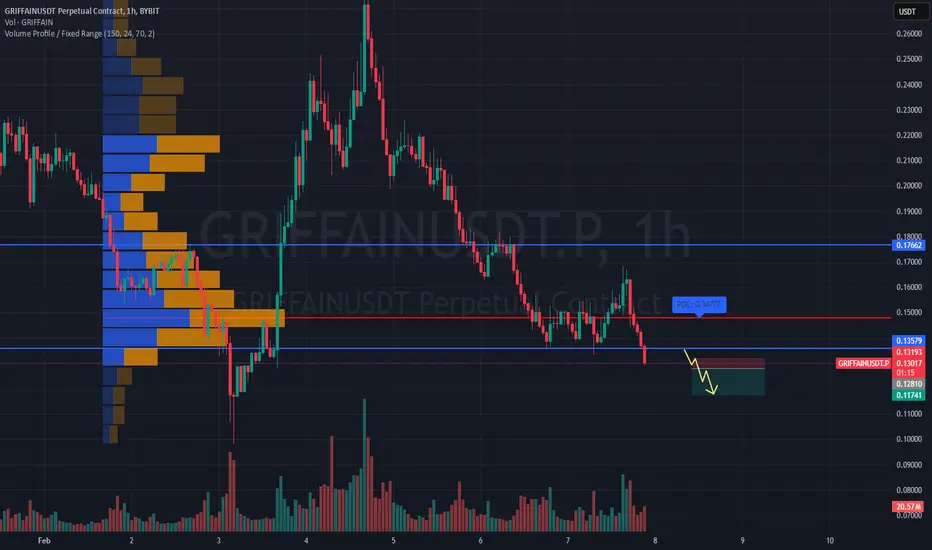
SHORT #GRIFFAINUSDT expecting further downside📉 SHORT BYBIT:GRIFFAINUSDT.P from $0.12810
🛡 Stop loss $0.13193
⏱ Timeframe: 1H
✅ Overview:
➡️ BYBIT:GRIFFAINUSDT.P is showing weakness after reaching a local high, rejecting from a resistance zone.
➡️ POC (Point of Control) at 0.13193 acts as a key volume area with significant trading activity.
➡️ Price action suggests seller dominance, indicating a potential continuation of the downtrend.
➡️ If the 0.12810 support level breaks, expect an increase in bearish momentum.
⚡ Plan:
➡️ Short entry upon confirmation of a breakdown below 0.12810.
➡️ Increased selling volume will confirm the continuation of the bearish trend.
➡️ Holding the position with dynamic monitoring until the first Take Profit level.
🎯 TP Targets:
💎 TP 1: 0.11741 – first target based on the nearest support level.
📢 BYBIT:GRIFFAINUSDT.P is showing bearish signs, but volume and pullback dynamics should be monitored.
📢 A break below 0.12810 could trigger a deeper decline.
📢 If buyers show strength, watch 0.13193 as a possible reversal point.
🚀 BYBIT:GRIFFAINUSDT.P maintains bearish momentum — expecting further downside!
M-pattern
BTC & ALTCOINSIn this chart we can see Bitcoin historical Highs , lows , halving years (green->green) and halvings ... we can see some patterns here , not price patterns but sessionality patterns .. for example .. strong probabilty next btc HIGH will be in November/December this year , or we can also see on chart of BTC.D .. we are close to date when BTC.D breaks and fall as much as alts shine .. But all of this was history what about today ? What if , in this one cycle is something different , for example players ... Old good BTC and Crypto OG players now have less power as manipulators , we have some guys from wallstreet also here , Trump and much more .. Macroeconomic was totaly changed ... so what do you think guys ?

nifty50NSE:NIFTY
ONE SHOULD WAIT FOR FURTHER Breakout ON WEEKLY BASIS.
Note :
1. One should go long with a Stop Loss, below the Trendline or the Previous Swing Low.
2. Risk :Reward ratio should be minimum 1:2.
3. Plan your trade as per the Money Management and Risk Appetite.
Disclaimer :
>You are responsible for your profits and loss.
>The idea shared here is purely for Educational purpose.
>Follow back, for more ideas and their notifications on your email.
>Support and Like incase the idea works for you.

WALL STREET LONGAll timeframes are oversold and there is a lot of divergnece
There is no pattern but this is with the trend
100 pip stop loss
entered at 43895
Take half at M15 overbought

GER30 Long There is no pattern to go long but this is at target 2 of a short pattern above
This is with the H4 trend and there is a lot of support at this level
After the fast drop this tends to bounce back up
stop loss of 100 pips

TURBO IS STILL ON TRACK FOR TAKE OFF !!! (PACK YOUR BAGS) If you have been following my trade trends on Turbo, from the Beginning "TRIPPLE BULL FLAG ON TURBO", well since then we have had both TRUMP coin and DEEP SEEK remove Liquidity from the entire market and pushing the trend into a descending bear flag, Scary times!
But our friend TURBO refused to postpone take off for too long, having broken the bear flag is now heading back into position for TAKE OFF ! ..
TIME FRAME IS LISTED BELOW ! PACK YOUR BAGS ! NEXT STOP 1.5-2 Cents !
I am not a professional trader, I just enjoy technical analysis if you understand the charts than hopefully you can see the same pattern emerging.
TURBO to 1.4 - 2.2 cents by FEBUARY 16th 2025 <---- MY PREDICTION

29.01.25 Morning ForecastPairs on Watch -
FX:GBPNZD
FX:EURGBP
FX:AUDUSD
FX:EURUSD
A short overview of the instruments I am looking at for today, multi-timeframe analysis down to what I will be looking at for an entry. Enjoy!

BTC - Steady... steady... almost there!BTC in the short term is looking very much like a WXYXZ is forming. We should therefore see a low, which could temporarily breach the lower trend line. In fact, it'd make for a bullish signal if it did - so watch this carefully. If we see it ping back within the channel, then the formation will likely complete. Next thing we'll need to look for us the breakthrough of the upper trend line. This would then lead to higher higher and the completion of wave 5 of 1 which we have long been looking for. I'm not going to take any actions here until either trend line is decisively broken leading to a trend change. Looks good though, follow for more.

BRITANNIANSE:BRITANNIA
Note :
1. One should go long with a Stop Loss, below the Trendline or the Previous Swing Low.
2. Risk :Reward ratio should be minimum 1:2.
3. Plan your trade as per the Money Mangement and Risk Appetite.
Disclamier : You are responsible for your profits and loss.
The idea shared here is purely for Educational purpose.
Follow back, for more ideas and their notifications on your email.
Support and Like incase the idea works for you.

AWLNSE:AWL
Note :
1. One should go long with a Stop Loss, below the Trendline or the Previous Swing Low.
2. Risk :Reward ratio should be minimum 1:2.
3. Plan your trade as per the Money Mangement and Risk Appetite.
Disclamier : You are responsible for your profits and loss.
The idea shared here is purely for Educational purpose.
Follow back, for more ideas and their notifications on your email.
Support and Like incase the idea works for you.

ETH copying pattern? Potential drop below $3,000?CRYPTOCAP:ETH seems to be repeating an old pattern—I’ve marked it with an arrow. I first noticed this about 10 days ago, and as time goes on, it’s looking more and more like the left shoulder of a classic head-and-shoulders bottom. Interestingly, the #MACD is perfectly mirroring the same movement too.
If #ETH is indeed forming the right shoulder, we could see a pullback of around 31%, dropping it below 3000 to roughly 2800. This move makes sense, as key players often target psychological levels like 3000, where a lot of stop-loss orders are placed, potentially triggering larger price shifts.
What’s even more intriguing is that a drop to 2800 would push ETH below the lower edge of the symmetrical triangle, which could seriously dent market confidence.
What do you think? Does this match your analysis, or are you seeing it play out differently?
---
Let me know if you'd like further tweaks!

Bitcoin - New All time high incomingAs you can see, Bitcoin is about to close a weekly candle over the previous VSA resistance. $TRUMP token has also pushed bullish narrative onto public therefore I think that this correction is over.
Next stop is around 127k and after that we should reconsider whether there will be continuation or that's it.

MAZDANSE:MAZDA
Note :
1. One should go long with a Stop Loss, below the Trendline or the Previous Swing Low.
2. Risk :Reward ratio should be minimum 1:2.
3. Plan your trade as per the Money Mangement and Risk Appetite.
Disclamier : You are responsible for your profits and loss.
The idea shared here is purely for Educational purpose.
Follow back, for more ideas and their notifications on your email.
Support and Like incase the idea works for you.

Ethereumhello friends
We came with Ethereum analysis.
You can see that after the heavy fall in the specified support area, the price made a good return.
Now, with the defeat of the resistance zone, we can enter into purchase transactions and move to the specified goals with capital management.
*Trade safely with us*

Bitcoin long awaited correctionIf you look at previous years, January has always been bearish. January 2025 is no different. After a long bull run since the latest halving Bitcoin required a correction to gain more liquidity and shake out margin longs. After that it should follow somewhat similar continuation pattern.
Long term prediction stays the same

14.01.25 Morning ForecastPairs on Watch -
FX:GBPAUD
FX:NZDCAD
OANDA:XAGUSD
A short overview of the instruments I am looking at for today, multi-timeframe analysis down to what I will be looking at for an entry. Enjoy!

Stock Market Logic Series #13The double bottom and double top patterns are among the most powerful and reliable indicators in technical analysis. These formations provide traders with insights into potential trend reversals, making them valuable tools in a trader's arsenal. However, one must approach these patterns with patience and discipline to truly harness their power.
Statistically, the price often does not move decisively on the first attempt, and waiting for confirmation can significantly improve the likelihood of a successful trade entry.
A double bottom pattern occurs when a stock's price hits a low point, rebounds, and then retests the same low point before moving upward. This pattern suggests that the selling pressure is diminishing, and buyers are starting to take control. Conversely, a double-top pattern forms when the price reaches a high point, retraces, and then retests the same high point before moving downward. This indicates that buying pressure is waning, and sellers are gaining the upper hand.
One of the key aspects of trading these patterns is patience. It's essential to wait for the price to confirm the pattern before entering a trade. For a double bottom, this means waiting for the price to break above the resistance level formed between the two lows. For a double top, it involves waiting for the price to break below the support level formed between the two highs. By waiting for these confirmations, traders can avoid false signals and increase their chances of entering a profitable trade. This is because you will not fall into the trap of HINDSIGHT backtesting and it is clear that an M or W happened.
HINDSIGHT backtesting is that you have the hindsight advantage when you backtest, but you don't have it when you do REAL-TIME trading.
FYI, TradingView gives you the ability to do a reply of bars ... This gives you the dramatic advantage of seeing if your trading rules are REAL-TIME approved.
Patience is particularly crucial because, statistically, the price often makes multiple attempts to break through these key levels. Impatient traders who jump in too early may find themselves caught in a false breakout or worse an "imaginary breakout", resulting in losses. By waiting for the price to confirm the pattern, traders can ensure that the trend reversal is genuine and increase their odds of success.
Imaginary breakout is when you imagine the price will do what you believe it will do, and it never does it. This cognitive error causes you to enter trades you would have never taken when you backtested your strategy.
John Bollinger, the creator of the Bollinger Bands, recognizes the power of double bottom and double top patterns. Bollinger Bands are a popular technical analysis tool that measures market volatility and provides a dynamic range within which prices are likely to move. When combined with double bottom and double top patterns, Bollinger Bands can further enhance a trader's decision-making process.
TradingView also functions as the best Trading Journal , I have my whole series of stock market logic ideas which I always refer back to. Also, you can add inside the journal idea a picture of the chart that is automatically stored and displayed on the TradingView ideas.
What you see on the chart is a confirmed validated M-pattern (the pink is the manifestation of the pattern), then after it you see a period of "NOT LONG".
This gives you a "TELL" that the probability of the rallies... they are fake.
Then, you see a confirmed W-pattern (the pink is the manifestation of the pattern), then after it, you see a period of "LONG".
This gives you a "TELL" that the probability of the corrections... they are fake.
When YOU, yes YOU, "KNOWS" statistically, when a fake pricing happens... this is a very lucrative business opportunity...

$ABNB $110 target; head and shoulders forming 1MAlmost a beautiful looking head and shoulders forming here on $ABNB. Honestly, as I sit here now, will the Los Angeles wildfires have any effect on NASDAQ:ABNB negatively or positively? Will hotels get a boost? Let’s think about how many Air BNB’s got burned away in the Hills? Interesting. I don’t have any beliefs in NASDAQ:ABNB $110 is the target and looking at April 17th. Also another revelation occurring.. Robinhood has April 17th as an expiration date but that’s a Thursday. What is going on?
WSL

QM PATTERNhello friends
We have come up with a good and frequent pattern.
This pattern starts with a sharp movement in the direction of the trend, and its return must hit the previous ceiling, and we enter the trade in the determined pullback.
The first target is the previous ceiling and the second target is twice its movement.
*Trade safely with us*

NIKKEI LONGThere is a pattern on M15, M30 and H1
This trade is with the H4 and Daily trend
Stop loss of 200 pips
Take first profit at M15 overbought

GBPCAD - Weekly Forecast - Technical Analysis & Trading Ideas!Midterm forecast (Daily Time-frame):
While the price is below the resistance 1.82310, beginning of downtrend is expected.
Technical analysis:
A peak is formed in daily chart at 1.82320 on 12/19/2024, so more losses to support(s) 1.79228, 1.78439, 1.76819 and minimum to Major Support (1.74790) is expected.
Take Profits:
1.79228
1.78439
1.76819
1.75765
1.74790
1.72705
1.70900
1.69267
1.67670
1.65599
1.63703
1.60894
Short-term forecast (H4 Time-frame):
A Head and Shoulder Reversal Pattern has formed and the neckline has also been broken.
Price is touching the neckline again.
It is very likely that the downward wave will start from this area.
__________________________________________________________________
❤️ If you find this helpful and want more FREE forecasts in TradingView,
. . . . . Please show your support back,
. . . . . . . . Hit the 👍 BOOST button,
. . . . . . . . . . . Drop some feedback below in the comment!
🙏 Your Support is appreciated!
Let us know how you see this.
Have a successful week,
ForecastCity Support Team

$FUN stops here; bearish expanding triangleTake a look. Will try to short this. Can even make a case for head and shoulders forming as well but for patterns sake there is a bearish expanding triangle here.
WSL.

The pattern identified in THE XRP BREAKOUT CHART continues...The pattern that I identified in mid-2024, where the price action forms a fair value gap followed by an 8-month candle pattern (3 + 5), and then breaks out on the 8th candle, is playing out exactly as predicted many months ago. This means that if the pattern, which has occurred identically four times thus far, repeats for a 5th consecutive time, we can expect an incredible period of price appreciation following the breakout of the 8th candle in the month of May 2025.
I believe that around mid-April to early May, we will see a 'flash crash' type of liquidity run on the sell-side liquidity before the 8th candle breaks out as predicted.
Prepare to be amazed!
Good luck, and always use a stop loss!
