BTC recovering a bit at the momentRight now we have a bounce in Major Support area, Although it was broken. We have Buying Climax, Good bull pressure at the moment, but be careful with traps, you all know my strong analysis.
We can be headed to 6.9k where I found first good resistance using Fibonacci, if we can get pass through this area, we might try to break stronger resistance at 7.6k, speaking of which we couldn't get pass last week, so I really don't believe we will this time- I'm just aware that anything can happen, and indeed, we can break it.
This is a 'zoom in' chart analysis. we also have RSI showing strength and a bounce in the 20 level at oversold area, and has crossed above the smoothy EMA so, we also have an important resistance at level 56 in RSI but I guess that just something to watch out not SO important.
I will be updating this chart as soon is showing some good info!
Give a like guys!!
M-RSI

BITCOIN Possible SHORT - RSI DivergenceAs we are seeng a RSI divergence on 4h for Bitcoin, possible a big Down movmenet. We already have a failer swing. .. Stay tunned

Falling Wedge & Positive Divergence & Good New's AheadWTC is holding to 78.6 fib level for a couple of days.
Falling wedge is about to end.
You may see a positive divergence on about every indicator.
Stoch RSI has just crossed on Daily.
RSI is about it's lowest.
Demand index is about to break downtrend.
The team also announced that new partnership signing ceremony for application deployment to be held in 3 days !

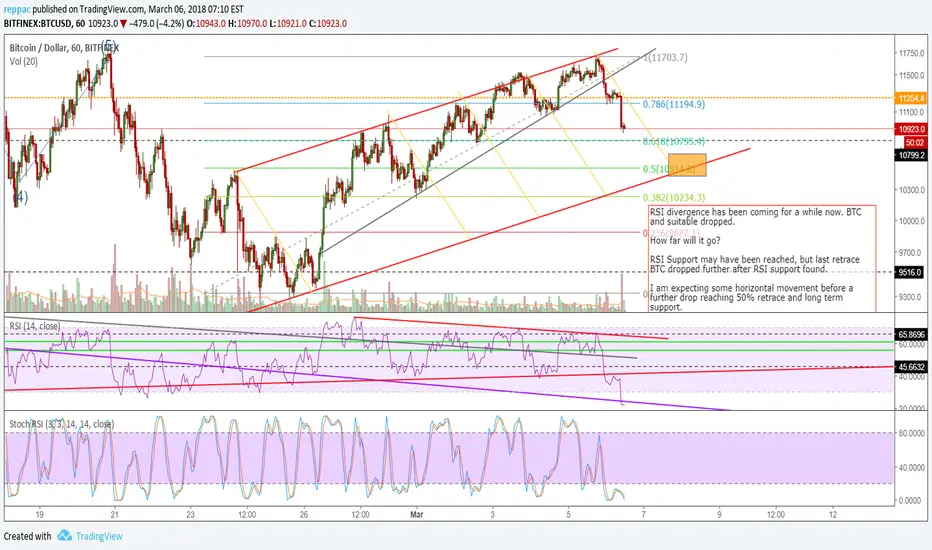
How low can you go?RSI divergence has been coming for a while now. BTC and suitable dropped.
How far will it go?
RSI Support may have been reached, but last retrace BTC dropped further after RSI support found.
I am expecting some horizontal movement before a further drop reaching 50% retrace and long term support.
Caveat : I am not a professional trader or adviser. Do your own research before making any trade. Never trade more than you can afford to loose.

EURNZD 4H New Trade Setup - RSI 80-20 Reversal LongPair created a new swing low on that invalidated the 1st 4H trade setup.
Now the rules of the RSI 80-20 Reversal have been met.
1st Swing Low (SL)- oversold RSI - 2nd new Swing Low - buy stop at high of 1st SL
New 30m Timing Trendline drawn
Entry at 4H Buy Stop
Take Profits will be shown on update

Litecoin (LTC) Technical Analysis and Trading Strategy. Follow!Between COINBASE:BTCUSD and HITBTC:LTCBTC , I must saw I'm more bullish about HITBTC:LTCBTC . I think we can all agree that the lower transaction time and cost make HITBTC:LTCBTC more competitive. Buy-in and sell points for HITBTC:LTCBTC , at least in the mid-term, are indicated by RSI deviation above and below the channel with a rapid increase or decrease in prices directly before. I don't have a buy-in range because it doesn't seem like a good time to buy or sell right now. I will be updating this idea a couple of times a day on this post until we even out or exit our upward-trending channel.
We're right around the middle of our channel here, so I'm holding tight. I'd like to hear your thoughts on HITBTC:LTCBTC ! Please comment below, as the more input we see, the more informed we are!
*** This is not a recommendation to buy or sell, this is for educational purposes only! ***

Buy VRC/BTC4H :
- Up trend
- Level : Trendline
- Signal : Ok
=> Stop Loss : 0.00013760 ; Take Profit : 0.00018200

USDZAR weekly trend at crossroads. Levels strongly supported.At first I thought that the USDZAR downtrend had been halted and a new uptrend started. However, price has respected a previous important high (August and November 2016)and has quickly moved down to just break past and sit at the previous low set March 2016. Currently it looks more like a long term range forming. The latest up moves were from potential political difficulties, then with the new ANC presidential election the pair moved down rapidly. There may be a further political wrangling until the elections in 2019 and it is likely to cause swings both up and down (difficult to predict).
Technically there is very good support at these levels and prices have held, however the levels have been broken. If the price continues strongly downward then a new down trend could start. If prices rise from this level, it could get stuck between these two levels (12.30 to 14.50). I am neutral at this immediate moment as I am waiting for price to determine what will continue to happen, it could go either way. Also if the range sets up then this too adds to the neutral stance which may be opportune for range trades.
There are opportunities to buy now with a stop just below at around 12.00 or 12.10 with the view to targets at 14.50. There is also an opportunity to sell as price could continue the general trend of the last two years. I am leaning more towards the side of Long at this moment as the RSI is very low (though currently bearish) and may be displaying bullish divergence. To be safe, we wait for confirmation from price action, with a smaller trade by money management for a long trade with space in the stop loss for a fake out.


RSI Indicator - Technical Analysis Summary using ETCBTC D ChartGeneral RSI Indicators applied to the ETCBTC D chart (where present). This helped me in taking in the lesson below from Crypto Cred.
I hope others find it useful.
Source Used: Thanks Crypto Cred!!
www.youtube.com
www.babypips.com


Ballard PowerThis Seeking alpha article, seekingalpha.com , explains the main sector that is the driving force of this business. It also, is the reason for the recent surge in stock price and makes it a very safe play, in terms of minimal risk.

NZDUSD - Going down to 0.63411 - Wait for good moment to shortAll timeframes on NZDUSD are bearish. Next longer timeframe target is 0.63411, which is the last bottom on the Monthly timeframe
Target: 0.63411
Invalidation point: 0.70644 (last bottom on Daily timeframe)
See below the multitimeframe analysis
M) Down: Bearish Range Rules (Relative Strengh Index moves between 20 and 60), Bear retracement exactly at 50%, Price is lower as several moving averages. There is one contradiction, which is the bear divergence on the CFG Indicator. The CFG on the monthly chart is showing lower tops while the price is giving higher tops. That indicates a short bear detour after which the market should resume it's bull trend. Due to more bearish evidence as bullish, I'm prefering the bearish scenario instead of the bullish. Next target is the last bottom at 0.63411
W) Down: Relative strengh indicator recently broke below 40, Positive reversal target of 0.78116 is not achieved, which is very bearish. The weekly traders are clearly heading down.
D) Down: Bearish Range Rules (Relative Strengh Index moves between 20 and 60), recent Negative Reversal Target of 0.7006 is being hit. That pricelevel is now resistance. In addition to that the prices are below the moving averages. The daily traders are clearly bearish. Wait for a Negative reversal on this timeframe (or lower) to enter the market
4H) Down: Bearish Range Rules (Relative Strengh Index moves between 20 and 60). Prices are below the moving averages. The 4H traders are clearly bearish. Wait for a Negative reversal on this timeframe to enter the market.
Conclusion: All TF's aligned, find a Daily or 4H Negative Reversal to enter the market with as target 0.63411


EURUSD - Moving down to 1.146 - search for good moment to short EURUSD shows arguments to expect a further decline on different timeframes. Wait for Negative Reversals on Relative Strength Index or CFG to short the market.
Next target: 1.146 (based on weekly timeframe)
Invalidation point: 1.17111 (recent bottom on daily and 4H timeframe)
See analysis of multi timeframes below:
M) Down: topping at 60, below fibo 50% level (1.22) protecting bear perspective
W) Sideways: RSI < MA's, on its way to test MA's on price around 1.146
D) Down: RR, NR TA Hit, resistance at 1.17586 and 1.17111
4H) Down: NR TA Hit, Range Rules, resistance at 1.17094
Search for NR's to enter the market

District0x Long Opp-- RSI trading As you can see I've been playing DNT like an absolute fiddle. I see this as a great long opportunity because I still consider DNT undervalued in terms of market cap, and think it has a lot of room for growth. Since its initial pump, it's been staying faithfully within the ascending channel while drawing down between fib levels of resistance. I definitely see DNT remaining in this upward channel for at least until it recoups the initial losses to the ATH, then I will revise this idea accordingly. Not much opportunity to backtest the RSI settings on this one, it's only been on the exchange a week or two. However, I'm looking at the hourly chart with 18 periods in the RSI and as you can see the negative divergence highlighted in red signaled the end of the run.
I'm using 24 periods in the STOCH RSI to include a larger time frame, smooth the indicator a bit and provide fewer false signals by accounting for more of the macro trend. When a divergence appears here, it will be more reliable than on the other RSI indicator.
Watch for any breaks below the long term trend line in green.

Up Trend Resuming !-If you could remember in the first week of this month I published an idea describing au is about to hike in many ways, now we have that moment again as the pair is retesting the major level again !
-Now we nearly have same scenario with RSI almost in oversold area.
-Buying at current levels could still get you a pretty sweet deal especially if you aim for the previous highs near 0.7880, with 1:2 risk to reward ratio.
-Best of luck bros $$

Up Trend Is Resuming !-As you can see, the pair is having trouble breaking below a major demand area at 1.6800 , which isn’t surprising since it lines up with a 38.2% Fibonacci retracement, with RSI almost hitting oversold levels.
-Based on the long wicks below the area, it looks like forex bulls are defending the support very well, Not only that, but a bullish divergence has also popped up to reinforce a bullish trade!
-Buying at current levels could still get you a pretty sweet deal especially if you aim for the previous highs near 1.6980
-n any case, just make sure to practice proper risk management, a’ight?


DJIA/DOW JONES short idea (m30/H1)Dow Jones INDEX:DJY0 formed a bearish Wolfe wave.
Being supported by RSI divergence at m15-m30 timeframe and significant stopping volume at point 5, it appears to be a good sell entry point.
Crossing line 2-4 supported by increased volume should confirm the move South.
Opened 3 positions at 22049/50, SL 22167, TP 21878
GL All!

Bitcoin - Corrective Wave BElliott Wave 12345 Impulse wave + ABC Corrective Wave
If RSI hits the overbought level around 70 may confirm the wave B.
High volume can get btc to their ATH price.

Potential Short pos. on NZD/USDReasoning:
-We've got a symmetrical triangle but judging by the indicators (Bearish Divergence) the pair looks like it will breaking out to the downside
-TP target would be set on the still fresh demand zone, a little higher up from S1 pivot
