Gas just got expensiveIn the chart is the M2 adjusted price of gasoline matched to the current price. It measures the portion of total dollars it would take to purchase a gallon of gasoline. Essentially it's a chart of dollar strength in gasoline terms.
Chart up = strong gas, weak dollar.
Chart down = weak gas, strong dollar.
The white trendline in the center is the longterm linear regression, the center of the logarithmic price distribution (but only back to 1986).
To calculate this symbol yourself:
RB1! price = 3.798
RB1! / WM2NS price = 0.0001758
3.798 / 0.0001758 = 21604
Now we simply enter RB1! /WM2NS*21604 to get our current price.
What the chart does not show is that over the years, public ownership of the dollar supply has gone down. As you pump unwarranted dollars into the economy, you get diminishing returns on real gdp growth and thus a reduction in productivity. No measurements are being made, dollars are only being thrown into the system. More doing, less thinking and measuring. Therefore, people have less overall dollars, relative to the total supply of dollars, to spend on gasoline as they did in previous decades. For example, around the 1970s, the FED could squeeze out about 70 cents in GDP per 1 dollar printed. (Actually they didn't squeeze anything, they just sat on their ass) Fast forward to 2022, these reckless and dogmatic pseudo-scientists are getting around 30 cents per dollar printed. If people are economically half as productive overall, PERHAPS everyday people will only be able to afford about HALF as much stuff and therefore half as much gasoline as when it was just as expensive in the past. Just something to think about, seeing as how regular citizens didn't get much of that money. Those who work the hardest are not worthy of the easy money printed by our glorious church of the FED.
Consider how gasoline peaked around 7$ multiple times, in '85, '90, '05, '06. Now imagine if society was half as productive back then, that's basically saying it's 14$ in today's terms if you account for money productivity AND money supply expansion.
Probably not the most settling idea.
Good luck and hedge your bets.
M2

Gold Spot to $2600 by 2024Gold ( OANDA:XAUUSD ) is forming an immature cup and handle on the monthly with a price target of $2600. On the weekly, we see it has broken above this triangle as you see in the chart below. That move is not confirmed yet either, but if next week, gold trades above this week's close, then we set a price target of $2060 and set a stop loss below the recent low.
Charting Gold versus M2 Money Supply, we see gold hitting a historical low of 2007 which has supported the price many times between 2007 and today where it remains a strong support.
Let me know what you think. Leave comments and if you like, leave a like. Cheers.

"Meta" Collapsing "Platforms"Purchasing power gains lost. PE ratio is 15. So where are the real gains? Should we be expected to wait 15 years to get our dissolving dollars back from dividends?
Good luck and hedge your bets.

Long Term ResistanceRunning into large historical resistance.
Should be interesting to see where this heads.
Protect your investments appropriately.
This is not financial advice.
Thanks,


Don't fall for the NarrativeThere's a general narrative going around of "buy the dip" and "look at these undervalued stocks". The goal here is not to compare Facebook to Microsoft to Paypal as companies, but to look at relative price structure between a handful of popular stocks. In this case, we have a few giant companies; Tesla , Facebook and Microsoft , charted against the smaller Paypal and Netflix , and which have taken a recent beating (along with Facebook ). The lines in the chart are an 1800 week linear regression of Microsoft's per-dollar performance relative to the M2 . The lines don't mean anything and are merely a rough guideline of history-projected asset strength. The prices are M2 adjusted to account for money supply expansion.
Facebook has been underperforming since 2018 after making a huge run in 2013 onward, but the notion that "it's a good deal" hardly stands up if you look at the relative trajectory of Microsoft and Tesla . Facebook was one of the biggest to rise, and was one of the first to fall. Microsoft on the other hand has a huge history of being an efficient capital allocator, and will probably be one of the last to fall. Let's ask the question: If Microsoft and Tesla make the same correction as did Paypal and Facebook , do you think Paypal and Facebook will be lower or higher following this hypothetical correction? The gut feeling here is that Paypal/ Facebook / Netflix /Peloton etc. COULD end up falling even more, given that many of these larger cap stocks are still standing well. I would rather short Tsla / Msft than long Paypal/ Facebook / Netflix /Peloton etc. given the current environment.
It's easy to want to fomo into these stocks when you look at a year or two of history, but I think this paints a more realistic picture.
Good luck and hedge your bets :)
Note: The arrows are not price targets, just medium term directional indicators.

The FED Roach InfestationMoney supply expansion is like roaches. It goes everywhere you don't want, and nobody can control it.
Plotted here is the money supply to futures ratio of soy, wheat, corn, and sugar. We have the potential to see a massive increase in food speculation, simply because it's not risky. When equities burst, the money goes anywhere it can. So we should expect a breakout here unless the fake money kicks back into gear.

BTC/M2 Bitcoin channel trendline accounting the money (M2) supply.
If you ask me we are still in the channel dating back to december 2018. What do you think?

Don't Be Fooled By DissonanceMarket participants are often fooled by the dissonance of nominal yields versus real yields. Ie, what is the nominal return of the S&P, versus the return of the S&P per dollar that exists?
The money supply has become merely a proxy to supply hedgers against the dollar with scarce assets via cheap, practically free, dollars. But if you look at the real rate of dollars per S&P share, this seems to have been a leading indicator which preceded a period of decline. Not only is the divergence present, there's an overall dominant divergent structure that appears when you combine the trend of these singular divergences (purple). This is in stark contrast to the bull market in the 80s/90s (green). Very interesting.
Cheers and good luck out there!


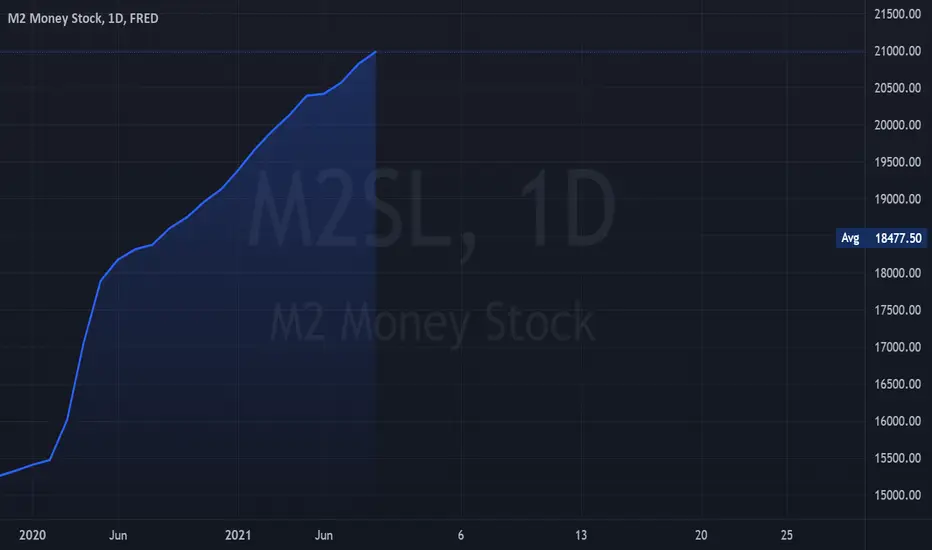
S&P 500 Has a Lot More Room to Grow, Too Early for a Recession.If you look at the S&P500 index ( TVC:SPX ) chart, you find that it has reached, and even surpassed, the previous high at 3393.5 which occurred just before the CV19 drop in March 2020. The last close on 31 December 2020 was at 3760. However, many attribute the recent V-shaped recovery to the Quantitative Easing scheme by the Federal Reserve, which makes a lot of sense. Printing money accelerates inflation and raises the prices of everything including stocks. If you haven't yet, look at the M2 Money Supply ( FRED:M2 ) (chart below) to get a feel for the scale of the increase in money supply during 2020 relative to the past 20 years.
Below is the chart of SPX for the past 20 years.
Below is the chart of M2 money supply for the past 20 years. Notice the jump in the last year.
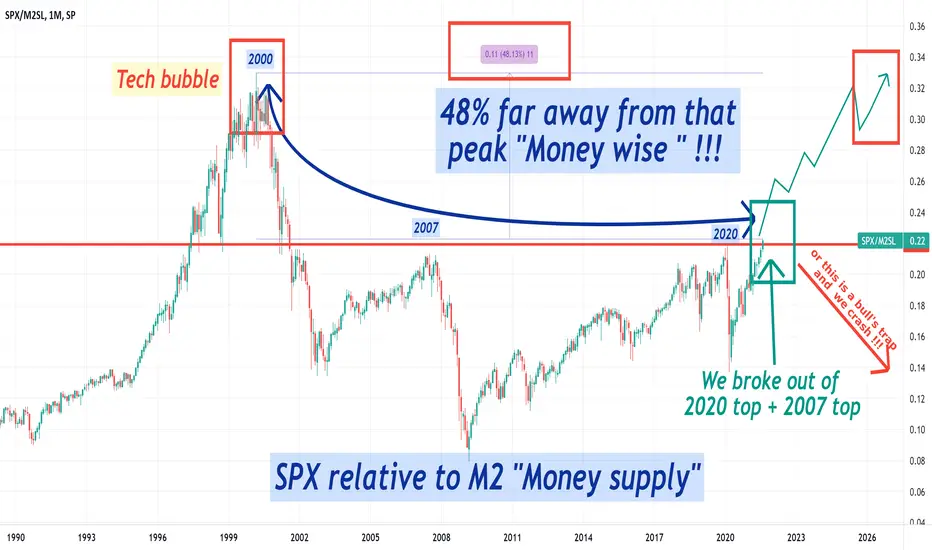
This analysis looks instead at the chart of SPX divided by M2 . That gives us an inflation-adjusted look at SPX. We notice that the index has not yet achieved the V-shaped recovery. It is 2/3 of the way there. What's more, even the Feb 2020 high is not higher than the 2007 high that was just before the house mortgage crisis, and the latter is not higher than the dot-com bubble high in 2000. This simply means that making money through the S&P500 is not really making money, not really increasing the value of your holdings, but it is rather a mere hedge against inflation; and a failed hedge at that. It hasn't even achieved previous highs.
With all that being said, I do not believe that the March 2020 correction was anything to be scared of. I think we will achieve the high that occurred just before that drop. I say do not fear a major correction, let alone a recession, before we reach the top of the parallel channel as the arc arrow indicates. And keep your eyes only on the inflation-adjusted chart of SPX.

BTC Normalized to M2 Money Supply - Bottom in?BITSTAMP:BTCUSD
In an era of exceptional money printing, macro trends must be looked at through the lens of the money supply.
Has BTCUSD/M2SL reached critical trendline support, or will we go back to ~$31k and test once more the 2017 ATH normalized to M2?

Omen - Real TermsA large player seems to be making decisions based in real terms, which is not revealed by the socially accepted AAPL chart which is based in dollars. Will future traders be enticed by such numerical values if it eventually harms them?
To be clear, in this idea:
"real terms" = the price as a proportion of total dollars, adjusted for debasement
TOTAL_USD = M2, a rough measurement of broad money
When we have the option of making decisions based on an infinitely expanding, numerical value (ex. 1 AAPL = X USD), which is purely speculative in current times, versus a ratio of 1 AAPL as a proportion of the total supply of dollars (1 AAPL / TOTAL_USD), at some point we have to take off the beer goggles and question what we are actually looking at. Especially when we know that the expansion of TOTAL_USD directly fueled the price rise of 1 AAPL. In this idea, we are talking about an absolute ratio that measures 1 AAPL to a pool of total claimable future wealth, we'll call that "money". Such wealth is expanding slower than the total number of dollars, which are IOUs on that wealth. It has become increasingly risky to use 1 USD as a measurement ruler for wealth when the ruler we're using measures a claim on debt (IOU), not the wealth it represents, and whose total supply changes size quickly in short periods of time. Take a few measurements, and it's hard to tell whether your stick changed, or the thing you're looking at changed. We reference TOTAL_USD as a more stable representation of this total pool of wealth. Perhaps in some other era, we'll use something increasingly valuable with a low supply as a ruler (it's almost as if it might already exist), but desperate times call for desperate measures.
Put another way: suppose you want to design a model to predict if a stone will skip on a pond, or sink into it. Would you rather have, relative to our stone, a surface to skip stones on which is 1) a non-uniform surface that will change texture and angle in any way at any time, or 2) a relatively flat surface? Even though the proportions of our stone might change (stock splits, acquisitions, etc.) it still makes more sense to choose something to bounce (price) it against that's relatively stable that we can aim at. Since 1 USD is relatively increasingly unstable across asset classes, ie. the speculativity of these assets becomes purely based on the revolving door of the total supply of IOUs, and not based on the purchasing power of 1 USD. Therefore, we use the total supply of dollars as our stable surface.
What do you think? Useful? Witchcraft? Future traders will be even more blind by the social acceptance of pricing things in 1 USD? Will they be less blind and come to their senses? Doesn't matter and markets will be exuberant anyways? You hated it?? Great!
Comments welcome ;) Cheers!
Note: M2, which is based in billions of dollars, was multiplied by 100 in the chart because there's a bug that doesn't show horizontal lines for chart values that are very small. So it does -actually- show a somewhat correct ratio in total dollars, but it's missing 0s behind the decimal.

M2 VelocityA conundrum?
No, absolutely not.
2022 it will reverse as scarcity becomes undeniable.
____________________________________________
Why are we losing Jobs in the Retail Economy?
Why was Black Friday / Cyber Monday dismal?
_____________________________________________
Herding Cats - if you've ever attempted it, can be quite
challenging.


Dashboard of key Fed balance sheet and money supply/velocityThe parabolic ascents seem to end in a couple cases around spring 2023 (April) if the parabolas are correct and hold up. This is all based on the magic of compounding (debt). At some point the debt bubble gets too big and pops.

M2 - Monetary PolicyFurther Expansion is ahead.
Price Instability.
A Macro Environment unseen in Centuries.
______________________________________
Longer-Term the Trend is clear, M2 never recedes
it only expands.
Timing the next move in Equities... will be tied to
later moves far higher.
______________________________________
Probability - 100%
The Dow has Extensions to 62,200.
Something to Consider
SPX. If you are looking for the tech bubble of 2000,think again!Before May 2020, M2 consists of M1 plus (1) savings deposits (including money market deposit accounts); (2) small-denomination time deposits (time deposits in amounts of less than $100,000) less individual retirement account (IRA) and Keogh balances at depository institutions; and (3) balances in retail money market funds (MMFs) less IRA and Keogh balances at MMFs.
Beginning May 2020, M2 consists of M1 plus (1) small-denomination time deposits (time deposits in amounts of less than $100,000) less IRA and Keogh balances at depository institutions; and (2) balances in retail MMFs less IRA and Keogh balances at MMFs. Seasonally adjusted M2 is constructed by summing savings deposits (before May 2020), small-denomination time deposits, and retail MMFs, each seasonally adjusted separately, and adding this result to seasonally adjusted M1.
The purchasing power of BitcoinThe price of BTCUSD keeps rising up, but so does the supply of broad money (M2). So far this year both have grown 227% and 25% respectively. There is more money now than there was at the beginning of the year, 1/4 more. Based on this metric alone, one dollar is worth 3/4 of what it was worth at the beginning of 2020. Today:
One BTC is worth 2.27 BTC from a year ago
One USD is worth 0.75 USD from a year ago
The price of Bitcoin is going up because it appreciates in value, but also because there are more dollars. How could we track the value increase of Bitcoin while accounting for the dollar devaluation? Another way of formulating that question is: How can we track the purchasing power of Bitcoin?
Historically, the price of gold has kept up with the growth of the money supply. (See Lyn Alden's core gold model ) Gold is a well-established store of value. Measuring the price of Bitcoin relative to the value of gold is a way to keep track of its purchasing power. That is what the first graph plots, the cost of Bitcoin denominated in grams of gold.
The last ATH was 484.76 grams of gold.
On Nov 16, the resistance of 303.07 grams was crossed, putting the price on a trajectory to reach the previous ATH.
Bitcoin still needs to rise another 25% to make a new ATH in gold terms.
The second graph plots the gold price (USD) for the quantities (grams) identified as support or resistance in the first graph. It is fascinating to see that the USD/Gold-grams levels result in an even tighter fit than the manually drawn price levels.
You can add the AU usd/grams levels to a chart with this indicator gold price levels denominated in usd/grams

M2 VelocityM2 consists of small-denomination time deposits >$100K - less IRA and Keogh balances at Institutions.
Balances in retail MMFs - less IRA and Keogh balances at MMFs.
M2: Savings Deposits, Small-Denomination Time Deposits, Retail Money Market Funds, + M1.
____________________________________
In Sum, Consumer Economic activity and Balances.
____________________________________
The Velocity of money is calculated as the ratio of nominal gross domestic product (GDP)
to the money supply (V=PQ/M), which is used to measure Economic strength and/or
Consumers' willingness and/or ABILITY to spend money or Consume.
____________________________________
The Federal Reserve is well behind the Inflation Curve.
Initially, 2024 was the year for Fed Funds rate increases.
It has since moved from 2024 to 2023 and now there is a
73% Probability of the Federal Reserve increasing Fed Funds
twice in 2022.
8 Months of tapering at the indicated removal of $15Billion
is not going to occur.
The Federal Reserve will not be able to delay, they will increase
the reduction to Bond/MBS Purchases in order to begin a Rate Cycle
sooner than Equity Complex Participants have assumed.
Thye have not recognized the underlying ISSUES, should Money
Velocity begin to increase... they will be forced to reduce QE
faster and further than the majority are anticipating.
4 Fed Members prefer to conclude the Taper at the end of March 2022.
____________________________________
Peak Earnings are now behind us, Q2 2021 was the Zenith of this
Credit Cycle.

BITCOIN Bullrun Resumes $230K April 27th 2022 !!!!Just the Charts..Welcome to the 50th Anniversary of the Nixon Temporary Fix to fund wars overseas. This is the end of the crooked, evil and war driven dollar that enslaves the poor and youth.
Wage Love, not war. What are we fighting for? Evil dollars? Let math and true guide us forward!
CHARGE WALL STREET! CHARGE CROOKED BANKSTERS AND GOVERNMENTS! Civil Servants need to be civil and serve. Do good work, pay your taxes for good schools, roads and healtcare. Punish the crooks, not the honest, well meaning people of this earth.
Wall Street, your days are numbers. People, only trust the truth and challenge everything else!
JustCharts - Unmanipulated, 24/7, world wide, equal playing field. Bye bye BS regulators feeding us BS derivatives! The World People have spoken!
Bitcoin - Fixed supply, open ledger, worst thing for crooks and banksters!
Ethereum - Move over Cobol, Fortran and all the duc tape in financial systems and the ancient SWIFT BS system. It's done.
Shibarian Coins - Let the world masses decide the value of the World Penny.Let the Shiba Uni dog packs lose on Wall Street. Bite the crook HARD. DOGe with the power of SpaceX and rocket scientists and SHIB, the trojan horse that will tell the world how worthless the dollar really is!
Shitcoins; Toxic crapola with the first than needs a worldwideban is anything pretending to be the USD without the backing of the US Government and military.
Hint: Why are UK and Canadian regulators telling citizens and crypto exchanges to avoid USDT? Think about it because you use that garbage to store value. It's toxic. Massive run out of USDT expected and that bank is EMPTY! LOL! If you put money in a shitcoin, have some fun and play the musical chair. Be warned, on anything but the top two, the music WILL Stop.
ETH is even better than BTC but anything is better than unbacked paper of ANY kind! OH, and pay your taxes. El Capone or McAdfree could not evade. If you're a bad guy, ETC and BTC is NOT for you. LOL

AMGEN who knows what they do, but it has to do with moneyInteresting compare to the crash off in money supply velocity to Amgen’s delayed bull run
Maybe something to do with their business model.
Also compares to money supply and seems to correlate with increase in money supply dollars finding their new homes as we can see as the money supply velocity drops off drastically.

Growth Cycle Analysis of USD Supply.This is not entirely about a trade, moreso a thought experiment of the future to come.
After the great 2020 coof liquidity crisis a brief and severe expansion of the monetary supply occurred in order to bail out the entire economy. This seems to be followed by an equivalent expansion rate mirrored by the 1971 expansion. The marked difference this time is that the interest rate is 0. To reign this in would require negative rates, or capital controls, AND a major collapse (which I do not think will be permitted).
