Divergence at R1, back to pivot?Here's another pair I spotted that might be reversing nicely, just like the AUDNZD I posted a few minutes ago. Same divergence in the MACD, occuring at R1, starting to see a lower-high with price struggling at the R1 level.
Moving Average Convergence / Divergence (MACD)

Divergence, might reverse back to pivotGood morning traders, spotted some divergence on AUDNZD H1. Going to keep watching this pair, looks like it might touch the R1 and reverse back to the weekly pivot point. I wouldn't enter too early, look for the classic double-top confirmation. Let's have a good week.

USDJPY Possible reverse back to pivotNormally I like the bounce from R2 back to the pivot, but I believe the R1 can be just as good, especially as we see some divergence in the MACD. This gives us a nice 3-1 RR. I'm not 100% confident in this trade, but the risk to reward ratio helps me sleep at night.

AUDCAD Shorts Coming Up SoonPrice at the moment is correctively rising so what I am expecting to see of this pair is that price is going to fall soon. We are currently seeing divergence on our MACD which signals a reversal may happen. Good luck and safe trading.

EEI - Possible Short Term SetupNASDAQ:EEI
RSI is oversold
MACD bearish trend is weakening
$EEI #stocks #stockmarket

NCMI - Setup of Possible Short Term GainNASDAQ:NCMI - Setup of Possible Short Term Gain
RSI is oversold
MACD bearish trend weakening
Wait until RSI is over 30 for a couple of days in a row.

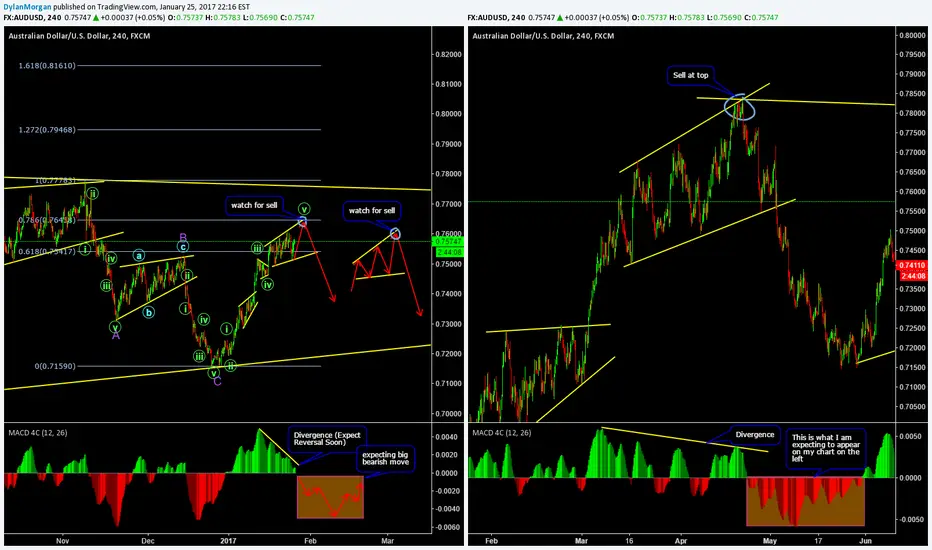
Sell AUDUSD At TopHey everyone. The pattern we were expecting to see on AUDUSD has changed and we no longer will consider it. So, we will watch for price to reach the top trendline and see how it reacts. MACD is showing divergence which signals reversals. Good luck and safe trading everyone.

MACD Divergence and Pattern Setup On AUDJPYThere is divergence on MACD and we have a pattern setup. Look for a sell at the top and see if we get a break at the bottom. Good luck to all

EURUSD near a breakout period looking on a previous trend we can see that EU has recently touched the trendline for the 4th time, however, given previous supports in the 1 hour an aggressive entry could be a good idea in order to get filled. Given the MACD overextended on the previous up move, we should expect the price to retrace before going back up, though a move up could also create an entry signal by breaking the downtrend and possibly send price into consolidation for some time given the near overbought conditions.

Good sell opportunity with a decent Risk reward ratioA few things here
Broken support line
MACD has just crossed and entered the sell zone, shown by arrow
RSI has a broken pattern as well, indicated by the arrow
To set stop loss level, it is clear there is a strong resistance at around 1.075, as it bounced back down twice from this price, so 1.08 is a safe level
As for the Reward, Fib and previous structures show there is a potential turn around at about 1.05 (also because its a round number as well)
Let me know what you think guys :)

NZDUSD: Starting to break the trendline, might be reversingNZDUSD 240 chart, starting to test the trendline, looking to break through... going to watch this one as it's sitting right on R1 on the monthly pivots... expecting price to start dropping in the direction of the monthly pivot point... thoughts?

USDCAD: Possible Short?Looking at the monthly pivot points and the trendline, I'm expecting price to test the trendline and start moving down to S1... thoughts?

EURUSD bounce backI think that the there is an option to go long on this pair in the short term. It is failing to break the S1 pivot support level, I'm predicting a TP @ the pivot level. Further MACD analysis confirms this and indicates a trend reversal. Good luck!

Filling the Gap?For the past month, price has been pushed down slowly staying near support for most of the time. Also, the 20ma has been acting as a dynamic resistance, and price has seen more resistance from a descending trend line.
Price has just broken and close below support (Double Blue Line)
Price has also closed below the 50ma, which has acted as dynamic support/resistance in the past.
There is also a head & shoulders pattern on the MACD Leader, and Insync Index
Price target is $87.88 for a R:R of 4.47
Went short with an entry of $99.06 after seeing a break of $99.20, Stop loss at $101.57

GBPUSD - LONGMonthly price action seems to have found support and printing large lower wicks
Weekly Double Bottom
Weekly MACD Divergence
Daily Price broke above a key Resistance level and also above a dynamic trend line
Price holding above all key resistance levels

Amazing Setup on NZDJPYHere I am looking for another leg up to continue the broadening ascending wedge on NZDJPY. Good luck and safe trading

Power of MACD DivergenceThis post doesn't do some trading recommendation for you. I want to introduce you the powerful trading pattern ——— MACD Divergence. In October 2014, as you could see a divergence appeared with a week scale. The divergence method could trading at a not bad price relatively. But a thing you have to notice, you have better find your way to offset position. It won't have a pair to pair divergence in the period. For example, you might using 20 to 60-day of moving average as your offset strategy.

AUDUSD In Depth Analysis Soon we will see this pair reverse and form an impulse to the downside. I have included an Elliott Wave count as long as a fib and pattern trendline to indicate an area that's best suited for a sell. Good luck and safe trading.
Short Term Short EURUSD and Long term Long EURUSDEuro may drop on Monday allowing for USD to gain some pace but in a long term basis, Euro will look to strengthen against USD
Euro may achieve the 1.08000 handle around middle of the week.


EUR/GBP Head and shoulders forming After 01/17 strong bear move, the possibility of h&s forming on EUR/GBP is now taking a solid shape. Should we break Daily 50 ema, next stop would be the neckline @ 0.83800, coinciding with Daily 200ema/Weekly 50ema.
Bearish MACD divergence is just the icing on the cake. Of course as always let's respect price action and wait for a confirmation of the direction before committing to a trade.
Cheers!

AUD/JPY Shortshort on audjpy after pivot resis bounce, ma's looks like their turning, macd is almost crossing, rsi is going down, i think´altho its going to break trough weekly resis

Possible Short SqueezePrice has bounced off of a significant resistance level (Blue Line)
I have gone long after seeing bullish divergence (Orange Lines), along with an increase in volume.
$EVH also has a high percentage of its float short at 34.20% , which has me thinking that with the recent bullish move, a large short squeeze may occur.
Price target is $18.00 for a R:R of 4.42
Went long with an entry of $16.32 after seeing a break of $16.30, Stop loss at $15.94
