PFE predictionPFE seems to be overbought soon, enter short.
Target I estimate is first $46 than $45, but the secodn target needs to be checked later again.
Moving Average Convergence / Divergence (MACD)

ARKF Daily BullishAMEX:ARKF daily looking very bullish:
Broke the top trendline
MACD crossing positive
20 and 50 EMA are tight and turning up together
Has a series of 3 rounded bottoms

The MACD explained ! All you need to know about it Hello everyone, as we all know the market action discounts everything :)
_________________________________Make sure to Like and Follow if you like the idea_________________________________
In this video, I am gonna explain what is the MACD and how to use it and how to identify buy and sell signals using this indicator.
So what is the MACD, The MACD is a trend-following momentum indicator (so a momentum indicator is a technical analysis tool that allows us to determine the strength or weakness of a stock's price movement )
There are a lot of people that use the MACD when they analyze charts because it's very simple and it's very good but I always say never just use 1 indicator to analyze a chart, always try to use at least 3 this way u can make sure that the result is more accurate and the market most likely to move as u analyzed.
let's look at the theory behind the MACD before looking at a real-life example and how to identify buy and sell signals using this indicator :
The typical settings for the MACD are 12 26 and 9.
The MACD consist of 4 parts :
1) Zero line
2) MACD line
3) Signal line
4) Histogram
We start off with our zero line and this is where the MACD line and the signal line move around and basically so if the MACD is trading above the 0 line then it's bullish and if it's under then it's bearish.
Then we have the MACD line and it comes from the 12 26 section, and it gets calculated by subtracting the 26 EMA of the price out of the 12 day EMA of the price.
And after that we have a second line that gets plotted from the 9 section so basically, it’s a moving average for the MACD line so it tries to smooth the MACD line and give us some signals and it's called the signal line.(it's called a signal line because that's where we get our buy and sell signals from)
So on top of that, we have another part in this indicator which is called the histogram. So this histogram job is to show how close these lines will crossover, so when the distance between the MACD line and the signal line is far the histogram gets bigger and bigger.
So how do we use this indicator :
1) Crossovers between the MACD line and the Signal line.
* When the MACD line crosses above the Signal line then its a buy signal (Bullish Crossover)
* When the MACD line crosses below the Signal line then its a sell signal (Bearish Crossover)
2) The Histogram .
A lot of people use histograms as a way to predict when a reversal will occur.
We know that the MACD is a momentum indicator so it can show us when sell pressure is low. And that means it might be a good time to buy. And It can tell you when your long position is about to run out of steam and when you should exit.
3) Divergences between the MACD and the Market Price .
A Divergence means that the indicator is not moving in sync with the Market Price and a Reversal could happen (Note that Reversal trading is risky so please calculate your risks before using this Strategy)
always remember that :
Bullish divergence is when the Market price is going down but the MACD is going up.
Bearish divergence is when the Market Price is going up but the MACD is going down.
I hope I’ve made the MACD easy for you to understand and please ask if you have any questions .
Hit that like if you found this helpful and check out my other video about the Moving Average, Stochastic oscillator, The Dow Jones Theory, How To Trade Breakouts and The RSI. links will be bellow

PD DailyNYSE:PD daily looks bullish after a series of higher lows and now breaking the upper trendline.
The MACD has just crossed positive and the 5 EMA is crossing above the 20 EMA.

TSLA Daily BullishNASDAQ:TSLA daily looks ready to continue the uptrend from late 2020.
1. Price broke above the top trendline
2. MACD is about to cross up
3. 5 EMA has come down tight to the 50 EMA and turned up ready to pop

CHGG WeeklyNYSE:CHGG weekly is ready to continue its uptrend. Last week gave a very bullish outside engulfing bar right as the 5 EMA crossed the 20 EMA. It is a very strategic spot and it is aligned with the MACD crossing up as well.

PTON Inverse H&SNASDAQ:PTON has formed an inverse head and shoulder pattern and looks ready to break the neckline.
I like the price action in the last few days in conjunction with the MACD which is just about to cross positive.

HAIN Impressive DayNASDAQ:HAIN tried and failed to close under the 200 EMA 4 times. Now it has broken the upper trend line and MACD has turned positive with today's outside bullish engulfing bar.
I like it for a buy but I am going to wait to see if we get a small inside day tomorrow because a rest day would make the setup even better.

WHAT IS GOING ON WITH BTC/USDT?There are some parameter we must attend them
1.Volume: as you can see there is a decrease in volume which means one side of the market (Buyers/Sellers) stoped its action and waiting for a good entry point (Doji candles are confirming that)
2.EMA (9/21/50): these EMA's are showing us a strong downward trend
3.MACD: it is under zero line which means there is no support from the Bulls
4.RSi: it is below 50 which means the uptrend is not strong, on the other hand, it is on a line and it can be a good sign for the Bulls
** Short position: for Short position, 1st we must wait till the price break the support zone(31000$ and 28800$) successfully, 2nd we need a huge volume from sellers to confirm the downward trend, 3rd we need support from sellers and whales which we can see it from tall red bars of MACD,4th EMA's mustn't cross each other, in the end, we need RSI to break down the line and go down!
** Long position: for Long position, first thing first we need to break the dynamic resistance successfully (and have a pullback maybe) with a huge volume of Buyers, 2nd we need good support from Bulls which as I said before MACD can show us this parameter, 3rd RSI must break up the resistance and 50 level, 4th EMAs must cross up each other and come below the price, 5th we have to find some candlestick pattern to confirm our uptrend and give us an entry point
Last word: follow news, onchain-data, and whales action

ALICE/USDT has a massive bullish potential!Hi every one
ALICE/USDT
ALICE/USDT is ranging in a broadening wedge it seems and now the price has reached the bottom of this pattern (which is also a strong support for ALICE!) so now it is expected that the price would Increase from this point because of this reasons:
1- the price has reached it's bottom (strong support)
2-on MACD indicator there is a visible bullish sign! the MACD line is about to cross the Signal line upwardly! this is of course a Good bullish sign!
3-there is a Regular Bullish Divergence on RSI indicator as well which is another Great bullish sign as well!
for this particular reasons ALICE has a strong chance of starting a Great bullish run so be prepared for it!
*Traders, if you liked this idea or have your opinion on it, write in the comments, We will be glad.
Thank you for seeing idea .
Have a nice day and Good luck

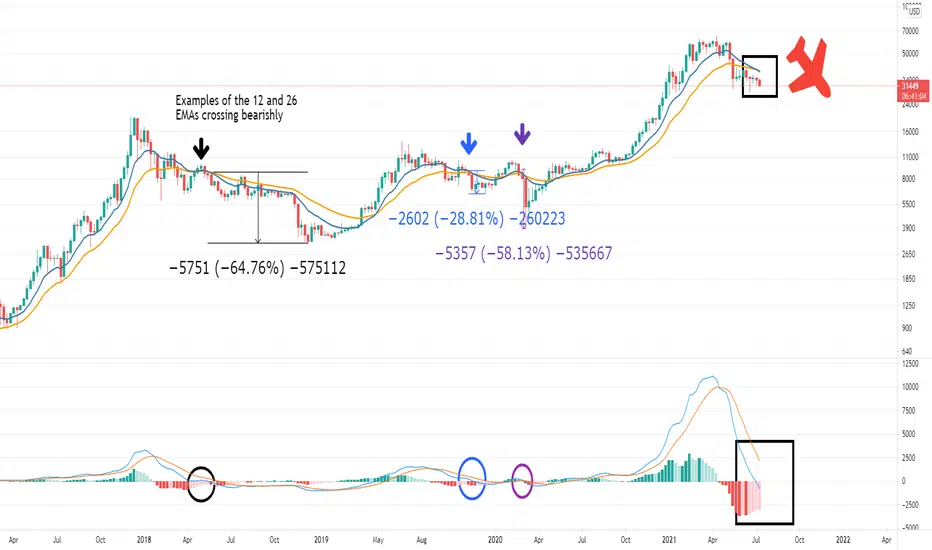
Visualizing the MACD EMAs on Bitcoin for tradesThe MACD is one of the most robust indicators that you can use due to the variety of signals you can use with hidden and traditional divergence on both the MACD itseft, as well as the histogram. Many people may tinker with the settings of the fast and slow EMA and they may look for crosses of the MACD and its own moving average, the signal line. Lots of attention is taken with looking at the MACD crossing the signal line for a change of trend but it seems fewer than would make sense look at the EMAs themselves, no matter which settings you use.
And even when people see the MACD cross the signal they don't pay it enough attention. We had a massive uptrend in 2017 and again this year and it ends with a MACD-Signal Cross. I posted on the MACD-Signal signal cross and lots of people pushed back. Lots of people doing TA on Trading View or YouTube commented on it, but still thought we would continue upward at $60K and did not have a proper appreciation for the cross given bitcoins history.
People saw a massive descending triangle in 2018 underneath a MACD-Signal cross and refused to accept it. The 12 and 26 EMAs crossed bearish, so the MACD and Signal line both went below zero, and people were still bullish. And really the charting come first. We get a chart pattern and then we should look to volume to confirm, and then we look for indicators to confirm.
Lets do a rundown on our current situation:
MACD-Signal Cross
Development of a bearish head and shoulders
The MACD EMAs, the 12 and the 26, are crossed bearish
What is missing is the Signal line crossing the zero along with the MACD, and I see that happening soon, very high probability, like over 90%.
Just take a look at this chart below. The 12-26 cross bearishly at the peak in 2011, 2014, and again in 2018. There was no bearish 12-26 EMA cross in 2013. Very simple TA has taken that off the table. But many people are still on that hopium. The 12-26 crossed in 2014 and there was some chop and a bear market. In 2017 it chopped to form a W pattern with the C19 dump but when we BTC cleared the bridge of the W we ran.
What do we do? We see a bearish structure and the easiest thing to do is look for historic support, be it chart structure or moving averages or do targeting based on the chart structure (fibs). Here is a quick look at targeting. Most likely the 200 will be support. If we have a NASDAQ dotcom bubble pop or a 2008 type recession we could go lower. The linked ideas have a variety of long term (years) and intermediate (months) for if we go into a bear market or the dotcom type bust.
Once again the charting isn't hard. It isn't hard to see the MACD-Signal cross and it isn't hard to see the 12-26 EMA cross bearish. It isn't hard to see the descending triangle and head and shoulders in 2017 and right now. But what is hard is accepting the facts in the charts against your hopes and bias.
The chances that this resolves to the downside are extraordinarily high. The chances that this formation breaks to the upside is very low. We could have a conversation on if this will lead to a V-shaped recovery or a prolonged downtrend. Will we get over-performance or under-performance to the downside? All these conversations will very likely end up happing more in the future than conversations trying to target $100k or $300k or any other upside target before we talk to the downside.
Thoughts?
Bitcoin In timeframe 2H by Macdthis strategy can run on bitcoin in timeframe of 2H.
By Macd You Can Long or Short Trading in Bitcoin

EUR/USD 1DWe can see a falling wedge pattern on the chart that could lead to a bullish movement if a breakout happens. We can also see a bullish divergence on the RSI that is pretty common but still good to take under consideration. I think there is a big chance of a bullish movement on the EUR/USD , could be at the top of the falling wedge.
Make you bets !

USD/CAD: bearish movement is coming.Hello every one
U.S. Dollar / Canadian Dollar
USD/CAD has formed a rising wedge pattern .this means it is time for bears to take control .after the break out happens the price can fall to the support levels shown in the picture. There are also regular bearish divergences on both MACD and RSI indicators which makes the bear market more reliable. after the break out we can take sell position with ease.
Traders, if you liked this idea or have your opinion on it, write in the comments, We will be glad.
Thank you for seeing idea .
Have a nice day and Good luck.


IFF Out Of SteamNYSE:IFF looks like it has run out of steam. It used up a lot of energy just to make the recent new (barely) high and now it has broken the trendline and looks ready for a short.
MACD is negative and is accelerating.

YUM Trendline BreakNYSE:YUM looks bullish as it broke the trendline and was able to hold above it today. I expect it to at least retest the previous highs at $122.

BNBUSD sitting on the EMAWe are sitting on the 200 EMA, strong support. I think the entry is now pretty attractiv.
Correction wave seems to be completed and the sideways trend is accumulating for the trend up I guess.
The MACD shows us still a big oversold over the bigger time frame.
Long term target $480

COTIUSDT Scalp tradeHello traders!
This is a Cotiusdt Buy trade. Take profit is at 5% gain and stop loss is -3%.
Collect some profit when trade is in 3% profit.
Never trade above 7x leverage
Don't forget to hit the like button and follow to stay connected.

Bitcoin Bear Market Confirmed on the MonthlyPreamble
There is quite a debate as to what constitutes a bear market generally and what constitutes a bear market in crypto specifically. Having pondered this question at length for myself and experiencing the pain of indecision this is what I have developed. This determination is very important because in bull markets bullish formations overperform and even bearish formations can break upward. In bear markets bullish formations fail to trigger and bearish formations over-perform. In the linked ideas you will see that I rang a warning bell when the three day condition was met at 50k and I called the bear market at 43k and look at us now, struggling to stay above 33.5k. I have been at sundry times mocked for my call, in person and online. Meh. We see the system is now printing a bearish close on the monthly timeframe and that is going to be extraordinarily difficult to overcome.
The System
The key components to this system are the VSTOP and the MTF VSTOP, which are based off the Average True range, a most valuable indicator for its use at finding lows in markets, and its use in measuring volatility for stops and the Keltner Channel. When both are flipped bearish or bullish the uptrend is extraordinarily resilient and despite viscous retracements there can be a lot more continuation potential. As they have both flipped bearish I continue to foresee a lot of bearish continuation. The monthly 20 SMA will very likely (above 90%) fall as support. Price may chop around there on the weekly chart for weeks but ultimately downside targets are going to be reached. The monthly MACD cross is almost upon us and in short order I foresee that happening as well. On lower time frames I can add the Ichimoku cloud or On Balance Volume with EMAs, but due to the high time frame those are unworkable now.
Targets
I continue to think that BTC will see some wicking below the monthly Keltner channel. We may even close a candle body below it before chopping sideways and then up. Please review the linked idea for more details on that.
Final Thoughts
If you are still bullish please let me know, technically, why. MY system lets me change my biases and my behavior as soon as the 3 day or weekly conditions are met. This monthly post is to help people understand the scope of that we are dealing with, and the forces that are at play. It is not possible for me to chart the 20 month wrong, or the VSTOP wrong. There is no squinting and seeing a falling wedge that isn't there or misreading divergences. The bias is bearish.

$HAI with fib and oscilators buy setupThis prediction lies upon MACD convergence point coming, based on a wave pattern of MACD. EWO also supports this, reaching it's peak in a downward trend, with fib you could expect a solid 30% growth in price in a medium-long time period. This downtrend for HAI is expected to change now. To use it with risks included I've made this buy setup:
buy price: 0.1000-0.1010
tp: 0.1315
sl: 0.900

AJ Trady 5 min ema and macd strategy.A new strategy that I have developed. Only enter when EMA crosses one of the longer term EMA's + a bullish cross is forming on the MACD. Ideally, you should wait for ema 8 to cross both ema 21 and 34 with a bullish cross formed/forming on MACD. Use alongside normal Support and Resistance for SL and TP levels. If used on crypto I mainly suggest just BTC as alt setups easily ruined by BTC doing what it wants.
