ETH USDT Support Line RetestDaily Chart
Retest at previous support 881 along the centre line Parallell Channel.
Macdcrossover

Using MACD To Identify Long Term TrendsHow can we tell whether a downturn is just a normal part of a solid bull market, or the beginning of a major downdraft? We need to have a way to identify when long-term trends are changing.
One way to guard against being caught on the opposite side of a trend is to apply technical indicators that can isolate major trend shifts and reduce psychological biases. Specifically, technical indicators based on moving averages reduce the noise that characterizes the stock market.
We can argue about the fundamental valuation of a company, but we cannot argue whether a stock’s price is above or below historical moving averages. In analysis based on moving averages, the focus is less on why the market should move up or down, and more on what the current market dynamics are from a supply-and-demand perspective.
Today there are more opportunities than ever for a decoupling of price from fundamentals. This is fueled in part by retail investors, who have access to information and tools that previously were available only to institutional investors, and social media in which market players can talk up stocks.
This is where MACD, or “moving average convergence-divergence” indicator, comes in. It was developed in the 1970s and is widely accepted by technical analysts as one of the best ways to identify prevailing trends. It is available on just about every charting platform, most of which allow for revision of the indicator’s standard parameters.
The standard MACD consists of a spread between the 12-period and 26-period exponential moving averages of a stock’s closing prices, which is then smoothed by a signal-generating line derived from the 9-period exponential moving average of the spread.
A long-term trend-following overlay is afforded by the MACD applied to the monthly bar chart of the S&P 500 Index (SPX). It provides a visual gauge of the primary trend, and it identifies major turning points when the two lines that comprise the MACD cross over. The crossovers provide “buy” signals and “sell” signals that may more clearly indicate when the long-term trend has shifted.
To illustrate this, the chart goes back 1999. The price bars are colored green to reflect positive or improving MACD readings, and red to reflect negative or deteriorating MACD readings. Bullish and bearish crossovers are denoted by up and down arrows. Generally, it has been good to be long equities when the bars are colored green, which has typically been associated with uptrends. It tends to be a more difficult environment for investors when the bars are colored red, which is typically associated with a sideways or lower trend.
It was 2008 that technical analysis really became noticed on Wall Street. The SPX had seen its monthly MACD flash a “sell” signal in November 2007, a month before it broke down, and it did not flash a “buy” signal until a few months after the March 2009 low. The bearish reversal caught many off guard, but those who used the MACD were quicker to minimize exposure, bringing attention to the field of technical analysis as a viable discipline for risk management.
MACD “buy” and “sell” signals do not capture pivots until after-the-fact, but the signals are not too late to take advantage of long-term turnarounds. Sometimes they even precede bear markets, as in 2000 and 2007. Note that the MACD flashed a “sell” signal in January 2000, before the tech bubble burst, and did not flip to a “buy” signal until May 2003, before a sustained bull market move began.
Whipsaws are not uncommon, but they are short-lived, and often associated with shifting trends like in 1999 and 2015, so even false signals can have value. The bulk of uptrends and downtrends were captured by the MACD despite its inherent lag. The MACD is not a trading system, so a “sell” signal need not be interpreted as a reason to move to 100% cash in a portfolio, but rather an indication to position more defensively.
Traders often refine long-term MACDs with shorter-term MACDs, evaluating them alongside other momentum and overbought/oversold indicators for a holistic view. Since technical analysis is based on concrete data, there is broad agreement on the merits of MACD, although different preferences and parameters can be applied.
So, what does MACD tell us about the current environment? As it stands, the SPX is currently in a bear market cycle and has been since the MACD flashed a “sell” signal at the end of March 2022. Since the “sell” signal, the SPX is down roughly 16% and continues to trend lower. In a down-trending environment, breakouts are more likely to fail, and breakdowns more likely to see downside follow-through. Overbought readings instill fear, whereas oversold readings instill healthy skepticism.
Psychological biases, notably fear and greed, are what makes a market a market, and they can be managed with unbiased input from the MACD. Clear-eyed analysis of the underlying momentum of the market can help us stay on the right side of the prevailing long-term trend.
Adapted from “The New Market Momentum: Reading the Technical Indicators” by Katie Stockton, published on Future.com (June 15, 2021).
Katie Stockton, CMT
Founder and Managing Partner
Fairlead Strategies
Shared content and posted charts are intended to be used for informational and educational purposes only. The CMT Association does not offer, and this information shall not be understood or construed as, financial advice or investment recommendations. The information provided is not a substitute for advice from an investment professional. The CMT Association does not accept liability for any financial loss or damage our audience may incur.

RATCH| Elliott Wave Projection | Inverted H&S Reversal Pattern Price action and chart pattern trading setup
> Elliott Wave projection - downtrend final correction position with an expanding diagonal pattern.
> Inverted head & shoulders reversal pattern in TFD with bullish engulfing candlestick
> Indicator: RSI strong bullish signal cross above MA and MACD golden cross signal line
> Entry @ Neckline breakout
> Stoploss @ right shoulder position
> Target @ previous wave 4 and 2
> RRR: 2:1 with -5% downside risk

AMD Bullish MACD crossover targets 110$ and maybe moreMACD bullish crossover due to very good earnings beginning of may.
Bull flag could breakout on this 4th touch of the blue upper trendline.
Keep an eye on it, AMD could rally toward 160$ before next earnings.
No financial advices, just for fun!

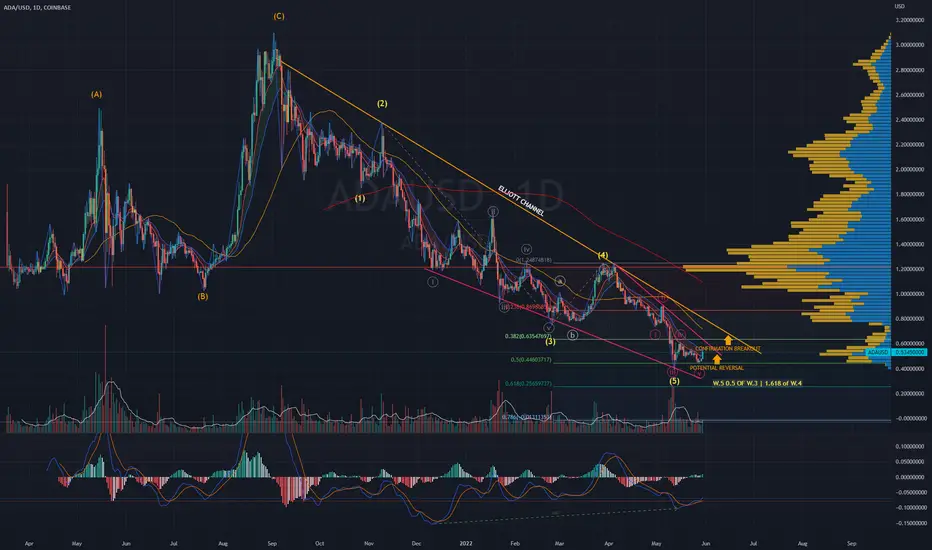
ADAUSD | Wave Analysis | Ending Diagonal - Downtrend Target ZonePrice action and chart pattern trading setup
> Elliott Wave Analysis Mapping with ending diagonal positioning target downtrend reversal pattern
> The current potential final wave 5 within the target zone extended 0.5 of wave 3 and retraced exactly 1.618 of wave 4.
> Long 1st Entry @ Ending Diagonal downtrend line breakout and 2nd entry @ Elliott Channel Breakout for reversal confirmation
> 1st Target uptrend @ Wave 4 and 2nd target @ Wave 2 position
> Stoploss at the lowest candle of wave 5 minor with -20% downside risk.
> RRR: 1:3 for medium term trade
Indicator:
> MACD - some bullish divergence crossover signal line below center
Always trade with affordable risk and respect your stoploss

Bullish Idea on the EUR/CHF making a new higher high since 3/21.EUR/CHF has made a new higher high since 3/21/22 and breaking out the resistance zone above the 200 EMA and MACD confirmation.
Possible bullish idea.

Soon to go LONG on BTC daily chartThis chart shows how you can trade the waves using the T3CCI, combination of macD and Stochs RSI crossings and the BTC Log Growth Curves. When you trade the daily chart you don't have to trade on a daily basis. It tells you when to go long and when to short. Simple as that!

Bull Flag Visible on Weekly Timeframe with MACD Bullish CrossThis is a company that has quite a good P/E and has Bounced from the bottom of a Parallel Channel after printing Bullish Divergence on the MACD. As of today the weekly has closed near the breakout point of the Channel and has confirmed a Bullish MACD Crossover above all the major Moving Averages.
Due to all this i expect that upon breaking above the channel we will have a Blue Sky Breakout that could take us to $28-$30

Monthly Bearish Crossing Double TopWe may see a 50% pullback on this as we have broken a Neckline and have Bearishly Crossed on the Monthly MACD and our next nearest support is about 50% below us.

BTC 29k - 30k Support Now is 36k - 37k!That 36k -37k Range proves to be as strong as 29k - 30k and maybe it's this support that has gone up.
For the medium term we had a very strong breakout of the 39600 - 40k resistance where a good entry now would be after the bullish pivot forms with a retest in this region.
- A conservative entry would be on the breakout of the previous candlestick's high on the retest.
- Resistance at 42900 and fibo targets on the chart.
- Heikin Ashi showed buying strength in several h4 candles from March 6th to today. We also had the escalation of bullish divergences smaller tfs up to h3 on the RSI with the confirmation made by MACD crossover.
As I like to emphasize, monthly we are in a bull channel.
Portugues...
Esse Range de 36k -37k se mostra tão forte quanto 29k - 30k e talvez seja esse suporte que tenha subido.
Para médio prazo tivemos um rompimento com muita força da resistência de 39600 - 40k onde uma boa entrada agora seria após o pivô de alta se formar com um reteste nessa região.
- Uma entrada conservadora seria no rompimento da máxima do candle anterior no reteste.
- Resistencia em 42900 e alvos de fibo no gráfico.
- Heikin Ashi mostrou a força compradora em vários candles de h4 des do dia 6 de março até hoje. Tivemos tb a escalada de divergências bullish tfs menores até h3 no RSI com a confirmação feita por MACD crossover.
Como gosto de frisar, mensal estamos num canal de alta.

BTC,Inverted Head and Shoulders Pattern?My strategy always boils down to 2 entries for 1 stop loss which is in my opinion the most important.
Long:
1- Entry 0,618 Fib Retracement
2 - cloud support
STOP LOSS: 0.8% BELOW 0.786 FIB Retracement
Target:
1 - 0,5 Fib Retracement
2- 0,236 Fib Extension (from 0.5 fib Retracement, increase stop to 0.618 fib Retracement and go up with each achievement of resistance)
Short:
1- Entry 0,382 Fib Retracement
2- 0,236 Fib Retracement
STOP LOSS 0.8% ABOVE 0,236 Fib Extension

BTC, My targets for the weekMy strategy always boils down to 2 entries for 1 stop loss which is in my opinion the most important.
Long:
1- Entry 0,618 Fib Retracement
2 - cloud support
STOP LOSS: 0.8% BELOW 0.786 FIB Retracement
Target:
1 - 0,5 Fib Retracement
2- 0,236 Fib Extension (from 0.5 fib Retracement, increase stop to 0.618 fib Retracement and go up with each achievement of resistance)
Short:
1- Entry 0,382 Fib Retracement
2- 0,236 Fib Retracement
STOP LOSS 0.8% ABOVE 0,236 Fib Extension

BTC, Broke 42200 with volume, let's go easy to 46kFirst: Follow me on Youtube: Murillo Batera Trader.
Hey Guys Humbly my thoughts and my TARGETS of entry EXIT and Stop loss...yes stop loss and depending on the agent it goes up to gain, the stop is your friend.
Turning points for Bitcoin it's good to be smart both not to stay out of the rocket to the moon and not to stay inside it when falling off the precipice.
in the act of writing...
** Sentiment indicators
still with bullish signals.
- Market at Fear 33
- LSR 0.8
- Open interest 81k
- We Desculated From The S&P500 , It's The Second Consecutive Day We've Rise While The S&P500 Falls
- the negative point goes to the dominance that is falling.
** Technical Analysis .
- we are trending up again on virtually all timeframes
- just the daily, however this is an important TF and we are unlikely to hit 47300 in my opinion.
- If it passes, it's not the moon, it's Mars, Venus, Jupiter etc.
** My long and target suggestions are on the chart.
- Stop loss 37800

KNC can rise 11.66%Bullish MacD crossover
RSI Not Overbought
Channel up on 1 hour chart
Strong MA uptrend
3 Month Price Is At A Low!

next dump for bitcoin?Hi. I think we might see some correction for BTC in the coming days.
I guess BTC will test the previous support at 32k-34k which is the bottom of downward channel.
Do you agree with me?

BTC my targets for todayTf- H1 - Using Fibo Retracement and VPFR
enter sold
... 0.5 First entry
... 0.382 Second entry
Stop loss at 42900
sale target
... 0.786 First target. VPFR VA Support
... 1 Second target. last bottom resents
So that's it, it's all right to go wrong and from now on it's just backwards!
------------------------------------------------------------------------------------------------------------
Tf- H1 - Usando Retração de Fibo e VPFR
Entrar vendido
... 0,5 Primeira entrada
... 0,382 Segunda entrada
Stop loss em 42900
Alvo da venda
... 0,786 Primeiro alvo. Suporte VA do VPFR
... 1 Segundo alvo. Ultimo fundo ressente
Então é isso, está tudo certo pra dar errado e daqui pra frente é só pra traz !

BTC Short Targets- Do you know who creates the resistances? It's the trapped people!
A lot of people stuck between 45 and 47k --- 53 and 55k
Now the Plan is:
- open interest in 5 or less.
- LSR at 2 or less.... is still high, that is, btc futures contracts
unfortunately you need to liquidate more to decrease and btc to rise.

BTC Melted, what to do!?- Main reasons for the fall.
***LSR long short ratio is above 2 ... will keep falling.
***SPX 500 falling
***FOMC being tough on containing inflation
***FED leaking information that will make at least 4 interest rate increases
this year
***Accumulation Wyckoff (last hope to move up from there).. I'll go into 41500
Stop 0.8% below 39600 (last hope of upside bottoms on weekly) Macd crossover is up ZERO on monthly.
If it is not Wyckoff accumulation (Spring test) I will start accumulating for the long term, entry into the support of the
ichimoku cloud at 35500k and tb VWMA 20 from Monthly.
Another entry would be on monthly Poc support.
(last support from bull) 29500
VWMA 20 volume weighted mobile media 20 month period. Powerful!
POC - Fixed Volume Range Profile
Btc dominance just dropping and ETH already catches more than half.
Suggestion:
In Bear MRKT, don't get more than 20% long.
In a side market (which we are in), don't get more than 30% long.
In Bull MRKT, don't get LESS than 40% bought.

Indian Bank (NSE) SHORT POSITIONOn the 4-hour chart, we can expect a bearish confirmation of the MACD crossover indicator, because as we can see, the MACD line and the signal line are already getting close to each other. The stock price is also moving to the middle level of the Keltner channel. The Williams Fractals indicator shows a bearish confirmation either. In view of these findings, we expect the price will reach a middle level and consequently, a re-test should be performed.
Position: SHORT
Entry level: $ 1.85
Target price: $ 1.70
NO FINANCIAL ADVICE

Falling Wedge Breakout With Hidden Bullish DivergenceWe have a weekly bullish engulfing, a breakout, hidden bullish divergence, and a MACD bullish Crossing.

A major WEEKLY sign for the bulls on BTCUSDIts so early in the week, so cannot count it as a thing yet... but had to share, got me excited!
WE can see the first MACD green weekly candle foirming on BTCUSD pair.
that would be so nice to see the week close like this in 6 days!
Of course there are many other indicators showing such strength too... feels like the bull run is on again!

The MACD explained ! All you need to know about it Hello everyone, as we all know the market action discounts everything :)
_________________________________Make sure to Like and Follow if you like the idea_________________________________
In this video, I am gonna explain what is the MACD and how to use it and how to identify buy and sell signals using this indicator.
So what is the MACD, The MACD is a trend-following momentum indicator (so a momentum indicator is a technical analysis tool that allows us to determine the strength or weakness of a stock's price movement )
There are a lot of people that use the MACD when they analyze charts because it's very simple and it's very good but I always say never just use 1 indicator to analyze a chart, always try to use at least 3 this way u can make sure that the result is more accurate and the market most likely to move as u analyzed.
let's look at the theory behind the MACD before looking at a real-life example and how to identify buy and sell signals using this indicator :
The typical settings for the MACD are 12 26 and 9.
The MACD consist of 4 parts :
1) Zero line
2) MACD line
3) Signal line
4) Histogram
We start off with our zero line and this is where the MACD line and the signal line move around and basically so if the MACD is trading above the 0 line then it's bullish and if it's under then it's bearish.
Then we have the MACD line and it comes from the 12 26 section, and it gets calculated by subtracting the 26 EMA of the price out of the 12 day EMA of the price.
And after that we have a second line that gets plotted from the 9 section so basically, it’s a moving average for the MACD line so it tries to smooth the MACD line and give us some signals and it's called the signal line.(it's called a signal line because that's where we get our buy and sell signals from)
So on top of that, we have another part in this indicator which is called the histogram. So this histogram job is to show how close these lines will crossover, so when the distance between the MACD line and the signal line is far the histogram gets bigger and bigger.
So how do we use this indicator :
1) Crossovers between the MACD line and the Signal line.
* When the MACD line crosses above the Signal line then its a buy signal (Bullish Crossover)
* When the MACD line crosses below the Signal line then its a sell signal (Bearish Crossover)
2) The Histogram .
A lot of people use histograms as a way to predict when a reversal will occur.
We know that the MACD is a momentum indicator so it can show us when sell pressure is low. And that means it might be a good time to buy. And It can tell you when your long position is about to run out of steam and when you should exit.
3) Divergences between the MACD and the Market Price .
A Divergence means that the indicator is not moving in sync with the Market Price and a Reversal could happen (Note that Reversal trading is risky so please calculate your risks before using this Strategy)
always remember that :
Bullish divergence is when the Market price is going down but the MACD is going up.
Bearish divergence is when the Market Price is going up but the MACD is going down.
I hope I’ve made the MACD easy for you to understand and please ask if you have any questions .
Hit that like if you found this helpful and check out my other video about the Moving Average, Stochastic oscillator, The Dow Jones Theory, How To Trade Breakouts and The RSI. links will be bellow
