Eur/USDHello traders,
First of all I want to tell you that this trading idea is for those traders that have patience !
I expect to have this trade finised until NY Exchange hours are over.
Using fibs and MACD on daily TF, you can observe that EUR / USD should hit 1.9xx soon.
I prefer to have a decent 1/2 R/R and lower the risk.
Have a nice day !
Macdcrossover

Godrej Properties Long Time Break OutMACD positive Cross over
RSI over 60
Trendline Break out with High Volume Candle
Golden Cross Over
Stop Loss - 1400
Target -1 = 1530
Target -2 = 1570
Target -3= 1737

Buy ABFRLA Symmetric Triangle formation has occurred on the weekly charts.
Above average high volume on breakout.
Also price has been in an expanding formation since 11th May 2020.
Price objective as per Triangle formation comes to 382.9
Other near term price targets are shown by green horizontal lines
Rising ADX line + Bullish MACD crossover on weekly charts further confirm the bullish trend
Stop Loss can be kept at 184.3
Risk/Reward Ratio is 4.35

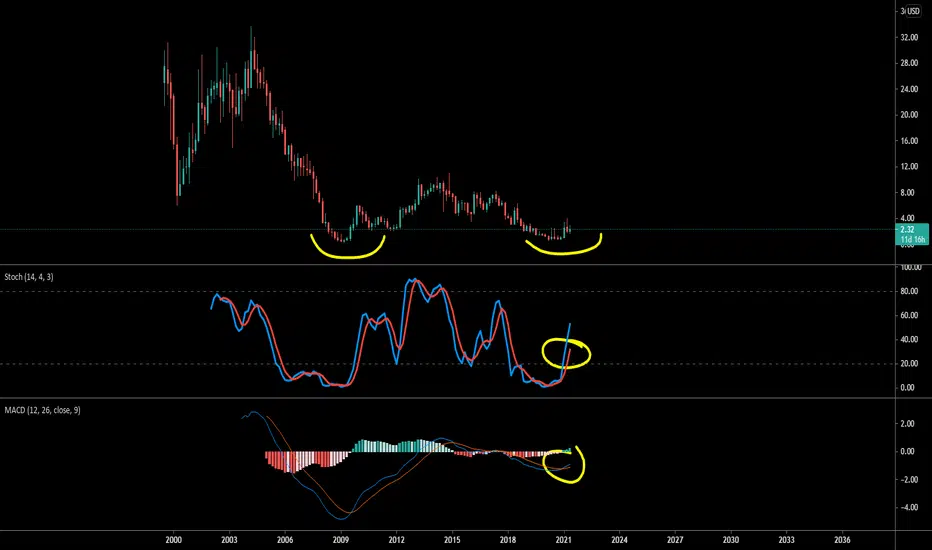
Potential double bottom on SalmThis is a gem. Under the radar, super undervalued. Nothing wrong with allocated 2-3% of your portfolio for long term. I could see this hitting 20-30 in the next 2 years. All the technical and fundamentals are screaming BUY. Wish me luck!
Using the Moving Average Convergence Divergence (MACD)MACD – What it is
The Moving Average Convergence Divergence (MACD) is the momentum indicator that shows the relationship between two different moving averages:
1. The 12 period exponential moving average – On Tradingview it is the Fast Length.
2. The 26 periods exponential moving average –On Tradingview it is the Slow Length.
The MACD line is calculated by subtracting the 26 period EMA from the 12 period EMA.
The Signal line is the 9 period exponential moving average.
These two lines are then plotted on top of each other. These are the two lines you see when you turn on the MACD indicator.
Additionally, there is a histogram that shows the distance between the two lines. Larger bars tell us that the MACD and Signal are further apart.
When it comes to candles, size matters. The larger the candle the more momentum the trend has.
The histogram will turn green when the MACD line is above 0 (bullish) and it will turn red when the MACD line is below 0 (bearish).
Very bearish momentum is shown above. Photo was taken May 23, 2021.
How to use the MACD
The most important thing to know about the MACD is how to read the relationship between the two lines.
I’ve found that the best timeframe to use the MACD with is daily. This is because the MACD is a lagging indicator and using daily data prevents a lot (not all) of false buy and sell signals.
These signals are:
• When the MACD line crosses above the signal line it is a buy signal
• When the MACD line crosses below the signal line it is a sell signal
Additionally, it is best to use the MACD in a trending market; a market with a clearly defined up or down trend.
Using the MACD with trend lines is a very powerful combination.
The reason for this is that if the market is moving sideways, you can see small fluctuations where the MACD and Signal Line cross but the price does not really go anywhere. These are false breakouts.
Therefore, these signals are not automatic buys and sells.
There are ways of confirming the indications from the MACD chart.
One way is a strategy that uses the RSI and MACD together (which is beyond the scope of this text, but I will discuss in my next article).
Another way is to use the MACD with the current trend. So, if you are in an uptrend and then you see a bullish cross, then this is confirmation that you are likely to go higher.
The same is true in reverse.
Also, please note that the cross over happens well after the price either stabilizes or rises. Again, this is because the MACD is a lagging indicator.
Leading Indicator?
Since the MACD and Signal lines are lagging indicators is there something that can be used in a predictive way?
Some traders use the histogram as a way to predict when a reversal will occur.
Since the MACD is a momentum indicator it can show us when sell pressure is alleviating. Meaning it might be a good time to buy.
This doesn’t always work of course, but with good risk management (stop losses) you can often get into a position well before its breakout.
Conversely, it can show you when your long position is running out of steam and can warn you when to get out.
MACD Divergence
Another useful way to use the MACD is to spot divergences.
A bullish divergence, very similar to the RSI, is when the short-term price trend is going down but, the MACD is going up.
Bearish divergence, also very similar to the RSI, is when the price trend is going up but, the MACD is going down.
Trading this way is sometimes not a good idea because you are trading against the trend. Please practice good risk management if you are trading reversals.
Also, notice the buy signal right before the sell signal that is circled. I really want to hammer home the point that the signals are not automatic buys and sells.
Price action is a great way to confirm the reversal (to the up or down side) of a trend. Because simply spotting a divergence does not guarantee the price will follow.
Final thoughts
As you can see there are different ways of successfully using the MACD. I hope I’ve made a few of these ways clear in this beginner guide.
Please let me know if you have any questions and if you like it, please hit the thumbs up and be sure to follow for more.
Links to my Fibonacci Retracement and RSI guides are below.
Thanks for reading!

Prince Pipes | FLAG PATTERN | Breakout with inverted hammer
Bullish engulfing
MACD crossover just started - Volume confirmation pending
Flag pattern
Flag pole length = 67 points
Lower flag cost = 487 points
Price target = 554/-
CMP= 528/-
Time target = 5 days
3rd May '21
Upper flag cloth resistance broken with Inverted hammer pattern. Watch out for tomorrow's move.
NSE:PRINCEPIPE

3hr MACD Crossover!After 5 days and 9 hours below the signal line, the 3hr MACD finally crosses above it. The last time this happened at this interval, 3/26/21 at 2.00am, BTC price went up 8k, peaking 5 days later. Things are looking up from my perspective!

#INFY set for all time high with Double Bottom Breakout#INFY is set for all time high with Double Bottom Breakout and Bullish Signal on MACD on the daily chart. On fundamental side, the IT major has just won a $500 million all-digital deal from Google.

Bullish engulfing candleVroom is a e-commerce platform for buying, selling and trading-in used cars online. Earnings date on earnings whisper says Feb 17th , while tradingview says Feb 11. 1200 March $45 calls were bought Feb 5th at $6.7. The Feb put call ratio is .20 , short interest is 6.9% . Finviz.com has a $55 price target. I think we get a higher low on daily, then back up next week.

UPWK Breakout PlayUPWK gap up today with nice volume and stay above the resistance 40.61.
MM (Measure Move) for this breakout play is 55.46 price target and with stop loss is 36.77.
PnL ratio: 3.87%, about upside 36% and downside 9%.

$RYCEY Beginning of an uptrend $RYCEY Mac D Crossing bullish, Trend reversal inbound, Higher highs, RSI in uptrend. Break out ahead.

$RYCEY Beginning of an uptrend$Rycey higher highs on the daily. Mac D crossing. Volume increasing. RSI trending up. So many bullish signs for a break out

DTC: Damstra Holdings Ltd 200DMA bounceHammer on 18 Dec
- Rose Above 200 DMA
- Rose Above previous day's high
- Rose Above 10 DMA
- Up 1 ATR
- MACD Bull Cross
- RSI crossed above 30
How much does Regal have left to sell?

HATHWAY | Bullish setupHathway cable & DA Weekly is looking bullish:
MACD crossover on the weekly
weekly MAs setting up for a golden cross.

BTC Bullish PennantA volatility breakout could drive the price above the $20k ceiling of resistance.
MACD is also about to cross the signal line.

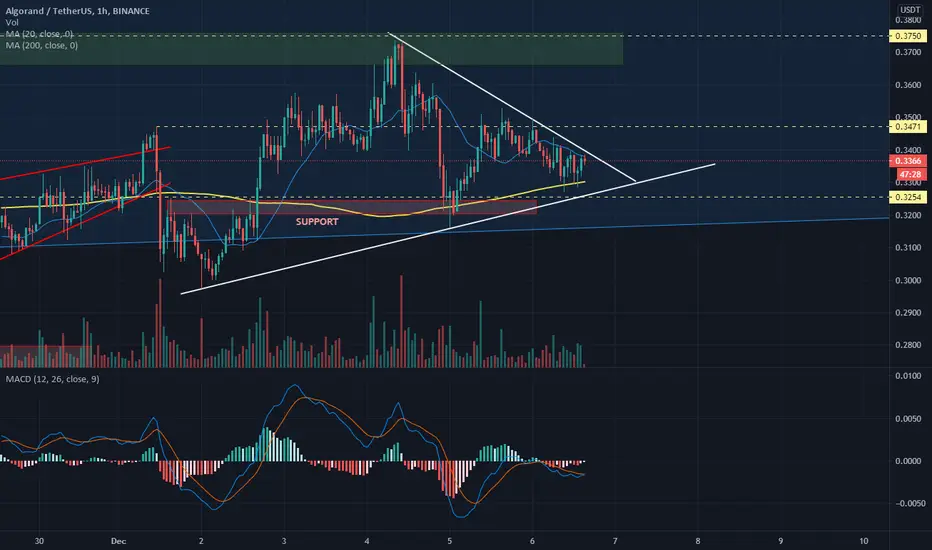
ALGO Algo can reach target 0.3662 - 0.375 after breaking the descending line of the triangle. Also MACD on 1H frame crossing to bullish.
macd buy signal, symmetrical triangle, decreasing volumehigher lows.
watching for lower rsi, but overall bullish looking for a breakout

Expecting Bullish Price Action on CRM- CRM appears ready to break upwards out of a Bollinger Band squeeze . The same bullish price action occurred when it reported Q2 earnings in late August.
- The Commodity Channel Index , a measure of the current price level relative to the 20-day average price level, has moved above +200. This indicating a strong uptrend is beginning.
- A bullish MACD crossover is also about to occur, signalling a shift in momentum to the upside.
- The RSI indicates CRM is not yet overbought (RSI<70).
- Furthermore, the stock is trading above its 20, 50, and 200 moving averages .

M&MFINStock have indicated buying signal@443. MACD crossover signal and RSI have been breakout. now in coming days we will seen at@175-180 levels

AUDCAD Trade setup short termHello everyone, I am going to keep this short and sweet because my last posts have kept getting banned. I apologize for my absence, but I am hopefully going to be posting more often now.
Elliott wave analysis: It looks like we have just started our wave 5 of a greater decline, maybe some sort of wave C? I am not sure, I have not look at the larger structure too much. But for now, let's work with the trade opportunity available to us. The reason why I think that we have started the wave 5, is because we have just finished an a.b.c wave 4, that ends around the end of the wave b in the wave 3, which is a really strong support in harmonic elliott wave theory, that shows this is infact a wave 4. The target is the 2.618 of the wave 1 and the 0.618 of the wave 1-3-4, which is around the same place.
Depending on your risk tolerance, the stop loss can be the prior swing high/ end of wave 4, or the most recent high. I am stopping at the most recent high, because I am not planning on risking too much on this trade.
Moving average analysis: The 200 ema rejection on the 15 minute is giving me HUGE bearish vibes. Not only does it reinforce the fact that wave 4 has ended, it also tells us that there is a lot of bearish momentum still. In addition to this, on the one hour, we have seen that the 55ema has crossed over the 200ema which is an incredibly bearish sign.
RSI analysis: On smaller timeframes such as the 15, 30 and 40 minute, we can see that we have rebounded off of a strong rsi support and are headed back downwards. I have drawn on the rsi, what I think the move will look like. I suspect that we will see a rebound from the oversold zone, that will indicate the end of the wave 5 with strong bullish divergence. On smaller timeframes such as the 2 hour and the one hour, we can see that we have seem lower highs and are trending back downwards again.
Macd analysis: The macd worries me quite a bit. On the 1 hour, we can see that we have a cross on the negative side, which is not something we want to see when we are headed lower, but on a smaller time frame, for example the 30 minute, we can see that the Macd has rebounded off of the zero line and we see bearishly diverging rsi. This hints to me that we will be seeing lower price action and perhaps a cross on the macd of a higher timeframe.
All in all, we are headed downwards.
The target is the 2.414-2.618 area, and the stop loss is either the end of wave 4, or the previous high.

BitShares 4H Hidden Bullish Divergence and MACD Bullish CrossI see Hidden Bullish RSI Divergence in 4H chart of BTSUSD, in combination with a Bullish Crossover in MACD. These are 2 bullish signals for me. I expect growth towards resistance at 0.022.

KOTAK MAHINDRA IS A BUY !My previous chart on kotak mahindra bank is a little off, so i thought i'll make a fresh one.
Bullish Signals
The daily candle formed a bullish engulfing candle.
The Stochastic RSI is oversold and is attempting a reversal.
The MACD on the Daily is converging and had a bullish crossover on the 4H.
This is currently a sideways market, Bollinger bands are useful for determining a reversal. The price action just hit the lower band and reversal with the above mentioned signals.
-Kautilya.K

LINDE IDEA Weekly shooting star + correction wave elliot - LINkey points to have in mind:
1- Weekly bearish shooting star candle
2 - H3 time frame have completed 3black crows pattern
3- H3 indicating MACD crossover
4- 5 wave of elliot competed time for correction bringing taking the price to potentially break the flag and drop for ABC elliot correction
