I love MACD but there's something fishy about 1268% Net Profit!Hey folks, posting this here for you to tinker with.
It's a simple trading strategy idea I have using the Moving Average Convergence Divergence (MACD) indicator for signals on when to enter and exit trades. Let's break down the key components of your strategy:
Inputs for MACD Calculation:
fastLength: The number of periods to use for the fast moving average in the MACD calculation. This is set to 2 periods by default.
slowLength: The number of periods for the slow moving average in the MACD calculation. This is set to 4 periods by default.
signalSmoothing: The number of periods for the signal line's smoothing. This is set to 2 periods by default.
MACD Calculation:
The ta.macd() function calculates the MACD line, signal line, and the MACD histogram (which you are not using, hence the underscore placeholder _).
The MACD line is the difference between the fast and slow moving averages.
The signal line is a smoothed version of the MACD line.
Trading Signals:
A buy signal (strategy.entry) is generated when the MACD line crosses above the signal line and the MACD line is above 0. This is interpreted as bullish momentum increasing.
A sell signal or exit signal (strategy.close) is generated when the MACD line crosses below the signal line. This is to close any open long position based on the assumption that the bullish momentum is weakening.
Plotting:
The strategy also includes commands to plot the MACD and signal lines on the chart for visual reference. The MACD line is in blue, and the signal line is in orange.
This strategy is overlayed on the price chart (overlay=true), which means you can see the buy and sell signals in conjunction with the price action.
The strategy is simple and only based on the MACD crossing signals without any other filters or risk management rules. It assumes that when the MACD line crosses above the signal line with positive momentum, it is a good time to enter a long position, and when it crosses below, it is time to exit.
Macdcrossover

Higher High Higher Lows - VARDHMAN ACRYLICS📊 Script: VARDHACRLC
📊 Sector: Textiles
📊 Industry: Textiles - Manmade
Key highlights: 💡⚡
📈 Script is trading at upper band of BB and giving breakout of it.
📈 MACD is giving crossover .
📈 Double Moving Averages giving crossover.
📈 Right now RSI is around 67.
📈 Script is making Higher High Higher Lows as shown in chart.
📈 One can go for Swing Trade.
⏱️ C.M.P 📑💰- 72
🟢 Target 🎯🏆 - 80
⚠️ Stoploss ☠️🚫 - 68
⚠️ Important: Always maintain your Risk & Reward Ratio.
✅Like and follow to never miss a new idea!✅
Disclaimer: I am not SEBI Registered Advisor. My posts are purely for training and educational purposes.
Eat🍜 Sleep😴 TradingView📈 Repeat 🔁
Happy learning with trading. Cheers!🥂

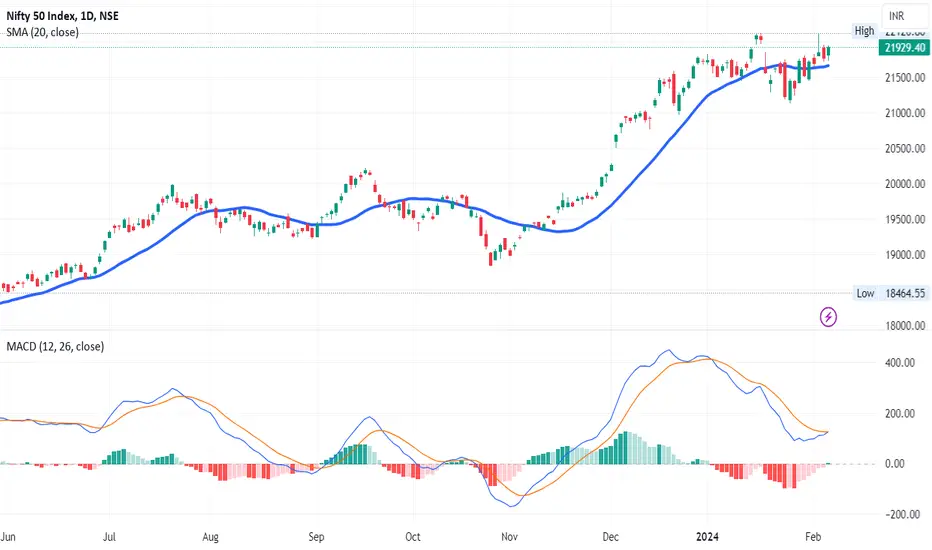
NIFTY DAILY - 6/02/2024Indian indices open with negative note and made days low that is 21737.55 but after wards bull’s takeover the market and made days high that is 21951.40.
Index has form green body candle with upper and lower shadow which indicates Buyers were buying from lower end because lower shadow is long as compare to upper shadow.
MACD has given Crossover which shows bullishness into market.
Candle is trading above on 20 days SMA line. we may see bullish run till 22124 with support of 21893 level.
Risky Double Digit - CENTRUM 📊 Script: CENTRUM
📊 Sector: Finance
📊 Industry: Finance & Investments
Key highlights: 💡⚡
📈 Script is trading at upper band of BB and giving breakout of it.
📈 MACD is giving crossover .
📈 Double Moving Averages giving crossover.
📈 Volume is increasing along with price which indicates volume breakout.
📈 Right now RSI is around 68.
📈 One can go for Positional Trade.
⏱️ C.M.P 📑💰- 37.65
🟢 Target 🎯🏆 - 45
⚠️ Stoploss ☠️🚫 - 35
⚠️ Important: Always maintain your Risk & Reward Ratio.
✅Like and follow to never miss a new idea!✅
Disclaimer: I am not SEBI Registered Advisor. My posts are purely for training and educational purposes.
Eat🍜 Sleep😴 TradingView📈 Repeat 🔁
Happy learning with trading. Cheers!🥂

Volume Breakout + Double Digit Stock - HATHWAY📊 Script: Hathway
📊 Sector: Telecomm-Service
📊 Industry: Telecommunications - Service Provider
Key highlights: 💡⚡
📈 Script is trading at upper band of BB and giving breakout of it.
📈 MACD is giving crossover .
📈 Double Moving Averages crossover soon.
📈 Volume is increasing along with price which indicates volume breakout
📈 Right now RSI is around 70..
📈 One can go for Positional Trade.
⏱️ C.M.P 📑💰- 26
🟢 Target 🎯🏆 - 36
⚠️ Stoploss ☠️🚫 - 21
⚠️ Important: Always maintain your Risk & Reward Ratio.
✅Like and follow to never miss a new idea!✅
Disclaimer: I am not SEBI Registered Advisor. My posts are purely for training and educational purposes.
Eat🍜 Sleep😴 TradingView📈 Repeat 🔁
Happy learning with trading. Cheers!🥂

XPTUSD (Platinum) Trend Reversal ahead!Platinum is a rare but highly interesting metal, well suited for many use-cases.
One use-case might be to open a short position.
For about a week, OANDA:XPTUSD has formed higher lows on the 4h chart.
On the other hand - momentum fell on Wednesday, then rose again but then took another dip.
As a result of rising prices and falling momentum, we have a bearish divergence situation.
This bearish divergence is an indication of a potential trend reversal.
There are two indicators that support the hypothesis of a trend reversal:
RSI was overbought and now keeps falling
MACD is about to cross the signal line
Of course, there's no guarantee but there are at least 3 signs (divergence, RSI oversold, MACD crossover) that usually occur when a trend is about to reverse.
The profit target is the weekly pivot at around 903.232

PLTR looking for a breakout1. Price Performance:
NYSE:PLTR has demonstrated a consistent upward trend, yielding over 10% gains since September lows.
Notably, the stock has established higher lows, indicating a potential bullish trajectory.
2. Technical Analysis:
The stock is currently approaching a key point, poised to break out of a triangular formation.
Safe traders may opt to await confirmation through a breakout, while risk-tolerant investors may consider entering early.
3. Technical Indicators:
A significant bullish signal is evident with a recent MACD crossover, aligning with positive trends observed in historical data.
By combining these factors, NYSE:PLTR presents an intriguing opportunity for investors, with both the price action and technical indicators suggesting a favorable outlook.

QQQ Simple uncovered Call Option Example Here QQQ is shown on a 15-minute NASDAQ:QQQ chart. I have set up and executed a call option on QQQ.
This is a recap.
The first thing is to plan for the entry area. To do this I set a fixed range for the
volume profile for a couple of days before the trade. Since the trade was on Friday, December
1st, the volume profile began on Wednesday the 29th of November. While the volume profile
may seem complex to look at, I only paid attention to three values- the POC line representing
the price value of the highest amount of trades ( black line) the lower value of the high volume
area ( green line) and the highest value of the high volume area ( red line). The thesis is that
if a trade is taken at the green line with other confirmatory indications such as the fast hull
moving average reversing from a downtrend and the RSI testing the oversold area, that bullish
momentum will push the price to the POC line and perhaps higher if selling pressure from bear
trades do not grow to meet that challenge. The target is the upper line of the boundary of
the volume area while the strike price is the value closest to the POC line.
In this example, the strike price was 390 and the trade was for 10 call options for $ 0.49 each
for a total trade cost of $490. Although the calls expire on Monday December 4th, the trade
was closed when stock price hit the target. The total trade duration was about 2 hours and 10
minutes. The close had an option price of $1.86 yielding $1860 from the inital $490 placed
in the trade. The net profit of $ 1370 represents about $ 450 per hour for the time expended.
The risk with a 20% stop loss is about $100 which is 1% of a $10,000 account.
This is a very simple strategy that can be rinsed and repeated. It can be done with same day
approach or a longer expiration like 5-10 days depending on a trader's appetite for reward
relative to risk, time decay and uncertainties in the market relative to time.

Costco the case for higher highs maybe probableHI guys. This is an analysis thread to assess the technical developments found in Costco. I will layout some general findings on the macro scale, then update as new developments proceed in the technicals for COST. The purpose is to provide unbiased TA opinions, where i give both bearish or bullish cases depending on facts in charts to help make informed trading/investing decisions.
Initial analysis will be on the 1 week timeframe.
First things first. The 2 Ascending triangle patterns found.
A blue one
A black one
Notice the Black triangle, this is a larger or more influential pattern developing since May 2022.
It holds more wait if signs show we a breaking out of this.
Targets would be $680-720 range.
Confirmation of a test of support Above the horizontal upper black trendline is needed.
This would indicate a continuation of COST previous uptrend, as Ascending triangles when confirmed are strong continuation patterns.
The smaller Blue Ascending triangle seems like a intermediate term consolidation area as well.
Notice how prices have consolidated Above the Black horizontal trendline of the bigger triangle, for weeks.
We have closed Last week ABOVE Blue triangle. We must await confirmation of this breakout.
This could mean we are breaking out of both Triangles.
Look also to the 21 EMA (Purple colored moving average).
We have recently bounced off of a support test. This is a great sign.
This can be a future support test area also. But i always look at it as a level of defence. It has moved up to the $550 level.
Overall, $550 level is critical support level now. Below it we go back into the larger ascending triangle, if we do go back below, this would indicate a fakeout.
An important thing to observe is VOLUME.
For this move to follow through, we must see an increase or spike in volume. Which currently doesn't seem like its there. Which could lead to a fakeout. So we must pay attention.
Remember Volume can really make or break a move especially a chart pattern.
Momentum indicators STOCH RSI and MACD are showing signs of bullishness
STOCH RSI has a BULLISH CROSS.
MACD is attempting to cross Bullish. If MACD crosses, this will give signs that uptrend is now more likely.
Taking positions must be done after COnfirmation or a decisive move Up.
Never take positions inside of a chart pattern, always consider entering after confirmation of breakout.
__________________________________________________________________________________
Thank you for taking the time to read my analysis. Hope it helped keep you informed. Please do support my ideas by boosting, following me and commenting. Thanks again.
Stay tuned for more updates on COST in the near future.
If you have any questions, do reach out. Thank you again.
DISCLAIMER: This is not financial advice, i am not a financial advisor. The thoughts expressed in the posts are my opinion and for educational purposes. Do not use my ideas for the basis of your trading strategy, make sure to work out your own strategy and when trading always spend majority of your time on risk management strategy.

Bearish Reversal Alert on EUR/USDTechnical Outlook:
LSMA Indicators: The 45 period LSMA in red and the 53 period LSMA in blue are both trending downwards towards the pivotal 50 level, reflecting a bearish sentiment taking hold.
TSI Behavior: The True Strength Indicator has just crossed and is angling downwards, with the lines beginning to diverge, enhancing the bearish signal's credibility.
MACD Crossover: The MACD line crossing at 46, following last Friday's rally, now exhibits a downward trajectory, aligning with the growing bearish momentum.
Price Action Context: There is notable price congestion around the 1.07490 area, suggesting a distribution phase that could precede a downward move if support fails.
Trade Rationale:
The synergy of these indicators, paired with a comprehensive analysis of price action, suggests a potent opportunity for a short position. The alignment of LSMA lines descending, TSI's bearish crossover, and the MACD's downward turn post-rally indicates a shift in market dynamics. The distribution around 1.07490 serves as a potential inflection point for price, where a sustained move below could confirm the bearish outlook and offer a strategic entry point for traders.
Action Plan:
Consider a sell position on EUR/USD, while closely monitoring the 1.07490 level for confirmation of the bearish momentum. As with any trade, ensure proper risk management strategies are in place to protect against unexpected market movements.

Covid & Vaccine Related Novavax Long Play in the cardsHi guys! So lately theres been some buzz on a particular variant, increased cases of hospitalizations and government backing. At risk population that require vaccinations/ boosters will always exist. Therefore, i believe this fact along with various technical analysis findings can make companies such as Biontech, Moderna and even not as famous Novavax potential plays.
(Look below for my analysis on Biontech)
Jumping right in. This is a technical analysis on Novavax (NVAX) on the 3 day timeframe.
Zoomed in we can see that we have a GOLDEN CROSS.
Between the:
21 EMA
50 SMA
Being on the 3 Day its ALOT more Powerful than having it on 1 Day and it may influence the larger timeframes. Which is what we want.
We have also maintained SUPPORT on both Moving Average. (21 EMA and 50 SMA)
This is a great sign, if we continue like how we are with our current candle during the close that would further confirm Support and a bullish case in my opinion.
This 3 day candle will close on the 8th of September. Pay attention to how big the body of candle gets on the close.
With this i would like Volume to start to pick up especially if and when we get to the "flat trendline".
Another important development to notice is the Ascending Triangle.
This can be giving us evidence we are in the process of BOTTOMING out.
Watch for the breakout ABOVE the Flatline. This with confirmation of Support on flatline would be a Major Area to take Long Positions.
I would ADVISE AGAINST buying inside the triangle. But Belowthe Ascending Support Line would be an area for Stop losses.
Watch also how the MACD acts. If we continue in Green and the Blue/Orange lines make it ABOVE 0 level. We will be off to the races, as it would be the necessary catalyst that provides momentum to have the triangle play out.
__________________________________________________________________________________
Thank you for taking the time to read my analysis. Hope it helped keep you informed. Please do support my ideas by boosting, following me and commenting. Thanks again.
Stay tuned for more updates on NVAX in the near future.
If you have any questions, do reach out. Thank you again.
DISCLAIMER: This is not financial advice, i am not a financial advisor. The thoughts expressed in the posts are my opinion and for educational purposes. Do not use my ideas for the basis of your trading strategy, make sure to work out your own strategy and when trading always spend majority of your time on risk management strategy.

Current Developments on CVS chart can make for opportunityHi guys! This is a Technical analysis on CVS Health Corporation (CVS) on the 3 day timeframe.
We discuss some Current developments on CVS, which maybe pointing to signs of potential opportunity to invest/ hold CVS.
We've had a deathcross that has brought us down more than 38%.
Which has lead us to a critical support trendline that has acted as support since March 2019.
We recently bounced from this trendline with a BULLISH ENGULFING candle print
We have from this support line bounced up to reach the 21 EMA
Current price action is attempting to establish support on 21 EMA.
MACD has crossed Bullish with Green bars printing.
BUT also remember that we have resistance above us from the 50 SMA.
We are also in an established DOWNTREND from the Deathcross. Until proven otherwise so we have to pay attention for signs of trend change.
Key area is around the 2 moving averages. We need to establish support on 21 EMA. We have to also see how we react with the 50 SMA. If we get ABOVE 50 SMA and maintain support, it is likely we print a GOLDEN CROSS, leading to BUY pressure to come in.
This could be the necessary catalyst for trend change.
Another hint in an attempt to trend change is the 21 EMA flattening out, beginning to show signs of a curvature to upside.
Now lets Look left to find evidence of previous patterns in the Moving average interactions, Support line interaction and MACD.
Our first time interacting with the SUpport line, we had many touches, before printing a GOLDEN CROSS. ALong with MACD CROSS ABOVE 0 level, we had a 48% Uptrend.
Our 2nd interaction with SUpport line, we experienced a fakeout on the 1st touch. MACD could NOT move ABOVE 0 level.
The 2nd touch of support line, had the GOLDEN CROSS and the MACD cross ABOVE 0 level. This lead to an extended Bull run for CVS with gains of 100%.
Keep this in mind. Look for similar pattern in our current price action. If we see a Golden Cross with MACD crossing ABOVE 0 level. This would mean an UPTREND is probable. But dont discount the possibility of a fakeout. We can always have another attempt to test support on support line.
Watch closely for these to develop in our current price action. Best opportunity to invest would be after Golden cross has been established with confirmed MACD cross Above 0 level in my opinion.
__________________________________________________________________________________
Thank you for taking the time to read my analysis. Hope it helped keep you informed. Please do support my ideas by boosting, following me and commenting. Thanks again.
Stay tuned for more updates on CVS in the near future.
If you have any questions, do reach out. Thank you again.
DISCLAIMER: This is not financial advice, i am not a financial advisor. The thoughts expressed in the posts are my opinion and for educational purposes. Do not use my ideas for the basis of your trading strategy, make sure to work out your own strategy and when trading always spend majority of your time on risk management strategy.

Bitcoin's Weekly Chart Analysis: Signals and Indicators 📈🔍Hey there, crypto fam! Let's dive deep into the world of Bitcoin with a look at the weekly chart. 📈
🕒 4 Weeks of EMA 200 Testing: Bitcoin's been doing this interesting dance for the past four weeks, where it keeps testing the EMA 200 (Exponential Moving Average). It's like it's checking for support, and so far, it's been bouncing off that level. 🙌
🔴 Bearish Signals Galore: Now, it's not all sunshine and rainbows. Those red dots and that ominous red cloud hanging around are telling us there's some bearish sentiment in the air. It's like the market's giving us a little wink and nudge, hinting that it might not be all smooth sailing. 😬
📏 Price Squeeze: There's this fascinating thing happening – it's like a price squeeze. Imagine a spring getting coiled up tighter and tighter. This could mean a big move is lurking around the corner. 🔄
📉 RSI Bearish Divergence: Our trusty RSI is showing a bearish divergence, but here's the catch – it's still on the positive side. It's like a tug of war between the bulls and the bears, and right now, neither side has a clear upper hand. 🤼♂️
📊 MACD Cross: The MACD, another one of our favorite indicators, has had a cross, but it's also on the positive side. It's like two friends giving each other a high-five, but they're not quite sure which way they're headed next. 🤝
So, what's the bottom line? Well, the weekly chart is painting a picture of uncertainty. Bitcoin's testing support, but the bearish signals and divergences suggest caution. Keep an eye on this coiled spring – a big move might be just around the corner. And as always, stay sharp and trade wisely! 💪💰

Bitcoin Bullish Momentum at Risk as Monthly Stochastic IndicatorBitcoin (BTC) enthusiasts might face some headwinds as a key monthly technical indicator, the stochastic, signals an "overbought downturn" according to Fairlead Strategies.
The stochastic indicator recently dipped below 80, which indicates a loss of upward momentum. This indicator typically oscillates between 0 and 100, with readings above 80 signaling overbought conditions and readings below 20 indicating oversold conditions. A downturn from overbought levels suggests a weakening of upward momentum.
Strong Resistance Causes Downturn
Katie Stockton, the founder and managing partner of Fairlead Strategies, highlighted this development, stating that "at the end of August, Bitcoin confirmed an overbought downturn in its monthly stochastics in a setback." She added that this downturn might prolong the basing process for Bitcoin, especially considering the resistance around $31.9K posed by the monthly cloud model, a level Bitcoin has struggled to breach.
Historically, overbought downturns in the stochastic indicator in early 2021 and December 2017 have marked significant price peaks.
The monthly MACD histogram, which measures trend strength and changes in trend, is near zero, indicating a neutral long-term bias. Crossings above zero suggest a bullish momentum shift, while drops below zero signal a bearish trend change. However, the MACD has yet to turn positive, implying that a sustainable uptrend has not yet taken hold, according to Stockton.
At the time of writing, Bitcoin is trading at $25,700. Stockton identified immediate support at $25,200 and noted that the 50-day simple moving average at $28,200 is a critical resistance level.

STX - broke out of CUP consolidationSTX rise that began in late Dec last year was disrupted as it went into a multi-month cup consolidation from February. Last week, it finally broke above the neckline of this CUP @ 71.50 on strong volume.
A number of technical signals are now going right for STX and it appears a trend continuation is underway:
1. its 200 day moving average is now subtly curving upwards
2. MACD on its MONTHLY chart has now begun to cross up into positive territory. This is significant and likely signals a longer term bullish outlook (whip saws not withstanding).
Any dip back towards the neckline @ 71.50 will be a lower risk opportunity to long with initial stop loss below 67.50. Trail profits up should trade goes our way.
Disclaimer:
TA is about improving our odds of a successful trade (not a guarantee). This is just my own analysis and opinion for discussion and is NOT a trade advice. Kindly do your own due diligence and trade according to your own risk tolerance and don't forget that money management is (probably the most) important! Take care and Good Luck!

📈🚀 Seize the Moment: Epic Buying Opportunity on S&P 500! 📈🚀Hey traders, get ready to ride the wave of profits with an exciting setup on the S&P 500! 🌊📊 A golden opportunity has surfaced, and it's time to capitalize on a potential bullish rally. In the 4-hour timeframe, we're witnessing the stars aligning for a buying spree that could lead us straight to the coveted 4570 target. 🎯🦅
The Double Bottom Delight:
Hold tight as the price action unveils a mesmerizing double bottom formation. This pattern is like a green light for bullish momentum, signaling a potential upward surge. 🚀 The beauty lies in the symmetry, and we're ready to ride this pattern to its fullest potential.
Harmonic Bat Pattern: Point D in Sight! 🦇🎯
Prepare for some harmonic magic! The stars of the show are aligning as we approach the mesmerizing point D of the harmonic bat pattern at 4570. Brace yourself for a journey towards this target, riding the wave of pattern completion and potential profits.
Candlestick pattern: Doji Breakout! 🕯️🚀
The magic continues with a "long-legged Doji" candlestick, signaling a breakout like no other. This is the ultimate call to action – a signal to buy this dip and ride the upward momentum. 📈🕯️
Moving Average Mastery: Crossover Confirmation! 📈✨
Get ready for a symphony of confirmation! The moving averages are about to cross over, a sign that amplifies our scenario. This crossover is like a nod from the universe, signaling that it's time to jump on board and enjoy the ride.
MACD Marvel:
Bullish Momentum Amplified! 🚀💥
The MACD indicator joins the party, forming a fresh crossover to the upside. This is the stamp of approval we've been waiting for – a clear signal that bullish momentum is skyrocketing. 📈💪
The Game Plan:
Entry: Buy around 4420
Stop Loss: Below 4407
Target: 4470 (with partial profit-taking along the way)
Remember, smart trading involves not only the entry but also the exit strategy. Keep an eye on those partial profit-taking points as we journey towards the 4470 target. 🎯💰
Feel free to share your toughts in the comments section, follow me for updates and don't forget to press the like button if you think this insight was helpful 🌊🚀

INGERSOLL RAND LTD - Multiple Indicator 📊 Script: INGERRAND (INGERSOLL RAND (INDIA) LIMITED)
📊 Nifty50 Stock: NO
📊 Sectoral Index: NIFTY INFRASTRUCTURE
📊 Sector: Industrials - Capital Goods
📊 Industry: Industrial Products - Compressors & Pumps
Key highlights: 💡⚡
I have used 4 indicators which is as follow:
1. Bollinger Bands (BB)
2. MACD
3. RSI
4. MOVING AVERAGE CROSSOVER
📈 Script is trading at upper band of Bollinger Bands (BB) and giving breakout of it.
📈 MACD is giving crossover.
📈 Double Moving Averages also giving crossover.
📈 Current RSI is around 67.
📈 One can go for Swing Trade.
⏱️ C.M.P 📑💰- 2292
🟢 Target 🎯🏆 - 2475
⚠️ Stoploss ☠️🚫 - 2194
⚠️ Important: Always maintain your Risk & Reward Ratio.
⚠️ Purely technical based pick.
✅Like and follow to never miss a new idea!✅
Disclaimer: I am not SEBI Registered Advisor. My posts are purely for training and educational purposes.
Eat🍜 Sleep😴 TradingView📈 Repeat🔁
Happy learning with trading. Cheers!🥂

Jubilant Pharmova Limited - Bullish on Chart📊 Script: JUBLPHARMA (JUBILANT PHARMOVA LIMITED)
📊 Nifty50 Stock: NO
📊 Sectoral Index: N/A
📊 Sector: Healthcare
📊 Industry: Pharmaceuticals
Key highlights: 💡⚡
📈 Script is trading at upper band of Bollinger Bands (BB) and giving breakout of it.
📈 MACD is giving crossover.
📈 Double Moving Averages also giving crossover.
📈 Volume is increasing along with price which is volume breakout.
📈 Current RSI is around 69.
📈 One can go for Swing Trade.
⏱️ C.M.P 📑💰- 370
🟢 Target 🎯🏆 - 450
⚠️ Stoploss ☠️🚫 - 329
⚠️ Important: Always maintain your Risk & Reward Ratio.
⚠️ Purely technical based pick.
✅Like and follow to never miss a new idea!✅
Disclaimer: I am not SEBI Registered Advisor. My posts are purely for training and educational purposes.
Eat🍜 Sleep😴 TradingView📈 Repeat🔁
Happy Labh Pancham 🪔🎉✨
Happy learning with trading. Cheers!🥂

XAGUSD 1d Bullish DivergenceThere are some technical signs that OANDA:XAGUSD might do a swing up
There is a bullish divergence of price vs momentum
MACD is about to cross the signal line
The downward trendline has already been crossed to the upside
So it might be a good idea to go long with a profit target at the monthly pivot (24.176)

IWM - joining the bull party soon?Bull cycles usually start with heavy weight stocks (especially those in technology and discretionary) taking the lead, with small-caps usually joining the party at a later stage and when this happens, the bull run will be a lot more obvious by then.
The IWM (tracking 2000 small-cap stocks) had been stuck in a wide-ranging wedge since hitting a low in June 2022 and with this we experienced huge volatility when we attempted to long these stocks despite that they looked to have bottomed out.
A look at the monthly chart showed that the MACD is about to switch into the positive territory for the IWM, a significant indicator that it's longer-term outlook is starting to look bright(er).
On its daily chart, the 200-day moving average has even begun to exhibit a subtle upslope. Hence, I am hopeful that the IWM will be breaking out of the wedge above 198 in the near future (perhaps within a few weeks if not days).
It is no surprise that more and more of the smaller stocks are beginning to break up, despite that some still experienced a lot of volatility that could be difficult to sit tight. However, having a clearer vision of its longer-term outlook should give some confidence to dip our toes in for stocks with the right technicals and even if we were shaken out, the confidence to retest our entry when the technicals line up again.
Disclaimer: Just my 2 cents and not a trade advice. Kindly do your own due diligence and trade according to your own risk tolerance and don't forget that money management is (probably the most) important! Take care and Good Luck!

Educational: MACD, What is it and how to use it 📊 Introduction
You might want to read more about the MACD indicator if you're seeking for a technical indicator that can assist you in spotting market trends and momentum. Moving average convergence/divergence, or MACD, is one of the most well-known and often applied technical analysis indicators. We will define the MACD indicator, describe its operation, and provide trading tips in this publication.
📊 What is the MACD?
The MACD indicator displays the relationship between two exponential moving averages (EMAs) of a security's price and is a trend-following momentum indicator. The 26-period EMA is subtracted from the 12-period EMA to calculate the MACD line. The MACD line is the output of the calculation.
The signal line, which is then drawn on top of the MACD line and can be used as a trigger for buy or sell signals, is a nine-day EMA of the MACD line. When the MACD line crosses above the signal line, traders may buy the asset; when it crosses below, they may sell—or short—the security.
The difference between the MACD line and the signal line is represented as a bar graph on the MACD indicator called the histogram. The histogram can inform traders of the strength of a directional move and forewarn them of a probable price reversal. It can also determine whether an asset is overbought or oversold.
The MACD indicator thus depends on three time parameters, namely the time constants of the three EMAs. The notation "MACD (a,b,c)" usually denotes the indicator where the MACD series is the difference of EMAs with characteristic times a and b, and the average series is an EMA of the MACD series with characteristic time c. These parameters are usually measured in days. The most commonly used values are 12, 26, and 9 days, that is, MACD (12,26,9).
📊 How does the MACD work?
The MACD indicator gauges how much two moving averages of various periods are convergent or divergent from one another. The price trend is revealed by the moving averages, a form of smoothing technique that eliminates noise and oscillations in the price data.
The majority of MACD changes are driven by the shorter (12-day) moving average due to its speed. The 26-day moving average is slower and less responsive to changes in the price of the underlying securities.
There is a strong momentum in that direction when the shorter moving average pulls away from the longer moving average (i.e., when there is a significant difference between the two). According on whether the movement is upward or downward, this indicates that there is an increase in either purchasing pressure or selling pressure.
There is a weak momentum in that direction when the shorter moving average drifts in the direction of the longer moving average (i.e., when there is a minor difference between them). This signals a lessening of buying or selling pressure, as well as a price consolidation or sideways movement.
📊 How to use the MACD
The MACD (Moving Average Convergence Divergence) indicator is designed to be used for several purposes in technical analysis. Its primary function is to identify potential trend reversals, confirm entry and exit points, and assess the strength of a trend. Here are the key applications of the MACD indicator:
🔹Trend Identification: The MACD indicator helps traders identify the direction of the underlying trend in a market. By comparing the MACD line (the difference between two moving averages) and the signal line (a smoothed moving average of the MACD line), traders can determine whether the trend is bullish or bearish. A positive MACD indicates a bullish trend, while a negative MACD suggests a bearish trend.
🔹Momentum Analysis: The MACD indicator provides insights into market momentum. When the MACD line and the signal line move farther apart, it indicates increasing momentum in the prevailing trend. Conversely, when the MACD lines converge or move closer together, it suggests a potential slowdown or loss of momentum. Traders can use this information to assess the strength of a trend and make informed decisions.
🔹Crossover Signals: The MACD indicator generates crossover signals when the MACD line crosses above or below the signal line. A bullish crossover occurs when the MACD line crosses above the signal line, indicating a potential buying opportunity. Conversely, a bearish crossover takes place when the MACD line crosses below the signal line, suggesting a potential selling opportunity. These crossover signals are commonly used to identify entry and exit points for trades.
🔹Divergence Detection: Divergences occur when the price of an asset moves in the opposite direction of the MACD indicator. Bullish divergences can be observed when the price makes lower lows while the MACD forms higher lows. Conversely, bearish divergences occur when the price achieves higher highs while the MACD forms lower highs. Divergences can be early indications of potential trend reversals and can help traders anticipate changes in market direction.
🔹Histogram Analysis: The MACD histogram represents the difference between the MACD line and the signal line, displayed as bars above or below a zero line. The histogram provides visual cues about the strength of a trend. When the histogram bars are above the zero line, it indicates bullish momentum, and when they are below the zero line, it suggests bearish momentum. Additionally, the shape and direction of the histogram bars can provide insights into potential trend reversals or market consolidations.
📊 How to access the MACD.
The MACD can be accessed for free by simply clicking on your indicators tab and seraching MACD where you will find Moving average convergence/divergence.
The MACD indicator is a useful tool, but to make well-rounded trading decisions, it should be utilized in conjunction with other technical indicators, price patterns, and fundamental analysis. To make the best use of the MACD indicator, traders need also take into account the individual market circumstances and periods they are trading in.

Copper will dropTechnical Analysis: Both Day and Week timeframes of MACD and 10/30 EMA show that Copper will drop.

🚀USDCAD double bottom: bulls ready to charge📈Brace yourself for a game-changing setup on the USDCAD forex pair! 🌟
The charts are showing a compelling buy signal in the 4-hour timeframe, with price bouncing off a solid support level at 1.31400.
But that's not all! The candlestick pattern has revealed a powerful bullish engulfing formation, signaling a potential trend reversal in the making.
Get ready to set your sights on multiple take profit levels: first target at 1.31950, representing the 0.618 Fibonacci retracement. Then, the neckline at 1.32200 beckons as our second milestone, followed by the third take profit around 1.32500, and ultimately, the grand target at 1.32800!
Adding fuel to the fire, the MACD indicator is on the verge of forming a bullish crossover, adding further confirmation to this exciting setup.
Don't miss out on this potentially explosive trade opportunity! 🚀
Respect money management
don't forget to press the like button if you think this insight was helpful🚀
