Deep Dive Into Moving Average Convergence Divergence (MACD)🗓 The Moving Average Convergence Divergence (MACD) is one of the most popular momentum indicators in technical analysis. Whether you're a beginner or an experienced trader, understanding how the MACD works can significantly enhance your trading decisions.
📚 Introduction: What Is MACD and Why It Matters
The MACD (Moving Average Convergence Divergence) is one of the most powerful and widely used momentum indicators in technical analysis. It was developed by Gerald Appel in the late 1970s and has since become a staple in the toolkit of traders and investors across markets — from stocks and forex to cryptocurrencies.
At its core, MACD helps traders understand the relationship between two moving averages of an asset’s price, providing insight into both trend direction and momentum strength. By analyzing how these averages converge and diverge, the indicator offers valuable signals for entries, exits, and trend reversals.
What makes MACD especially popular is its versatility — it works well in trending markets, can be used across all timeframes, and combines both leading and lagging components. Whether you're a day trader or a long-term investor, understanding how MACD works gives you an edge in making timely and informed trading decisions.
📚 How the MACD Is Calculated: The Components Explained
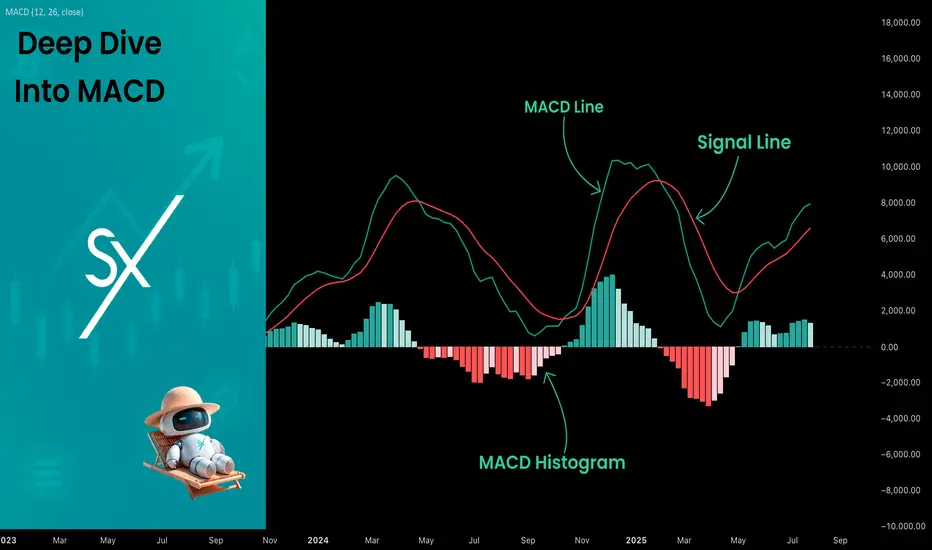
The MACD is built from three core components: MACD line, Signal line and MACD histogram.
🔹 Calculating the MACD Line:
The MACD line is the difference between two Exponential Moving Averages (EMAs), typically 12-period EMA (fast) and 26-period EMA (slow). The formula is:
MACD Line = EMA(12) − EMA(26)
This line captures momentum by tracking how the shorter-term average diverges from the longer-term average. When the MACD line rises, the short-term momentum is increasing faster than the longer-term trend — a sign of bullish acceleration. The reverse implies bearish momentum.
🔹 Calculating the Signal Line:
To reduce noise and provide clearer signals, a 9-period EMA of the MACD line is plotted on top. This is the Signal Line, and it acts as a trigger:
When the MACD line crosses above the signal line → bullish signal (buy)
When the MACD line crosses below the signal line → bearish signal (sell)
Signal Line = EMA(9)(MACD Line)
🔹 Calculating the MACD Histogram:
The Histogram shows the difference between the MACD Line and the Signal Line:
Histogram = MACD Line − Signal Line
It provides a visual representation of momentum strength. The histogram bars expand when momentum strengthens and contract as it fades. It helps you spot shifts in momentum earlier than a basic crossover.
📚 How to Use MACD in Trading Strategies
⚡️MACD Signal Line Crossover
Buy Signal:
MACD Line crosses above the Signal Line from below (bullish crossover)
Preferably when both lines are below the zero line (early in the trend)
Price closes above the long-term trend approximation, in our case we use 200-period EMA
Sell Signal:
MACD Line crosses below the Signal Line from above (bearish crossover)
Preferably when both lines are above the zero line (early in the trend)
Price closes below the long-term trend approximation, in our case we use 200-period EMA
📈Long Trading Strategy Example
1. Wait until MACD line crosses over the Signal line from down to up. In our example we use 1D time frame for BITMART:BTCUSDT.P . Open long trade if point 2 will be completed.
2. Price candle shall be closed above the 200-period EMA. This is long-term trend filter to increase the probability that trades will be open only in the direction of the main trend.
3. Close the long trade when the MACD line crosses under the Signal line. This is an approximation that short-term impulse is over and correction is about to start.
In our case we have +20% return on this long trade, but, please, notice that we have not used initial stop-loss in this strategy. Trade was closed according to the technical condition, this approach can violate the risk management rules, but also can be applicable if you trade the amount ready to lose using this strategy. We will talk about stop-loss later.
📉Short trading strategy example
1. Wait until MACD line crosses under the Signal line from up to down. In our example we use 1D time frame for BITMART:ETHUSDT . Open short trade if point 2 will be completed.
2. Price candle shall be closed below the 200-period EMA. This is long-term trend filter to increase the probability that trades will be open only in the direction of the main trend.
3. Close the short trade when the MACD line crosses over the Signal line. This is an approximation that short-term impulse is over and correction is about to start.
In this case we have +15% return on the short trade. Again, strategy used the technical condition to close the trade and now let's cover how to place the stop-loss. There is no right answer how to use stop-losses. The first and the most obvious way to place stop-loss is using recent swing low/high, but the problem is that all traders are seeing them and do the same. Price tends to reach such levels to collect liquidity.
Another one way to place stop-loss is using the signal candle's high/low. This is so-called 1 candle stop-loss. Usually it's very tight and can allow to have the fantastic risk to reward ratio, but we are now recommend to use it if you are not a professional trader because win rate of such strategy decreases.
Third approach in placing stop-loss which we often use in our algorithmic strategies is the Average True Range (ATR). ATR is the volatility measurement, it allows to take into account the current volatility. Sometimes it helps to avoid the stop-loss hit when trade finally goes in your direction. You can just simply subtract (in case of long trade) or add (in case of short trade) ATR value to the entry price and obtain the dynamic stop loss based on current market condition. Also multiplier can be used for ATR. You shall choose the approach which is more comfortable for you, backtest all these approached to make your choice.
🧪Important: we used the long signals only below the zero-line and short signals above it in the attempt to catch the beginning of a trend and have large potential move. On the picture below you can see the same BITMART:BTCUSDT.P , but what will happen if we open long on the lines crossover above zero line? This trade will not be profitable because of restricted potential.
⚡️MACD Zero Line Crossover
Buy Signal:
MACD Histogram crosses above the zero line (momentum shifts from bearish to bullish)
Price closes above the long-term trend approximation, in our case we use 200-period EMA
Sell Signal:
MACD Histogram crosses below the zero line (momentum shifts from bullish to bearish)
Price closes below the long-term trend approximation, in our case we use 200-period EMA
📈Long Trading Strategy Example
1. Wait until MACD Histogram crosses over zero line. Open long trade if point 2 will be completed.
2. Price candle shall be closed above 200-period EMA. This is long-term trend filter to increase the probability that trades will be open only in the direction of the main trend.
3. Take profit when price reaches 3:1 risk to reward ratio according to the stop-loss from point 4.
4. Stop-loss shall be placed below recent swing low. This point can be discussed, you can use any stop-loss technique described earlier in this article. We demonstrate the simplest one, the key here is using at least 3:1 RR.
📉Short trading strategy example
1. Wait until MACD Histogram crosses under zero line. Open short trade if point 2 will be completed.
2. Price candle shall be closed below 200-period EMA. This is long-term trend filter to increase the probability that trades will be open only in the direction of the main trend.
3. Take profit when price reaches 3:1 risk to reward ratio according to the stop-loss from point 4.
4. Stop-loss shall be placed above recent swing high. This point can be discussed, you can use any stop-loss technique described earlier in this article. We demonstrate the simplest one, the key here is using at least 3:1 RR.
⚡️MACD Divergence Strategy
MACD Divergence is a strategy that helps traders identify potential reversals in market direction before they become obvious on the price chart. This makes it a favorite tool among swing traders and crypto enthusiasts looking to catch major moves early.
But what exactly is a divergence? In simple terms, divergence occurs when price and momentum (MACD) are moving in opposite directions — signaling that the current trend may be losing strength and preparing for a reversal. There are two main types of divergence.
🐂 Bullish Divergence
Price makes a lower low
MACD Histogram makes a higher low
This suggests that while price is still falling, downward momentum is weakening. The bears are losing control, and a bullish reversal may be near. Trading signal is very simple, when bullish divergence happens wait for the first increasing column on MACD histogram and open long trade. Place stop-loss under recent swing low and take profit at 3:1 RR.
🐻Bearish Divergence
Price makes a higher high
MACD makes a lower high
This suggests that while price is still falling, downward momentum is weakening. The bears are losing control, and a bullish reversal may be near. Trading signal is very simple, when bearish divergence happens wait for the first decreasing column on MACD histogram and open short trade. Place stop-loss above recent swing high and take profit at 3:1 RR.
🧪 Important hint: MACD histogram shall cross the zero line between two lows/high to create the most reliable divergence signals. We are not recommend to use it without zero-line crossover to decrease number of false signals.
📈Long Trading Strategy Example
1. MACD Histogram shall create higher low.
2. Price shall create lower low.
3. MACD Histogram shall cross the zero line between lows.
4. MACD Histogram shall show the first increasing column.
5. Put stop-loss under the recent swing low.
6. Put take profit at 3:1.
🧪 You can enhance the long signal with the MACD Line divergence. In our case we have both divergences: with MACD Histogram and MACD Line.
📉Short trading strategy example
1. MACD Histogram shall create lower high.
2. Price shall create higher high.
3. MACD Histogram shall cross the zero line between lows.
4. MACD Histogram shall show the first decreasing column.
5. Put stop-loss above the recent swing high.
6. Put take profit at 3:1.
🧪Divergence is extremely strong signal, but when price continue it's move in the direction of a trend and it's not reversing it can also be the signal for the trend continuation. This situation is called "Baskerville Hound" signal, this name was given by famous trader Alexander Elder. We don't recommend to use it for novice traders, but it's useful to know about it.
📚 Conclusion
The Moving Average Convergence Divergence (MACD) is more than just a crossover tool — it's a powerful momentum indicator that offers deep insight into the strength, direction, and timing of market trends. By understanding how the MACD line, Signal line, and Histogram interact, traders can uncover early trend shifts, spot momentum divergences, and time entries and exits with greater confidence.
Whether you're a short-term trader using fast crossovers for scalping or a long-term investor watching for weekly divergences, MACD can adapt to your style when used thoughtfully. Like all indicators, it works best when combined with price action, support/resistance levels, and other indicators — not in isolation.
Ultimately, mastering MACD is not about memorizing patterns, but about learning to read the story of momentum that unfolds beneath the surface of price. With disciplined application and practice, MACD can become a reliable compass in your trading strategy.
Macddivergence
Mastering MACD- Complete Guide- 10 ways to trade itThe Moving Average Convergence Divergence (MACD) is a versatile indicator that can help traders navigate the markets with precision. From trend identification to momentum assessment, the MACD provides multiple actionable insights. In this educational post, we’ll explore the key ways to use MACD effectively, with an example illustration accompanying each strategy.
________________________________________
1. Signal Line Crossovers
The most common use of MACD is the signal line crossover, which identifies potential shifts in market momentum:
• Bullish Signal: When the MACD line (fast-moving) crosses above the signal line (slow-moving), it suggests upward momentum is increasing. This can be an entry signal for a long trade. Bullish crossovers often occur after a period of consolidation or a downtrend, signaling a reversal in market sentiment.
• Bearish Signal: When the MACD line crosses below the signal line, it signals downward momentum, often triggering a short-selling opportunity. Bearish crossovers can occur during retracements in an uptrend or at the start of a bearish reversal.
How to Use: Look for confirmation from price action or other indicators, such as a breakout above a resistance level for a bullish signal or a breakdown below support for a bearish signal. It's essential to avoid acting solely on a crossover; consider volume (stocks, crypto), candle stick formations and other market conditions.
Example: A bullish crossover on the daily chart on TRADENATION:XAUUSD indicates a potential buying opportunity as the price begins to rise. Add a stop-loss below recent lows to manage risk and look for a 1:2 risk:r eward in the next resistance.
________________________________________
2. Zero Line Crossovers
The MACD’s zero line acts as a boundary between bullish and bearish momentum, making it a valuable trend confirmation tool:
• Above Zero: When the MACD line moves above the zero line, it confirms an uptrend, as the fast-moving average is above the slow-moving average. Sustained movement above zero often indicates a strong bullish trend.
• Below Zero: A MACD line below zero reflects a downtrend, indicating bearish market conditions. Persistent movement below zero confirms bearish momentum.
How to Use: Use the zero line crossover to validate trades based on other signals, such as candlestick patterns or trendline breaks. The crossover can act as a second layer of confirmation for existing trade setups.
Example: MACD on a crypto pair crosses above the zero line, confirming the start of a new bullish trend. Traders can combine this with volume analysis to ensure strong market participation.
________________________________________
3. Histogram Analysis
The histogram represents the distance between the MACD line and the signal line, offering insights into momentum:
• Expanding Histogram: Indicates strengthening momentum in the direction of the trend. Larger bars show increasing dominance of bulls or bears.
• Contracting Histogram: Suggests weakening momentum, signaling a possible reversal or consolidation. Smaller bars indicate a loss of trend strength.
How to Use: Monitor the histogram for early signs of momentum shifts before a crossover occurs. The histogram can act as a leading indicator, providing advanced warning of potential changes in price direction.
Example: A shrinking histogram in a forex pair signals that the bullish momentum is losing steam, warning traders of a possible retracement. This can be a cue to tighten stop-loss levels or take partial profits. Conversely, an expanding histogram during a breakout confirms the strength of the move.
________________________________________
4. Identifying Divergences
MACD divergences are powerful tools for spotting potential reversals:
• Bullish Divergence: Occurs when the price makes a lower low, but the MACD forms a higher low, signaling weakening bearish momentum. This often precedes a trend reversal to the upside.
• Bearish Divergence: Happens when the price makes a higher high, but the MACD forms a lower high, indicating diminishing bullish strength. This suggests a potential reversal to the downside.
How to Use: Combine divergence signals with support or resistance levels to enhance reliability. Divergences are most effective when spotted at major turning points in the market.
Example: On a TRADENATION:EURUSD chart, a bearish divergence signals an upcoming price reversal from an up trend to a down trend.
________________________________________
5. Trend Confirmation
MACD confirms trends by staying consistently above or below the zero line:
• Above Zero: Indicates a strong uptrend. Look for pullbacks to enter long trades. The longer the MACD remains above zero, the stronger the trend.
• Below Zero: Reflects a persistent downtrend. Use rallies as opportunities to short. A sustained period below zero reinforces bearish dominance.
How to Use: Use MACD’s trend confirmation alongside other trend-following tools like moving averages or Ichimoku clouds. Ensure that market conditions align with the broader trend.
Example: Combining MACD trend confirmation with moving averages helps traders stay on the right side of the trend in a stock market index. For example, buy when both MACD and a 50-day moving average indicate an uptrend. Exit trades when the MACD begins to cross below zero or shows a divergence.
________________________________________
6. Overbought and Oversold Conditions
Although MACD is not traditionally an overbought/oversold indicator, extreme deviations between the MACD line and the signal line can hint at stretched market conditions:
• Overbought: When the MACD line is significantly above the signal line, it may indicate a price correction is imminent. This often occurs after an extended rally.
• Oversold: When the MACD line is well below the signal line, it suggests a potential rebound. Such conditions are common following sharp sell-offs.
How to Use: Monitor extreme readings in conjunction with oscillators like RSI for added confidence. Look for reversals near key support or resistance levels.
Example: An extended bearish move with a large MACD-signal line gap warns traders of a potential price correction. This can signal an opportunity to exit. Pair this observation with a bullish candlestick pattern to confirm the move (in this example morning star)
________________________________________
7. Combining MACD with Other Indicators
MACD works best when paired with complementary indicators to provide a more comprehensive market analysis:
• RSI (Relative Strength Index): Use RSI to confirm momentum and overbought/oversold conditions.
• Bollinger Bands: Validate price breakouts or consolidations with MACD signals.
• Support and Resistance: Use MACD signals around key levels for confluence.
How to Use: Wait for MACD signals to align with other indicator readings to improve accuracy. Cross-validation reduces false signals and increases confidence in trades.
Example: A bearish MACD crossover near a key resistance level reinforces a short-selling opportunity.
________________________________________
8. Multi-Timeframe Analysis
Using MACD across different timeframes strengthens trade signals and provides context:
• Higher Timeframe: Identify the broader trend to avoid trading against the market. For instance, if the daily chart shows a bullish MACD, focus on long trades in lower timeframes.
• Lower Timeframe: Pinpoint precise entries and exits within the higher timeframe’s trend. The MACD on lower timeframes can help fine-tune timing.
How to Use: Align MACD signals on both higher and lower timeframes to confirm trade setups. This alignment minimizes the risk of false signals.
________________________________________
9. Customizing MACD Settings
Traders can tailor MACD settings to suit different trading styles and timeframes:
• Shorter Periods: Provide more sensitive signals for scalping or day trading. Shorter settings react quickly to price changes but may generate more false signals.
• Longer Periods: Produce smoother signals for swing trading or position trading. Longer settings are less responsive but more reliable.
How to Use: Experiment with different settings on a demo account to find what works best for your strategy. Adjust settings based on the volatility and nature of the asset.
Example: A scalper uses a 5, 13, 6 MACD setting to capture quick momentum shifts in the market, while a swing trader sticks with the standard 12, 26, 9 for broader trends. Compare results across different markets to refine the approach.
________________________________________
10. Crossovers or Divergence at Key Levels
Combining MACD crossovers with price action levels enhances the reliability of trade signals:
• Horizontal Levels: Use MACD signals to confirm reversals or breakouts at support and resistance levels. Crossovers near these levels are often more reliable.
• Fibonacci Retracements: You can combine MACD with retracement levels to validate potential entries or exits. Confluence with retracements adds weight to the signal.
How to Use: Wait for MACD signals to align with key price levels for higher probability trades. Confirmation from candlestick patterns or volume (stock and crypto) adds further credibility.
Example: A bullish MACD divergence aligns with a strong support level, signaling a strong buy setup. Add confirmation with a candlestick reversal pattern, such as a piercing pattern in our case, to enhance precision.
________________________________________
Conclusion:
The MACD indicator’s flexibility makes it a must-have tool for traders of all styles. By mastering these strategies and integrating them in your trading, you can elevate your trading decisions.
Disclosure: I am part of Trade Nation's Influencer program and receive a monthly fee for using their TradingView charts in my analyses and educational articles.

Will the EUR/USD recover? - Is the Stock Market on the verge...In this market preview, I go over the EUR/USD, GBP/USD & USD/JPY with the primary focus on the EUR/USD. Will it recover or give out and test lower lows...
Also, ETF's that I am watching and keeping an eye on a potential bearish tone for the stock market.
I also share a small update on Crypto trade MATIC.
As always, good luck and trade safe.

Hitting a bottom on MATIC?...I don't really trade Crypto's however this one stood out to me as a potential opportunity on the weekly time scale.
MATIC has been trending down since late 2021 but it has always shown a bounce around the $0.30 zone, ultimately creating a very large descending triangle coupled with a MACD that has been diverging up.
Could we see a rally ahead towards $1.00+? well that remains to be seen but I liked the setup and took the opportunity. Should be interesting in how this develops and thus, I'll be keeping an eye on this one.
I'm also checking out DOGE and XRP.
As always, Good Luck & Trade Safe.

Is SOXL ever going to breakout...Have held long on SOXL for about 5.5 weeks now with an average price of $30. I identified a wedge alongside "hidden" divergence on the MACD on a weekly time scale but it's still been pretty much in the same zone/area of consolidation.
When the DeepSeek news broke out, I was for sure ready to cut ties with this one since the Nasdaq was in a complete bloodbath but I gave it some room and glad to see it has been recovering OK for now.
My original target for one is/was $40 but I'd consider taking it off the table if we saw $35+ again. We'll see how this week performs and watch for that gap being filled.
Good Luck & Trade Safe.

EUR/USD getting close to target after tariffs rebound...The EUR/USD has rebounded nicely from two weeks prior when we gapped down pretty significantly after tariffs were announced. The original observation was bullish after identifying a bullish pattern (Descending Megaphone) alongside MACD divergence.
We're stalling at the moment around 1.0500 and I don't expect any further movement throughout the day considering it's a U.S. market holiday however, I'm continuing to hold on to my long position and eying an exit at 1.0600 which is where the yearly pivot point is located.
If we do get to see the 1.0600 price, I will be evaluating short positions somewhere in this zone. We'll see how the remainder of this week develops and go from there.
Good Luck & Trade Safe.

Apollo Tyres, Bearish Reversal with Divergences & Evening StarStock : Apollo Tyres
CMP : 499
Timeframe : Monthly
Pattern : Bearish Reversal with Divergences & Evening Star
Trade Type : Short
Price Action & Technical Analysis
- Bearish Divergence
- MACD Down
- Price is below 5 Moving Average
Target 1 - Rs. 436
Target 2 - Rs. 366
Stoploss - Rs. 520
Disclaimer : "The information provided in this content is for educational purposes only. Please do your own research and consult with a professional financial advisor before making any investment or trading decisions. The author is not responsible for any financial losses incurred as a result of applying the information contained in this material."

possible bearish divergence?Price makes a higher high and MACD a lower low; Is it a possible bearish signal? I believe so... We will see...

Bitcoin MACD and RSI show su strength nowSometimes, its a good idea to look away from the PA and to take a look at the other info presented to us as people Buy and Sell #Bitcoin
Two Major indicators for me are the MACD and the RSI.
The image here is the DAILY #BTC chart for those, since December 2022
At a quick glance you can see that Both MACD and RSI have reset a long way. This gives PA room to move higher.
The line that the Histogram changes colour on is Zero or Neutral and MACD has spent very little time below that line.
The MACD line ( Yellow) has dropped below, heading towards oversold) but still could drop further before reaching strong support.
The Signal line ( red) has yet to get there.
However, the Histogram shows usa a lot of info and that change maybe beginning..
Green bars above the 'Zero line' indicate positive momentum. Red bars below the 'Zero line' indicate negative momentum.
Note in this chart how the Histogram is beginning to show a reduced negative trend. It is rising while the MACD is dropping. that could be seen as Strong BULLISH divergence.
The RSI ( Blue) is possibly THE one to watch. Note how it has reached overbought ( high shaded ) 3 times and then got rejected. But, when RSI drops, PA does not always follow. This also creates Divergences.
Currently, RSI is at the same level it was at when BTC began the push up in Jan 2023. This does not mean it is about to begin rising again because, as you can see, it could drop a lot further.
But we are certainly entering an area that I call "Potential" - The Potential for reversal now exists and we have the strength to continue that reversal when it happens.
Other factors need to be taken into account but this certainly has got me searching for more liquidity.
Does anyone want to buy my house in South East France ?

$SPY 3/15/24 Continued Bearish MACD divergence continuing to play out with a breakdown of wedge trend line. We saw the 508 target get hit today and still face layers of resistance overhead (512ish-515ish-518ATH) ....AND there is a gap still to be filled below (501ish-497ish). If we're going to make another respectable run at ATH then we need to fill the gap and let this MACD divergence play out. If you push up now, you still face the bearish MACD divergence on the daily (and longer hourly charts) with an unfilled gap below 500. We know SPY loves whole numbers and we've seen how it's reacted and responded to the 500 price level in the past. I expect it to have the same magnetism now as it did before.
As always, assume nothing and remove your bias. Let the chart lead the way.
For now, this is what I'm seeing.

HCP runs to earnings on March 4th LONGHCP is a computer infrastructure company. The December earnings were a 160% beat. Given the
quicky evolving AI supertrend, the earnings might be expected to be another big beat. However,
that could be baked into the price. However, the explosive volatility of the last trading session
say otherwise. I will take a long trade here and chase this stock. I see it as pulling out of a
pullback and continuing on higher time frames.

MSFT to $395Overview
Microsoft ( NASDAQ:MSFT ) appears to be within an ascending channel and has reached the resistance line that coincides with the peak of an impulse wave (Wave 3). Utilizing the impulse waves within the channel, a price target of $395 seems probable and may provide a decent Puts trade. If the ascending channel provides textbook formation then a low of $365 is also possible, however, volume and selling pressure should be carefully watched around the $395 price level as steeper declines will require more validation.
The following technical indicators give me confidence that significant selling pressure will soon occur:
Volume -- except for a single outlier in December -- has been steadily decreasing since the channel developed.
On-Balance Volume appears to have reached a ceiling that will need to be carefully watched in the event of a breakout.
Relative Strength Index shows an RSI (green) retreating from the overbought zone. While it is experiencing a slight uptick back to the MA (red), there is still plenty of room until the indicators approach oversold or for the RSI to cross from beneath.
Moving Average Convergence Divergence (MACD) has just crossed its signal line (red) from above and is nosediving downward. In addition, it is showing a divergence as the peaks of the MACD are inverted from the peaks of MSFT's share price.

EUR/USD Potential Bullish MoveA few qualifications for this trade are...
•Falling Wedge Pattern
•“Hidden” Divergence on the MACD.
If we start trading back above 1.0900 and the pivot zone, a target of 1.1150 (Median level) wouldn’t be unreasonable.
I'm going to keep an eye on long positions and see if we can begin trading higher.

KO Buy the Bad News LongKO which as been in an uptrend corrected today due to the news of a 2,000 case recall for
a Salmonella infection scare. This is a gram-negative bacteria which causes bloody diarrhea
and can lead to sepsis shock and death ( for any with a medical background) The sell off of
about 1.5 % was abrupt with high volumes. I see this as a buying opportunity, Moreover on
the rebound reversal, those who sold short will be buying to cover to cash out for the
end of the week. Others like me will look to add to their existing positions. Overall, a short
squeeze could get underway and a momentum pump occur. I see a quick return to the previous
price over a week or less. I will add to my significant call option position in KO at a discount.
The subtle MACD cross under on the zero lag indicator is a tip off here. For those who like to
wait the flip of volatility from selling to buying and then over the moving average line is a
secondary reassurane albeit a little late.

December E-Mini Russell 2000 Index Futures Weekly Chart: 12/7/23Last week we saw the December E-mini Russell 2000 Index futures continues its bullish run with its third consecutive green candle closing into the Ichimoku cloud and above its 52-week moving average. With this move up, the MACD showed a bullish cross indication by crossing its signal line. RSI is trending up along with price. A continuation of this uptrend might find resistance at the top of the Ichimoku cloud (~1,906) and at the 200-week moving average (~1,930). A reversal to the downside might find support at the recent lows at the end of October (~1,640).
Please Note:
Commentary and charts reflect data at the original time of analysis (12/01/23). Market conditions are subject to change and may not reflect all market activity.

SPOT TECH pivoting up LONGTrade idea on the the 2H chart. This is a confirmed reversal with a5 POC line
and 50% retracement in confluence for one target and the pivot high for
the second. I will play this with stock and also a put option for insurance.
90% of the money position in the stock and 10% in the put contract 10DTE.

DISH a TV penny before earnings LONGDISH has earnings on 8/2. On the 2H, price just bounced off the support of the longest of the
three EMAs (35/70/280) and tested the POC line of the volume profile again showing buyer
support at a high trading volume and volatility area. the MACD indicator shows a bullish
line crossover and negative to positive on the histogram where convergence ended and
divergence took over. The dual RSI indicator shows the lower time frame green line in a
dip for a few days and then a rise above the 50 level and the higher time frame black line.
DISH has volume voids above the current price and the near-term pivot high is above. If that
cracks, price momentum could accelerate.
DISH is suitably set up for a long trade as traders anticipate the earnings. I will take it.
I may trade a sizeable trade of stocks or alternatively options striking $8 for 8/11.

OPEN OpenDoor a Penny Real Estate LONGOPEN has earnings upcoming on 8/3. An analysis of the 4H chart with overlays shows
bullish momentum in the set of zero lag EMA lines as well as upgoing anchored VWAP
landlines. Price crossed over the mean VWAP ( thin black) and the POC line of the
volume profile one month ago. The MACD shows bullish momentum since July 24th.
The dual RSI indicator shows the low time frame green line rising and then crossing the
steady higher black time frame line the past trading day and both being at the 60
level.
OPEN is a long trade setup with earnings around the corner. I will take it.

DE traders buy on favorable earningsDeere Company had favorable earnings in May reporting quarterly earnings of about 3.5 % on
their share's market price. DE is a blue-chip industrial sector stock comparable to CAT. It not
a fast mover but very suitable for options trading or investment. On the 4H chart DE had been
trending down through earnings in a descending parallel channel and relying on a lower VWAP
for support. At the middle of this past week, DE made its reversal move into a trend up. This
was accompanied by a change in the volume to predominantly buying volumes relatively high
compared with the period before the earnings. This surge of volume of sorts is the fuel for
upward price action. The zero-lag MACD indicator shows moving average divergence Price is
breaking out of the channel moving towards the mean VWAP and POC line of the volume profile.
demonstrating bullish momentum. Accordingly, I see DE as well setup for a long trade.
( SL $345 pivot low TP1 $400 ( 1 std above mean VWAP ) TP2 $420 ( 2 std above mean VWAP)

Mastering Oscillators In TradingOscillator indicators are technical analysis tools that show the rate at which a particular asset's price or other aspect is changing. Oscillators help traders identify potential trend reversals, trend continuations, and overbought or oversold conditions. These are general strategies that can apply to most oscillators. We would like to cover these in detail so you can ensure that you are using your oscillators to the fullest of their potential.
There are literally thousands of oscillators to choose from on TradingView. All of them probably have a solid use case, but there are a handful of oscillators that have stood the test of time. Those titans of the oscillator category would include the Moving Average Convergence Divergence (MACD), Relative Strength Index (RSI), and Stochastic Oscillator.
1. Trading with Oscillators: Identifying Entry and Exit Points
To use oscillators for trading, traders can look for signals to enter or exit trades. For example, a bullish signal could occur when the indicator crosses above its centerline, indicating that the trend is shifting from bearish to bullish. A bearish signal could occur when the indicator crosses below its centerline, indicating that the trend is shifting from bullish to bearish. Depending on if you are currently in a trade or considering a trade these bullish/bearish signals can be used as either an entry or exit signal.
Traders can also use the momentum of oscillator indicators to identify overbought or oversold conditions. An asset is considered overbought when the oscillator is above a certain threshold, such as 70. Conversely, an asset is considered oversold when an oscillator is below a certain threshold, such as 30. Traders can use these thresholds to identify potential reversal points. Highly overbought can be power areas to look for entry or exit signals.
2. Oscillator Divergences: Confirming Trend Reversals and Continuations
One of the most popular ways oscillators are used is by looking for divergences between the indicator and the price of the asset being analyzed.
For example, a bullish divergence could occur when the price of an asset is making lower lows, but the oscillator is making higher lows. This could be an indication that the trend is about to reverse from bearish to bullish.
Conversely, a bearish divergence could occur when the price of an asset is making higher highs, Oscillator is making lower highs. This could be an indication that the trend is about to reverse from bullish to bearish.
3. Using Oscillators in Combination with Other Technical Indicators
While oscillators can be an incredibly powerful tool on their own, traders can also use them in combination with other technical indicators. For example, traders can use moving averages to confirm oscillator signals. If the oscillator generates a bullish signal and the price of the asset is above its 50-day moving average, it could be a strong indication that the trend is shifting from bearish to bullish.
We see a similar use case in a bearish scenario to follow a trend!
Traders can also use momentum in combination with other oscillators, such as the relative strength index (RSI) or the Stochastic RSI. These indicators provide additional confirmation of momentum signals and can help traders avoid false signals. This is actually one of our favorites as the Stochastic RSI is a measure of the momentum of the RSI. So their respective signals can complement very well.
Putting It All Together
Traders can put this knowledge forward to use most oscillators correctly to adjust their trading strategies and adapt to changing market conditions. We also recommend looking at information the creator of an oscillator has put out in regard to how to properly use the indicator.
Traders can use these strategies to help modify or change their positions. For example, if the chosen oscillator used for an asset is weakening, it could be an indication that the trend is about to reverse. Traders can adjust their strategies accordingly by taking profit from their long positions or entering short positions.
Similarly, if the chosen oscillator for an asset is strengthening, it could be an indication that the trend is about to continue. Traders can adjust their strategies accordingly by adding to their long and short positions or entering new long or short positions.
In conclusion, oscillators are an extremely powerful technical analysis tool that can help traders identify potential trend reversals, trend continuations, and overbought or oversold conditions. By using oscillators in combination with other technical indicators and adjusting their trading strategies to adapt to changing market conditions, traders can improve their trading performance and achieve greater success in the markets.

BTCUSDT local short (Bitcoin bearish divergence)Take a look at 2Days BTC price timeframe.
As you can see we got a bearish MACD cross after the divergency.
Also I noticed a biger ADX divergence which means that the strength of the trend is fading.
May be it could bring as to 24K next 1-2 weeks.
What do you think?

Going short on lower time frames in EURUSDHi again dudes
as there is a BIG MACD divergence in daily time frame in eur/usd, in lower time frames like 4 - 1 and even 15m,there are chances to make short positions with higher R/R.

XAUUSD LONGXAUUSD is almost down to 50% fib level from the previous impulse up. Will be looking for buy opportunities if XAUUSD touches the lower side of the channel or if it breaks the channel to the upside. There is also MACD divergence.
