$AVEOMACD divergence with a drug approval coming at the end of the month and has a potential buyout coming.
Macddivergence
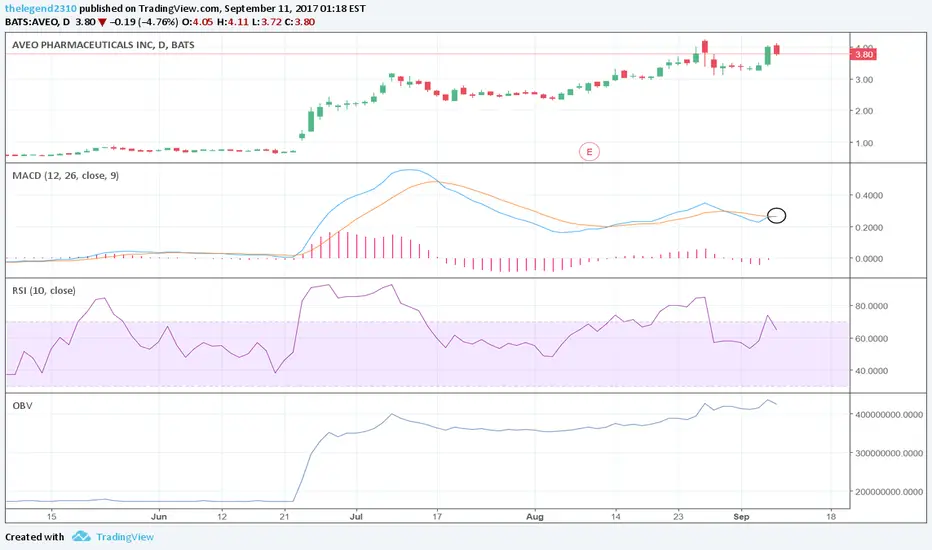
Go for long positionaccording to the MACD divergence we could take a long position to targets that marked.
good luck

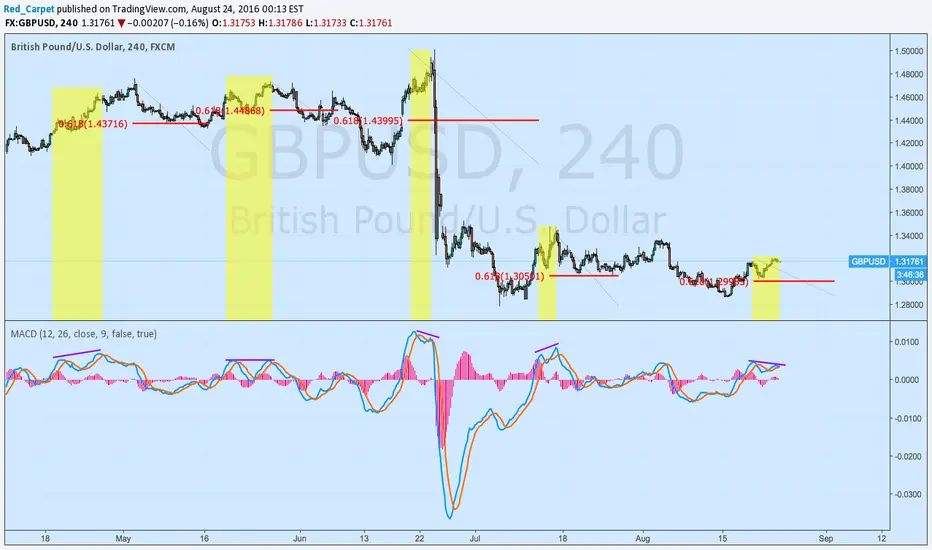
Classic Bearish MACD DivergenceThis was a classic case of Bearish MACD divergence. The price was forming higher highs and the MACD was forming lower Highs.
This could be a good reason to take a trade signal opposite of the trend. With out such indications trading reversals can be risky.

Second Bearish Triangle Break or Test Resistance?The former sees Celgene at $115 en route to filling the $109.25 gap. The latter sees Celgene test $121.70. Supporting the bear case: 1) Emerging broader market bearishness 2) Triple top on XBI daily + MACD bearish divergence 3) CELG weekly and daily charts turning lower + MACD bearish divergence + chinks in the quarterly fundamental story + persistent trader/investor bullishness...
xdaystogo.com

Potential Short Play : Exelixis Inc Exelixis has come to a stop after many months of upward movement, it is now consolidating around 52 week highs, and I am looking for a short opportunity on a large pullback.
Reasons:
- Class A bearish divergence on the weekly & daily chart (RSI, MACDL) + Acc/Dis (Daily only)
- Accumulation/Distribution line has dropped below the 9EMA on the daily chart. The past
two times this occurred the stock had a +10% pullback to the 20EMA
- Overbought on the RSI, and has crossed below the 70 line after being above it for a significant
amount of time. The past two times this occurred the stock also had a +10% pullback to the
20EMA
Going short with a break of the ascending trend line, with a price target around $19.30 or the 20EMA.

GBPAUD Possible Move upFrom the looks of the MACD I am seeing that this pair is going to give us a move to the upside.

AUDCHF Down Move to ComeHey fellows, here I am waiting for the break of the trendline on this pair for a confirmation to enter short on this pair. MACD is showing another move up so trade with caution.

Watch, High Possibility, AUDUSD looking for short setup.Looking from the H4, there is a rising wedge, and also MACD shows divergence.
It's a nice to prepare a sell setup for this pair.
Stop loss above 0.78.
Trade carefully.

Short GBPCHF at Top of PatternVery simple setup here on GBPCHF. Look for short positions if price gives a good reaction at the top of the current pattern.

Short Term Buy on EURGBPHey guys, we have a reversal pattern forming here on EURGBP also with some extra indications that are influencing an up move. On RSI there is an oversold condition and MACD we are seeing divergence. Good luck and safe trading to you all

Double divergence, trendlineWondering what you all think about this, double divergence between RSI & MACD, stochastic dropping, TP at latest swing low... nice RR... thoughts?

MACD & RSI Divergence USDNZD H4MACD & RSI Divergence, definitely losing momentum, looking for a sligh pullback and then short... thoughts?

SHORT GBPUSDMACD , short for moving average convergence/divergence, is a trading indicator used in technical analysis of stock prices, created by Gerald Appel in the late 1970s. It is supposed to reveal changes in the strength, direction, momentum, and duration of a trend in a stock's price.
GBPJPY FALLING WEDGE ON H4GBP JPY pair is in a falling wedge pattern so buying could be a very good option after breakout. Also MACD divergence supports it but keep in mind that it might consolidate a few more days so wait for price action to show the way.

Atlas copco, Bullish divergencePossible trend change in Atlas Copco as you can see at the bullish divergence in MACD and RSI. But it depends much on the company’s future and for Atlas Copco that is hard to predict.

Bearish on DIS Toward 93.25DIS is displaying bearish MACD divergence after a double top and a break of a 4 month long trendline. I am short on the retest of the trendline until the 93.25 area where a bullish bat could potentially be completed. SL is placed above .618AB with target above the completion of the bullish bat.

Long GBPJPY: Bat + Crab Complete at Weekly Trendline SupportGBPJPY has entered the PRZ of two bullish patterns on the daily chart. The PRZ aligns with both horizontal and trendline support which may add to the potential for reversal at this level. Multiple unhit monthly and weekly pivots sit above price and may help pull price toward target. To add to bullish bias, MACD has produced bullish divergence and RSI is oversold. Entry is placed at crab completion with SL below horizontal support and targets at the unhit January, 2015 pivot and the 50% retracement of the bullish bat CD leg.
Bullish Confluence:
Bullish Bat
Bullish Crab
Weekly horizontal support
Weekly TL support
Multiple missed pivots above price
Bullish MACD divergence
RSI Oversold

Reaffirming short from Dec 20, more trouble ahead for BTCAs I stated on 12/20, it was pretty much impossible for BTC to not sink further and significantly. Though it did have a short rebound for X-mas that was destined to be short lived. BTC is only down 7.25% since I made my prediction but with what the 3 hour through 2 week indicators show is trouble. The shorter 4 and 6 hour indicators show a reversal underway following this slight recovery. The one and two day MACDs have still not bottomed out; and worst of all, the 1week and 2week MACDs are looking like they've peaked. This would be their first downward movements since Aug/Sept when we were at 1500CNY/235USD. The StochRSI at 1week is showing its first downward cross since the early Nov. drop as well I would NOT take this lightly.
I'm still optimistic in the medium-term and I'd be very surprised if prices got anywhere near that low, but January could get really cold, really fast. If you are still in BTC I would have your alarms set and be ready to trade or at least hedge with a put option or two. If you are out, just don't get back in too quickly, it can be tempting to see the 2-hour MACD/RSI going positive and panic-buy, but I'd advise against it. 1 day indicators should be able to show us the way when it is time to return.

If BTC can't break 2951, then history will repeat.Red lines = everytime MACD (11,24,11) divergence has gone below -10 after being up > +10. As you can plainly see, it's pretty rare that the 1 day MACD is unreliable with these parameters. This recent fall has tried and failed multiple times to get past the 2951CNY mark. If we use 11/10 as a guide BTC would be going down 20% to around 2330---however I'm at least a little more optimistic that it will, at worst, bounce on the 2450 (or maybe simply 2500) fibonacci support line before climbing back up.
Bear in mind (no pun intended) that the 1 week MACD is due for a drop though, meaning things could get perilous real fast.
