little XAUUSD LongOANDA:XAUUSD
As we have some HD's & RD's on the fib levels ( pitchfork ) and a MACD +HD, so here we go with this Long
Macddivergence

DXY – TRADES | MTF ANALYSE | KW48In today's post I present relevant marks of the DXY for the next week, which could support the one or the other, in their own analysis.
= the technical analysis approaches, are shown in individual images in the post. So that an individual interpretation of the respective - standing alone - is possible.
= the title picture shows an example, of a possible trade. This is one of many possible setups because the current course isn`t able to take a clear direction.
PERSONAL ASSESSMENT
If you look at the price in the higher time frames, you can quickly see that "without" another correction, we have been in free fall.
Thus, an intermediate correction in the smaller time frames is long overdue and could possibly await us next week, with a rising USD / DXY.
This just announces itself with a MACD divergence, in the small-time units. This does not mean that the price must immediately react to it, however, over the next few days after a possible small sell-off, the whole thing can run in the opposite direction.
Why this is so, I explain to you in the following.
MARKET MAKERS MOVE THE PRICE .
The DXY has been in correction for 2-months and many market participants assume a further USD value decline.
And exactly there is the existing problem,
-> "many market participants" are on the USD short side.
If you look a little bit into the TRADING of the HEDGE funds and banks, you will quickly come to the conclusion that without their participation, the market will not move.
1. from the moment the price moves permanently in one direction, it is no longer interesting for large investors.
2. their opportunities to make money are very small, which is why they have to reverse the market direction or initiate a consolidation.
This in turn is due to the following reasons:
- The position sizes of these investors are too large to be executed in a normal market environment.
- For this reason, you can e.g. only build LONG positions if enough investors sell to you = go SHORT.
- Thus, when the market falls, they can build a LONG position piece by piece, without having a "visible" influence on the market.
Then, when you decide that their position size has been successfully filled, let the price go in the opposite direction.
- During the e.g. upward movement, profits are then taken piece by piece where liquidity is highest so that the market does not break away again after these profit-takings.
So that you are prepared for both scenarios (LONG / SHORT), I have carried out the analysis combined with the different time units (monthly, weekly, daily and INTRA-Day) and in the following with chart images.
The following methods are used and shown below:
- MULTI TIME FRAME ANALYSIS
- TREND LINES + TREND CHANNELS
- SUPPLY&DEMAND ZONES
- FIBONACCI LEVEL
- MACD
MONTHLY TIME FRAME
WEEKLY WINDOW
DAY WINDOW
INNER DAY TIME WINDOW
4h + LONG
4h + SHORT
1h
4h Divergence - MACD - Intraday
> Feel free to discuss this in the comments and share our perspectives, I would be "burning" to hear your take on the whole thing.
If this idea and explanation has added value to you, I would be very happy to receive a review of it.
Thank you and happy trading!

SOFI ReversalAs shown on the chart SOFI has been in a downtrend however
the fast 18 EMA and about to cross the 34 EMA, while
the MACD indicator is showing bullish divergence as is the RSI.
This appears to be a great reversal swing long trade.


DXY potential SELL opportunityDXY 1H
- Rising wedge pattern
- Regular Bearish Divergence with MACD indicator
===> Expecting Bearish Breakout

BTC DAILY BULLISH DIVERGENCE(S)Bitcoin has seen a dump recently.
After the dump, on the daily chart it has made a bullish divergence in the RSI.
Also since 17.9k low, BTC has made a MACD bullish divergence.
We have probably seen the worst of the bear market and BTC probably will not go too far below 17.9k.
Personally, I won't open a long position right now because this isn't enough reversal confirmation according to me.
We need to break above 19.5k first and 20.5k after that and confirm a new (short term atleast) uptrend.
BINANCE:BTCUSDT

BTC/USDT (Bearish Bias)Short Call! BINANCE:BTCUSDT
CORRECTION IN CHART: Target 2 is Target 1 and Target 1 is Target 2. (Mistake in charts)
Hello Traders!
I see BTC rejection from its Previous 2 days Highs!
Bearish Engulfing at resistance level!
MACD showing Bearish Divergence on an hourly timeframe!
Risk Reward:
You can close half of the lot after Target 1 is achieved and move SL to breakeven and wait for Target 2.
Best of Luck!


BTC Macro Entry Reversal Strategy. Highest risk return.Entry point for BTC based on momentum reversing out of the bear market. For those trading on confirmation and solid risk reward ratios.
Find a safe bottom, not necessarily the lowest price.
Strategy
1. The major buy signal comes when the first Heikin Ashi 1M closes green. (This was once printed in June 2014. But a high RSI would falsify the signal trigger)
2. Looking deeper into the MACD . We want to see a shorter Histogram close in the monthly. (Where a histogram peak is formed)
3. This is usually confirmed by a healthy sign of the Stoch RSI closing blue over orange.
4. If you're even more conservative. After the signal, I'd wait for an spike in volume.
Notes.
- My personal prediction is that BTC falls 85% towards 11k. However the strategy is triggered at a price the market has decided. The most important part is the risk adjusted return.
- The strategy is best aligned to Lump Sum entry.
- The histogram will peak. It's a matter of when. Therefore I'm not interested in the price.
- I suggest replaying BTCUSD in past cycles on standard bars to see how the bars are printed. (H-A won't work on replay)
- The strategy only has 2 major data points. I'd prefer 3. But the higher time frames install greater confidence.
Tickers and Indicators.
- BTCUSD INDEX 1M, HeikinAshi.
- RSI and Stoch RSI .
- MACD with histogram.

BTCUSDT shortPay attention
The Bitcoin price formed Rising wedge pattern and
OBV divergence is formed
and MACD divergence too.
It is strong bearish signals.
The target is 19 K next week.

Is INTC getting ready to break its channel?As with most stocks, INTC has been in a bearish trend beginning this year. Recently it has entered into a neat downward channel. Following the last test of the channel upper bound (denoted by the blue flag), a substantial decline occurred. This decline ended with a volume spike against the lower bound.
The last test of the lower bound (denoted by the green flag) is strikingly different than the previous. It lacked a volume spike and did not push the Stoch or MACD to new lows. In fact, during the latest retracement up, both indicators flashed signals of a bullish divergence.
It seems likely that this retracement following the latest lower bound will take us at least to the upper bound, if not break the channel.


Lets Go Short – Double Top On The UK100Hi Traders,
Today we are on the UK100
In the 4-hour time frame, we see a nice double top.
My entry was the deepest point of the neckline.
I waited for the price to retrace to the deepest point at the top of the resistance of the neckline.
My short position opened then.
I had confluence from the divergence across the MACD as well as the large bearish volume that occurred during the impulsive break of the neckline.
My target is previous support which gives me a Risk/Reward of 1/2
Have a good Tuesday!
The Vortex Trader

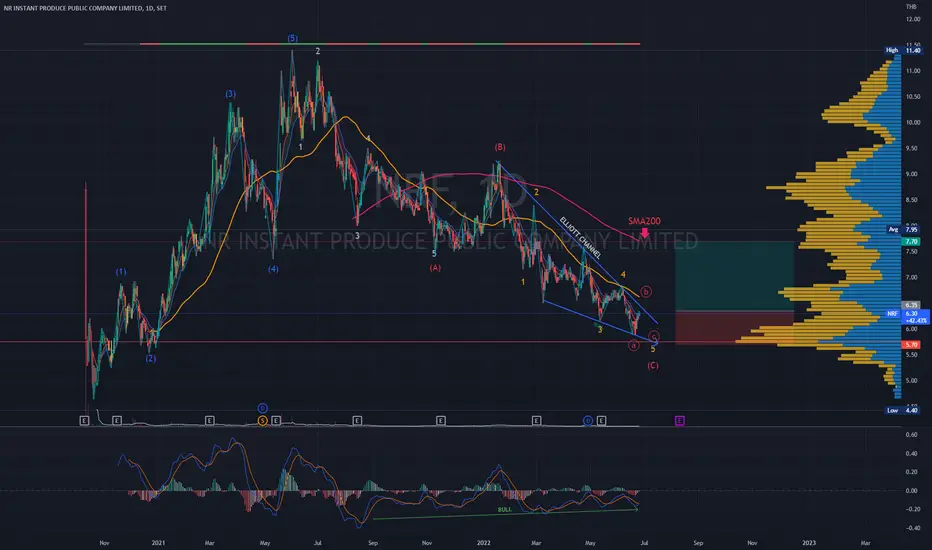
NRF| Wave Projection | Ending Diagonal | Target DowntrendPrice action and chart pattern trading setup
> Downtrend target in range with an ending diagonal pattern of wave C correction
> Entry @ Elliott Wave channel breakout
> Target @ SMA200 for medium term trade
> Stoploss @ Target Wave 5 with downside -10%
> RRR: 2:1
Indicator:
> MACD bullish divergence continuously
Always trade with affordable risk and respect your stoploss
Class A Bullish Divergence COULD be forming on BTC DailyIf BTC continues to dump without a signifiant rally, this will not play out.
But if we see a recovery at this point, there is class A bullish divergence forming in the MACD. This isn't reason to believe that the bottom is in and we are heading to new all time highs, but it could be a sign of a significant reversal in the short term. Most likely, I expect that it would meet resistance in the $28.8k region where the previous accumulation structure had support. It would probably see this as resistance, bounce off and dump again, possibly breaking through that holy barrier of the last cycle's ATH. If we were to get back above that level and back into the range of the old accumulation structure then we can start having a new discussion after oscillators get reset. It is hard to be bullish given the macro economic landscape at this time.

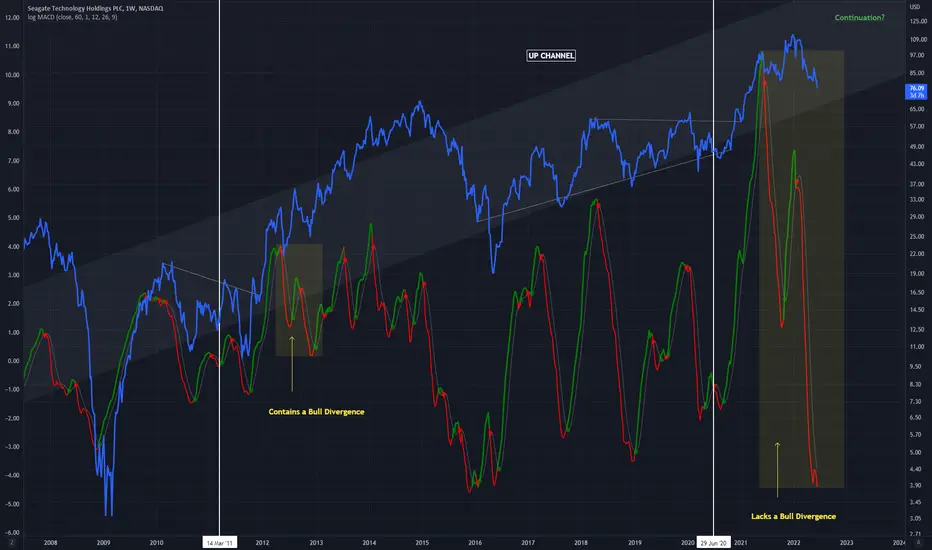
STX - Up Channel MACD AnalysisConsidering the lack of a bullish divergence in the current MACD scenario, yet it being so similar to the previous movement, will we see continuation of the dominant uptrend? (in grey).
We will have to see if a continuation pattern on the MACD follows the current formation, as it did in the prior yellow rectangle containing the bullish divergence
Short $ARKK $84.42Short $ARKK $84.42. Appears to heavy sell off. Downtrend will continue in my opinion. $ARKK walking on very fine line of support. Any further sell off below $85 area is not good for the $ARKK. Trading below all major moving averages. MACD turned negative recently. Current support level $85 area. If broken below then expect short target 1 is $73 area in coming weeks followed by short target 2 $62 area.

RIOT bullish falling wedge!As many of my followers know, I am typically not one to talk about stocks (as my username indicates, I largely talk about cryptocurrencies). However, I do typically make exceptions when the stocks deal with crypto and/or blockchain.
In this example, I want to call out the falling wedge that has occurred with RIOT blockchain. Since the all-time high (ATH) at the beginning of 2021, the price has falling over 85% to the bottom of what looks to be a falling wedge that is forming, which is often a bullish sign. This bullish trend looks further confirmed by MACD forming a nice "reversal" divergence (dotted white lines on price and MACD) indicating that a reversal very well might be in order soon.
There is still some downward potential however, and the general market for both stocks and BTC could easily drag the price of RIOT further down, however, the trend for now looks like a reversal is at least possible for RIOT.
But as always, this is just my opinion and in no way should be taken as financial advice. However, please like or comment if you agree or see anything in addition.

$BTC - is it time for #bitcoin to breakout?!BTC has been forming a falling wedge lately, which I have shared in my ideas several times
yesterday's dip confirmed its support line and brought the price up by a few % putting it back into the falling wedge asap
I want to share this signal the MACD printed in the last days: a slight bullish divergence formed, and the macd line looks ready to cross the signal line, which, being it below the 0 level, would mean a big uptrend incoming if we also manage to break out of the falling wedge with it
drop a like and follow if you enjoyed, and please let me know what you think about this in the comments!

July 22' Sugar #11 Futures Technical Analysis Bearish CaseGoing back to November 18, 2021, July 22’ Sugar was in a downtrend, which was broken on Mar 1, 2022 with a close of 18.12. This began a new Primary uptrend, remaining intact until April 20, 2022.
Even though this trendline was broken with conviction (closing on the lows of the day April 20), the market rallied on April 21, closing at 19.81 (6 ticks from the high). This close touched that broken trendline, but this time, from the opposite side!
More importantly for April 21, the market bounced off 19.49 (low of the day), which was previous major resistance (Pink Line Mar 7-10). Previous resistance tends to become support when a market is in an uptrend.
Friday, April 22 brought a solid down day, taking out not only the 19.50 level, but closing below the first major Fibonacci Level (.382) of 19.29. This day brought the most volume (78.31k contracts) since April 13.
April 13 was the contract high yet closed the day forming a Gravestone Doji Top.
Moving onto technical indicators, the MACD (Moving Average Convergence Divergence) is currently below its 9 EMA (bearish), and below levels not seen since Mar 18 (Sugar had a high of 18.88 that day, well below where we are trading today!). This is considered Negative Divergence, as Sugar is trading higher today, then the last time period when MACD was at these levels.
Bearish Case:
Up trendline on a Daily chart that is broken.
Daily Gravestone Doji Top completed on the contract high.
Negative MACD divergence.
Currently trading below the .382 Fibonacci retracement level from the previous trendline.
18.92 (50% retracement level) is very likely to be seen sooner than later. One thing to keep in mind is that 19.50 could be revisited, yet this time acting as resistance. If 19.50 is revisited, and remains intact as resistance, a close below 19.17 in needed as confirmation to continue lower.
-Paul Wankmueller CMT

APP Potential Spring - Waiting for backtestEyeballing APP here. On the daily we have three drives of classic bullish divergence on the MACD indicating price action reversal. So far, the price has indeed rallied. If APP can successfully backtest that $49.86 previous all-time low close here in late march, then I'll take a long with the chance for a very nice April/May return.
Also, the sellers failed to push the price down to the bottom of that descending channel. Further signalling a greater chance of a reversal and eventual breakout to the upside.
Entry: None yet, need a successful backtest of the spring.

GBP/USD has more little correctionhi guys
in daily chart i found hd+ in macd(divergence) and it will touch dynamic resistance

ADA
Wave 4 completes its trend after breaking the line and enters wave 5
The waves are zigzag
Waves 1 and 3 have 5 microwaves
It is possible that wave 5 also has 5 microwaves.
The end of wave 4 shows a regular positive divergence.
