combination of channel and divergenceHello everyone
Before we start a discussion, it is my pleasure to read your opinion on this post's comment section and support this idea with your likes if you enjoyed it !
EURGBP :
the price reaches the lower line of the parallel channel at the same time, it enters strong support zone.
A divergence between MACD and the price supports the idea of possible upside movement.
target for this analysis is the resistant zone that shown in the chart.
please remember any analysis can be failed. so, manage your risk and respect your stop loss.
Macddivergence

time to LONGdoubble bottom in higher TFs + good Bullish Divergences in MACD and RSI
we do have sign of short term reversal
also good risk to reward. manage your trade and move your SL along the way

Exactly What I Look ForShowing exactly what I look for when I make my trades. Experiences traders know what these indicators mean. Message me if you have any questions about any indicators my arrows are pointing at. With this amount of overlapping signs that point towards a price drop is what leads to my confidence in buying my OTM puts and making high returns.
New and veteran subscribers!! It has been a crazy year for me, I am 23 and bought my first house in May and I depleted my stock market funds to put money down on the house. I slowly saved up money to trade but was not smart with my options and took a lot of losses. Definitely in the red for 2021. I got extensive eye surgery months after buying my home, and most recently got a huge promotion at my job in amazon leading to a 100% increase in my salary.
Looking forward to 2022 and have made a personal new years resolution to make at least one publication a week the year of 2022 and looking to only provide the best charts with the most accurate indicators.
I want to wish everyone a happy new year!

How to send Divergence signals to your Discord server- Do you have a Discord server set up for your own trading community?
- Do you use divergences as part of your trading strategy?
- Would you like to send automated notifications to your Discord server whenever a divergence appears on any chart?
If you have answered yes to all 3 questions above, please keep on reading.
The easiest way to receive automated Divergence alerts to your Discord server, is to combine the alert messages from "The Divergent" divergence indicator on TradingView with a Webhook endpoint on your Discord server.
Step 1: Open Discord, and go to Server Settings
Step 2: Go to Integrations and create a new Webhook
Step 3 (optional): Rename your Webhook to "The Divergent (Divergence indicator)"
Step 4: Select the channel you wish to receive the divergence signals to (i.e. #divergence-signals)
Step 5: Save your Webhook
Step 6: Copy your Webhook URL to your clipboard and head over to TradingView
Step 7: Apply "The Divergent" or "The Divergent (Pro)" indicator to your chart and configure it as you prefer (The free version of The Divergent can signal Regular Divergences only, while the Pro version can signal both Regular and Hidden Divergences)
Step 8: Create a new alert, select "The Divergent" from the top drop down and select one of the Divergence signals (i.e. Regular Bullish)
Step 9: Use the Webhook URL from your clipboard as the Webhook URL of the alert
Step 10: Use the following alert message:
{"content": "The Divergent detected a Regular Bearish Divergence (RSI) on {{exchange}}:{{ticker}} ({{interval}}) @TradingView #divergence $BTC "}
Sample message delivered on Discord:
"The Divergent detected a Regular Bearish Divergence (RSI) on BINANCE:BTCUSDT (60) @TradingView #divergence $BTC"
Feel free to change the content to match your chart / type of divergence you are signalling in the alert.
Note : It is important that you format your alert message as a JSON string, and that you key the message with "content". If you have never used JSON before, it is a good idea to validate your message via jsonlint.com to make sure it is a valid JSON string.
Repeat the same steps for other charts / divergences. Create as many alerts, as many markets / divergences you want to signal to your Discord server.
If you have any questions, please feel free to post it in the comments section below.
If this tutorial was helpful to you, please consider giving it a thumbs up!
Thank you!

BCRX Bullish Hammer Candle and MACD + ADX DivergencesMy favorite long term bio setting up for a bullish move.
Price bounced off support with a bullish hammer candle on higher relative volume, with bullish divergences on both the MACD and ADX.
Possible long setup in the short term.
Entry: 11,30 area
Short Term Target: 12,80 area
Stop loss: 10,50 area
--
Fundamentally I expect this to go $100+ by 2025.

The easiest way to use divergences in your own Pine strategiesDetecting divergences in a Pine indicator / strategy is easy.
You simply have to compare the pivot lows and the pivot highs on the price and the oscillator, and if you can identify a difference between the last & previous pivots made on the price and the oscillator, you have likely found a divergence.
Using this theory, here is an example how you would detect a Regular Bearish divergence:
While the theory of divergence detection is simple, more often than not, things go wrong (the divergence indicator used in the example below is TradingView's built-in Divergence Indicator ):
Would you identify this as a divergence? If not, why not? Is it because the divergence line is slicing through the candles? Or because the line is slicing through the oscillator? Or something else?
Wouldn't it be great if somehow you could filter out invalid divergences from code, such as this one?
We at Whitebox Software were wondering about the same thing, and decided to find a solution to this problem. This is when we realised that while detecting divergences is easy, detecting valid divergences is hard...
After several months in development, we are proud to present to you our divergence indicator called The Divergent .
The Divergent is an advanced divergence indicator with over 2500 lines of Pine Script, exposing over 30 different configuration options, including 9 built-in oscillators, to allow you to tweak every aspect of divergence detection to perfection.
For example, the Line of Sight™ filter in The Divergent would have easily filtered out this invalid divergence above. The Line of Sight™ filter will notice any interruption to the divergence line connecting the price or the oscillator, and will treat the divergence as invalid.
This filter is one of many, which has been created to reduce the false positive detections to a minimum. (In later publications, we will discuss each and every filter in detail).
Alright, so The Divergent knows how to detect accurate divergences, but how is it going to help you detect divergences in your own Pine strategy?
The Divergent is not simply a divergence indicator - it can also emit divergence signals * which you can catch and process in your own strategy. You can think of The Divergent being a DaaS ( D ivergences a s a S ervice)!
* Please note, that divergence signals is a Pro only feature.
To use the signals, simply place The Divergent onto the same chart you have your strategy on, import "The Divergent Library" into your code, link your strategy to The Divergent using a "source" input, and act on the signals produced by The Divergent !
Here is a simple strategy which incorporates divergence signals produced by The Divergent in its entry condition. The strategy will only open a position, if the moving average cross is preceded by a regular bullish or bearish divergence (depending on the direction of the cross):
//@version=5
strategy("My Strategy with divergences", overlay=true, margin_long=100, margin_short=100)
import WhiteboxSoftware/TheDivergentLibrary/1 as tdl
float divSignal = input.source(title = "The Divergent Link", defval = close)
var bool tdlContext = tdl.init(divSignal, displayLinkStatus = true, debug = false)
// `divergence` can be one of the following values:
// na → No divergence was detected
// 1 → Regular Bull
// 2 → Regular Bull early
// 3 → Hidden Bull
// 4 → Hidden Bull early
// 5 → Regular Bear
// 6 → Regular Bear early
// 7 → Hidden Bear
// 8 → Hidden Bear early
//
// priceStart is the bar_index of the starting point of the divergence line drawn on price
// priceEnd is the bar_index of the ending point of the divergence line drawn on price
//
// oscStart is the bar_index of the starting point of the divergence line drawn on oscillator
// oscEnd is the bar_index of the ending point of the divergence line drawn on oscillator
= tdl.processSignal(divSignal)
bool regularBullSignalledRecently = ta.barssince(divergence == 1) < 10
bool regularBearSignalledRecently = ta.barssince(divergence == 5) < 10
float slowSma = ta_sma(close, 28)
float fastSma = ta_sma(close, 14)
longCondition = ta.crossover(fastSma, slowSma) and regularBullSignalledRecently
if (barstate.isconfirmed and longCondition and strategy.position_size == 0)
strategy.entry("Enter Long", strategy.long)
strategy.exit("Exit Long", "Enter Long", limit = close * 1.04, stop = close * 0.98)
shortCondition = ta.crossunder(fastSma, slowSma) and regularBearSignalledRecently
if (barstate.isconfirmed and shortCondition and strategy.position_size == 0)
strategy.entry("Enter Short", strategy.short)
strategy.exit("Exit Short", "Enter Short", limit = close * 0.96, stop = close * 1.02)
plot(slowSma, color = color.white)
plot(fastSma, color = color.orange)
One important thing to note, is that TradingView limits the number of "source" inputs you can use in an indicator / strategy to 1, so the source input linking your strategy and The Divergent is the only source input you can have in your strategy. There is a work around this limitation though. Simply convert the other source inputs to have a string type, and use a dropdown to provide the various sources:
string mySource = input.string("My source", defval = "close", options = )
float sourceValue = switch mySource
"close" => close
"open" => open
"high" => high
"low" => low
=> na
---
This is where we are going to wrap up this article.
We hope you will find the signals produced by The Divergent a useful addition in your own strategies!
For more info on the The Divergent (Free) and The Divergent (Pro) indicators please see the linked pages.
If you have any questions, don't hesitate to reach out to us either via our website or via the comment section below.
If you found value in this article please give it a thumbs up!
Thank you!

#WISH close to a bullish reversal? Here it is why... is why...Hi All, my main 3 take-outs from this analysis are the following:
1- Price is still moving inside the red falling wedge, finding static support in the lower red trendline
2- Strong divergence between MACD and prices, suggesting that the strenght of the sellers might have come to an end
3- In the next intraday sessions, it might be possible to see a further run up towards the 3.95-4$
Not a financial advice, just personal opinion. Do your own due diligence and good luck!

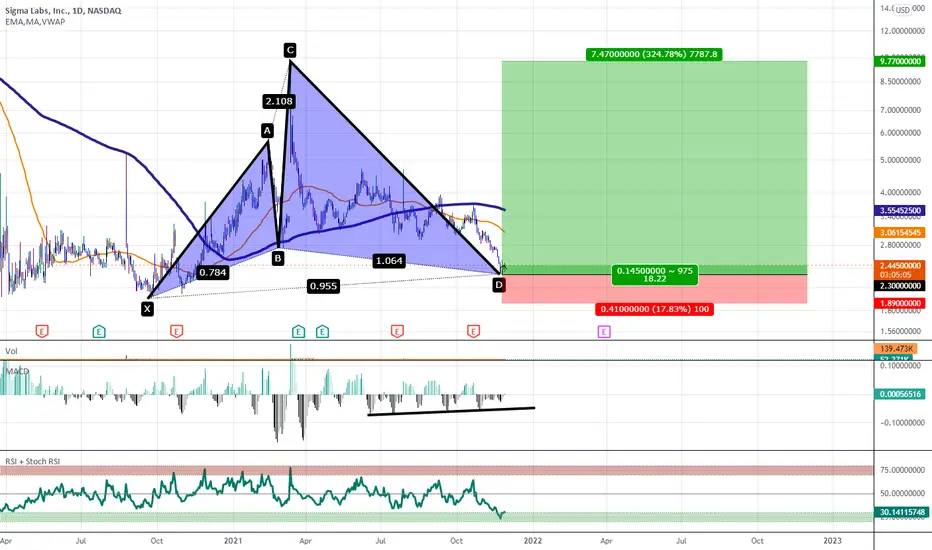
$SGLB: MACD Bullish Divergence and RSI Oversold at Shark PCZI like this stock i'v traded it back and forth a few times looks like it's time to buy again.
DOTUSDT 1d timeframe breakout and retest chart patternDOTUSDT 1d timeframe
--- breakout and retest chart pattern
--- MACD hidden divergence
--- Enter after the breakout the downtrend, or MACD crossover.

NIO could break the downtrend line upwards NIO has been in a decreasing trend since the beginning of the year, which has been confirmed with a couple of bounces. Nevertheless, chances are that the price of these shares break this trend line and starts increasing, having as a first objective attaining $49-50 per share.
The MACD indicator is right now pointing upwards, which means that the two lines that provide its signals could cross in the following trading sessions, providing a more clear buying signal to the market. Therefore, we will be waiting for a breakout signal.
On the other hand, whether the downtrend continues, a triangle figure could end up being created.

Starbucks To Rise Monday I am bullish on SBUX based on the technical indicators I use, especially the MACD. I see SBUX hitting a minimum of $112 a share by the end of the week. Divergence+ shows a green cloud below the most recent candles showing bullish divergence while MACD shows a decrease in selling power. This is an opportunity for SBUX to pop a small 2-4% this week.
What are your thoughts for SBUX?
Do you have a stock you want me to analyze?
Comment below and make sure to like if you like this analysis.

The only divergences guide you needHello, everyone!
There are a lot of traders and many of them use divergence in their own way. Most of these ways lead to the deposit losses in the long run, because generate the late entries. I like to trade with Alexander Elder’s approach to the divergence. It has the clear entry condition and the small stop-losses in case of mistake. Divergences allows to enter the market exactly before the actual trend reverse, thus you always buy the dip and sell the rip, which produces the best risk to reward ratio. Foe divergence defining we will use MACD indicator, but you can choose any oscillator with zero-lne. After reading this guide you will be able to define divergences on every appropriate oscillator.
Let’s consider this approach!
Bearish Divergence
What is bearish divergence? For the true bearish divergence we should see four obligatory signs.
(1) Point C on the price chart should be higher than point A.
(2) Point C on the MACD is below than point A.
(3) The MACD histogram have to cross the zero-line to the downside to form the point B
(4) The MACD histogram have to cross the zero-lne to the upside after the (3).
Now it’s time to find the entry point. Point C is formed when the decreasing column appeared on the MACD. (5) It is the time to execute short position . Stop loss we should take above the point’s C high. As you can see we have the very small stop loss with the huge profit potential.
Next condition enhances the short signal:
(6′) Decreasing MACD lines while the price increases.
Bullish Divergence
Bullish divergence is the opposite to the bearish. We have to see the following conditions.
(1) Point C is below the point A on the price chart.
(2) Point C is above the point A on the MACD histogram.
(3) We have to see first MACD histogram crossover with zero-line to the upside to form the point B.
(4) Than we have to see the opposite crossover to the downside.
Now it’s time to wait the first increasing column on MACD histogram to spot the point C and (5) execute the long positions . Stop loss should be set below the point C low.
We can often see the price decrease continuation to the point D, this point is (6) also forms divergence, which enhances long signal, like the (7) divergence with MACD lines.
In this particular case the stop loss was not hit, but it could be the case. In this case we should re-enter position when the divergence conditions was met again.
DISCLAMER: Information is provided only for educational purposes. Do your own study before taking any actions or decisions at the real market.

Do you agree with a big profit in EURGBP? Let's go 😉Hi dears
The situation is very good for the euro to be bullish in a few weeks. In the coming days, wait for the break of the trend line and safely open a long trade.
The 0.83750 area is a very important area for the euro, so we expect a reaction to this price. On the other hand, in the daily and weekly time frames, we have macddivergence, which give us confirmation of entry for a good purchase.
Make us happy with your likes and comments. Thank you

TFUEL LONG @ $0.356, SL $0.277, TP= $0.865, Risk Reward = 6.4Title says it all symmetrical wedge with compressed prices consolidating and now about to break out. Price is lagging behind the MACD breakout of the downtrendline on MACD. Bullish Divergence on MACD shows this is about to occur and price compressing like a spring should make this a very rapid move to the upside. Target Price = $0.865. This is a 6.44 R trade.

LINK BREAKOUT, LONG @ $31.14, TP = 69.8, R = 6.28Long LINK at $31.14 with recent BREAKOUT and support with resumption of the trend as we bounce above the high of the last candle support test low. This signals another BUY signal along with the curling UPWARD of MACD and breaking above ZERO line on MACD. Finally MACD also breaking out of wedge with upward momentum. Upside Target Price = $69.8. SL = $24.988


stay alert on SOLUSDT !!!in 1H on BINANCE:SOLUSDT we can see resistant trendline and RD -
so if our trigger ( androw ) broken up down and make sure that RD is correct
we can get short on it.
by moj3.ir
trade assistant

West Texas Oil: Trend ReversalThere are multiple signals that indicate that WTICOUSD (West Texas Oil) will reverse the current trend.
Price is still moving upwards but might soon change direction.
All signals and indicators are related to daily candles.
There is a strong divergence of price vs. the MACD histogram
While price is going up, the Commodity Channel Index (CCI) is showing lower highs AND lower lows
MACD is about to cross the signal line
These are three signs that we might see a trend reversal - and I'm pretty sure, that with further technical analysis, we would see more signals that will prove the idea of a reversal.
When shorting Oil, the profit target could be at the monthly pivot point at around 73.158.
The current monthly pivot has not yet been touched by price - the probability is high, that price will drop to that level.

Pure Technicals Outlook for SPX
We can expect a minor contraction based on MACD, Guth 3x confirm, and D+ divergence cloud.
Key word is minor! Our new point of resistance on the 45min chart is 4416.10 which would only be a 55 point drop ( 1.24% )
This drop could happen at the open, or intra day.
This is not processional advice but I ask you fellow experienced traders to give me your thoughts on this and possibly a collab.
I am using this as an indicator for if I am going long next week or short.
What are your thoughts on the week ahead, it is always good to trade with the market trend.

Set To Fall NKE is set to fall immediately, I have placed a large position to put NKE.
Technicals to look at:
Divergence+ gives a sell signal & their signals have not failed me in the past. I have been a long term customer and the profits I have made from these signals have paid for the subscription the remainder of my life. These signals are based on RSI & divergence. I am sponsored by @marketscripters so please message them for info on a low cost subscription that can help you make better trade decisions.
The MACD also shows weakening bullish divergence & growing bearish divergence
Guth 3x Confirm also has 2 very strong sell signals
My plan is to buy Puts for $155 a share Expiring 10.22.21 at the open of todays trading session and scalp a 5-75% profit based on this drop
Follow for more charts like this

Strength & No Emotion Those who are following my SBUX prediction ( link attached ) is still highly probable. We now have support from D+, 3x confirm, and the MACD.
Growing bullish divergence with 2 buy signals from two very reliable scripts are pointing to $114 price target by Friday.

MACD 4CThis indicator will add value and support the technical trader with a visual representation of the MACD histogram.
The above shows the indicator trading method in a AUDUSD M15 chart. The indicator shows the histogram in 4 different colors. The histogram is displayed in Green and Lime color if the histogram is above the Zero line. On the other hand, the histogram is shown in Red and Maroon color below the Zero line. The best method to identify the beginning of the trend’s end is to apply MACD 4C.
-We use the MACD 4c indicator to identify the divergence.
4 Coloured MACD
lime = positive rising
green = positive descending
red = positive rising
maroon = positive descending

BankNifty - MACD DivergenceBank Nifty shows a divergence between the two highs and the histogram of the MACD .
Short should be confirmed when a negative crossover of the EMA's occur within the next few days
