Deep Dive Into Moving Average Convergence Divergence (MACD)🗓 The Moving Average Convergence Divergence (MACD) is one of the most popular momentum indicators in technical analysis. Whether you're a beginner or an experienced trader, understanding how the MACD works can significantly enhance your trading decisions.
📚 Introduction: What Is MACD and Why It Matters
The MACD (Moving Average Convergence Divergence) is one of the most powerful and widely used momentum indicators in technical analysis. It was developed by Gerald Appel in the late 1970s and has since become a staple in the toolkit of traders and investors across markets — from stocks and forex to cryptocurrencies.
At its core, MACD helps traders understand the relationship between two moving averages of an asset’s price, providing insight into both trend direction and momentum strength. By analyzing how these averages converge and diverge, the indicator offers valuable signals for entries, exits, and trend reversals.
What makes MACD especially popular is its versatility — it works well in trending markets, can be used across all timeframes, and combines both leading and lagging components. Whether you're a day trader or a long-term investor, understanding how MACD works gives you an edge in making timely and informed trading decisions.
📚 How the MACD Is Calculated: The Components Explained
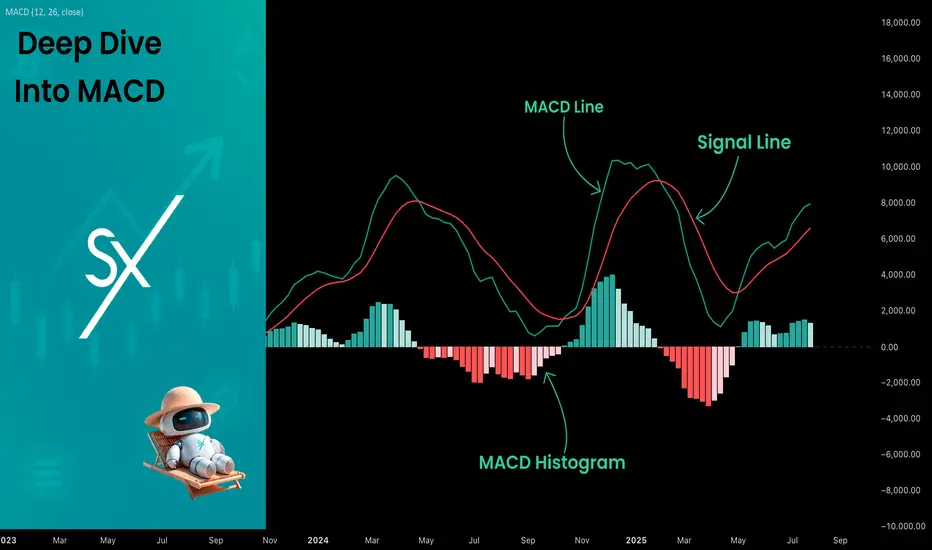
The MACD is built from three core components: MACD line, Signal line and MACD histogram.
🔹 Calculating the MACD Line:
The MACD line is the difference between two Exponential Moving Averages (EMAs), typically 12-period EMA (fast) and 26-period EMA (slow). The formula is:
MACD Line = EMA(12) − EMA(26)
This line captures momentum by tracking how the shorter-term average diverges from the longer-term average. When the MACD line rises, the short-term momentum is increasing faster than the longer-term trend — a sign of bullish acceleration. The reverse implies bearish momentum.
🔹 Calculating the Signal Line:
To reduce noise and provide clearer signals, a 9-period EMA of the MACD line is plotted on top. This is the Signal Line, and it acts as a trigger:
When the MACD line crosses above the signal line → bullish signal (buy)
When the MACD line crosses below the signal line → bearish signal (sell)
Signal Line = EMA(9)(MACD Line)
🔹 Calculating the MACD Histogram:
The Histogram shows the difference between the MACD Line and the Signal Line:
Histogram = MACD Line − Signal Line
It provides a visual representation of momentum strength. The histogram bars expand when momentum strengthens and contract as it fades. It helps you spot shifts in momentum earlier than a basic crossover.
📚 How to Use MACD in Trading Strategies
⚡️MACD Signal Line Crossover
Buy Signal:
MACD Line crosses above the Signal Line from below (bullish crossover)
Preferably when both lines are below the zero line (early in the trend)
Price closes above the long-term trend approximation, in our case we use 200-period EMA
Sell Signal:
MACD Line crosses below the Signal Line from above (bearish crossover)
Preferably when both lines are above the zero line (early in the trend)
Price closes below the long-term trend approximation, in our case we use 200-period EMA
📈Long Trading Strategy Example
1. Wait until MACD line crosses over the Signal line from down to up. In our example we use 1D time frame for BITMART:BTCUSDT.P . Open long trade if point 2 will be completed.
2. Price candle shall be closed above the 200-period EMA. This is long-term trend filter to increase the probability that trades will be open only in the direction of the main trend.
3. Close the long trade when the MACD line crosses under the Signal line. This is an approximation that short-term impulse is over and correction is about to start.
In our case we have +20% return on this long trade, but, please, notice that we have not used initial stop-loss in this strategy. Trade was closed according to the technical condition, this approach can violate the risk management rules, but also can be applicable if you trade the amount ready to lose using this strategy. We will talk about stop-loss later.
📉Short trading strategy example
1. Wait until MACD line crosses under the Signal line from up to down. In our example we use 1D time frame for BITMART:ETHUSDT . Open short trade if point 2 will be completed.
2. Price candle shall be closed below the 200-period EMA. This is long-term trend filter to increase the probability that trades will be open only in the direction of the main trend.
3. Close the short trade when the MACD line crosses over the Signal line. This is an approximation that short-term impulse is over and correction is about to start.
In this case we have +15% return on the short trade. Again, strategy used the technical condition to close the trade and now let's cover how to place the stop-loss. There is no right answer how to use stop-losses. The first and the most obvious way to place stop-loss is using recent swing low/high, but the problem is that all traders are seeing them and do the same. Price tends to reach such levels to collect liquidity.
Another one way to place stop-loss is using the signal candle's high/low. This is so-called 1 candle stop-loss. Usually it's very tight and can allow to have the fantastic risk to reward ratio, but we are now recommend to use it if you are not a professional trader because win rate of such strategy decreases.
Third approach in placing stop-loss which we often use in our algorithmic strategies is the Average True Range (ATR). ATR is the volatility measurement, it allows to take into account the current volatility. Sometimes it helps to avoid the stop-loss hit when trade finally goes in your direction. You can just simply subtract (in case of long trade) or add (in case of short trade) ATR value to the entry price and obtain the dynamic stop loss based on current market condition. Also multiplier can be used for ATR. You shall choose the approach which is more comfortable for you, backtest all these approached to make your choice.
🧪Important: we used the long signals only below the zero-line and short signals above it in the attempt to catch the beginning of a trend and have large potential move. On the picture below you can see the same BITMART:BTCUSDT.P , but what will happen if we open long on the lines crossover above zero line? This trade will not be profitable because of restricted potential.
⚡️MACD Zero Line Crossover
Buy Signal:
MACD Histogram crosses above the zero line (momentum shifts from bearish to bullish)
Price closes above the long-term trend approximation, in our case we use 200-period EMA
Sell Signal:
MACD Histogram crosses below the zero line (momentum shifts from bullish to bearish)
Price closes below the long-term trend approximation, in our case we use 200-period EMA
📈Long Trading Strategy Example
1. Wait until MACD Histogram crosses over zero line. Open long trade if point 2 will be completed.
2. Price candle shall be closed above 200-period EMA. This is long-term trend filter to increase the probability that trades will be open only in the direction of the main trend.
3. Take profit when price reaches 3:1 risk to reward ratio according to the stop-loss from point 4.
4. Stop-loss shall be placed below recent swing low. This point can be discussed, you can use any stop-loss technique described earlier in this article. We demonstrate the simplest one, the key here is using at least 3:1 RR.
📉Short trading strategy example
1. Wait until MACD Histogram crosses under zero line. Open short trade if point 2 will be completed.
2. Price candle shall be closed below 200-period EMA. This is long-term trend filter to increase the probability that trades will be open only in the direction of the main trend.
3. Take profit when price reaches 3:1 risk to reward ratio according to the stop-loss from point 4.
4. Stop-loss shall be placed above recent swing high. This point can be discussed, you can use any stop-loss technique described earlier in this article. We demonstrate the simplest one, the key here is using at least 3:1 RR.
⚡️MACD Divergence Strategy
MACD Divergence is a strategy that helps traders identify potential reversals in market direction before they become obvious on the price chart. This makes it a favorite tool among swing traders and crypto enthusiasts looking to catch major moves early.
But what exactly is a divergence? In simple terms, divergence occurs when price and momentum (MACD) are moving in opposite directions — signaling that the current trend may be losing strength and preparing for a reversal. There are two main types of divergence.
🐂 Bullish Divergence
Price makes a lower low
MACD Histogram makes a higher low
This suggests that while price is still falling, downward momentum is weakening. The bears are losing control, and a bullish reversal may be near. Trading signal is very simple, when bullish divergence happens wait for the first increasing column on MACD histogram and open long trade. Place stop-loss under recent swing low and take profit at 3:1 RR.
🐻Bearish Divergence
Price makes a higher high
MACD makes a lower high
This suggests that while price is still falling, downward momentum is weakening. The bears are losing control, and a bullish reversal may be near. Trading signal is very simple, when bearish divergence happens wait for the first decreasing column on MACD histogram and open short trade. Place stop-loss above recent swing high and take profit at 3:1 RR.
🧪 Important hint: MACD histogram shall cross the zero line between two lows/high to create the most reliable divergence signals. We are not recommend to use it without zero-line crossover to decrease number of false signals.
📈Long Trading Strategy Example
1. MACD Histogram shall create higher low.
2. Price shall create lower low.
3. MACD Histogram shall cross the zero line between lows.
4. MACD Histogram shall show the first increasing column.
5. Put stop-loss under the recent swing low.
6. Put take profit at 3:1.
🧪 You can enhance the long signal with the MACD Line divergence. In our case we have both divergences: with MACD Histogram and MACD Line.
📉Short trading strategy example
1. MACD Histogram shall create lower high.
2. Price shall create higher high.
3. MACD Histogram shall cross the zero line between lows.
4. MACD Histogram shall show the first decreasing column.
5. Put stop-loss above the recent swing high.
6. Put take profit at 3:1.
🧪Divergence is extremely strong signal, but when price continue it's move in the direction of a trend and it's not reversing it can also be the signal for the trend continuation. This situation is called "Baskerville Hound" signal, this name was given by famous trader Alexander Elder. We don't recommend to use it for novice traders, but it's useful to know about it.
📚 Conclusion
The Moving Average Convergence Divergence (MACD) is more than just a crossover tool — it's a powerful momentum indicator that offers deep insight into the strength, direction, and timing of market trends. By understanding how the MACD line, Signal line, and Histogram interact, traders can uncover early trend shifts, spot momentum divergences, and time entries and exits with greater confidence.
Whether you're a short-term trader using fast crossovers for scalping or a long-term investor watching for weekly divergences, MACD can adapt to your style when used thoughtfully. Like all indicators, it works best when combined with price action, support/resistance levels, and other indicators — not in isolation.
Ultimately, mastering MACD is not about memorizing patterns, but about learning to read the story of momentum that unfolds beneath the surface of price. With disciplined application and practice, MACD can become a reliable compass in your trading strategy.
Macdhistogram
Color Your Trades: MACD 4C vs the Classic📊 Coloring Momentum: Comparing Standard MACD vs MACD 4C
Momentum indicators are a trader’s compass—but not all compasses are created equal. In this post, we compare the classic MACD with the visually enhanced MACD 4C , a four-color histogram tool that adds clarity and nuance to trend and momentum analysis.
Let’s break down how both tools work, how we use them at Xuantify, and how you can decide which one fits your strategy best.
🔍 What Are These Indicators?
Standard MACD (Moving Average Convergence Divergence) is a time-tested momentum indicator that plots the difference between two EMAs (typically 12 and 26) and a signal line (usually a 9 EMA of the MACD line). It’s simple, effective, and widely used.
MACD 4C , developed by vkno422 , builds on the classic MACD by introducing a four-color histogram and divergence detection , making it easier to interpret momentum shifts and trend strength visually.
Key Differences:
Standard MACD: Two lines + histogram (single color)
MACD 4C: Histogram only, but with four colors to show trend strength and direction
MACD 4C includes bullish/bearish divergence detection
🧠 How We Use Them at Xuantify
We use both indicators—but for different purposes.
1. Standard MACD – Clean Confirmation
We use it for classic trend confirmation and crossover signals . It’s great for traders who prefer minimalism and are comfortable interpreting line-based momentum.
2. MACD 4C – Visual Momentum Clarity
We use MACD 4C when we want a more intuitive, color-coded view of momentum. The four-color histogram helps us quickly spot trend strength, exhaustion, and divergence.
🧭 Color Coding in MACD 4C
MACD 4C uses four histogram colors (default settings):
Lime/Green : Bullish momentum building or continuing
Red/Maroon : Bearish momentum building or continuing
This makes it easier to:
Spot momentum shifts
Identify trend continuation
Detect divergence at a glance
⚙️ Settings That Matter
Both indicators allow customization, but MACD 4C offers more visual tuning:
MACD 4C:
Adjustable fast/slow MA and signal smoothing
Toggle divergence detection
Color-coded histogram for quick reads
Standard MACD:
Clean, minimal, and widely supported
Best for traders who prefer traditional setups
🔗 Best Combinations with These Indicators
We combine MACD tools with:
Structure Tools – BOS/CHOCH for context
Liquidity Zones – To spot where momentum may reverse
Volume Profile – To confirm strength behind moves
Fair Value Gaps (FVGs) – For precision entries
⚠️ What to Watch Out For
Both indicators are lagging by nature—they rely on moving averages. MACD 4C’s divergence detection can help anticipate reversals, but it’s still best used as a confirmation tool , not a standalone signal.
🔁 Repainting Behavior
Both the standard MACD and MACD 4C are non-repainting . Once a histogram bar or crossover is printed, it remains fixed. This makes them reliable for real-time trading and backtesting .
⏳ Lagging or Leading?
These are lagging indicators , designed to confirm trends—not predict them. MACD 4C’s divergence feature adds a leading element , but it should always be used with structure and price action for confirmation.
🚀 Final Thoughts
If you’re a visual trader who wants more clarity from your momentum tools, MACD 4C is a powerful upgrade. If you prefer simplicity and tradition, the standard MACD still holds its ground.
Try both, test them in your strategy, and see which one sharpens your edge.

Mastering MACD- Complete Guide- 10 ways to trade itThe Moving Average Convergence Divergence (MACD) is a versatile indicator that can help traders navigate the markets with precision. From trend identification to momentum assessment, the MACD provides multiple actionable insights. In this educational post, we’ll explore the key ways to use MACD effectively, with an example illustration accompanying each strategy.
________________________________________
1. Signal Line Crossovers
The most common use of MACD is the signal line crossover, which identifies potential shifts in market momentum:
• Bullish Signal: When the MACD line (fast-moving) crosses above the signal line (slow-moving), it suggests upward momentum is increasing. This can be an entry signal for a long trade. Bullish crossovers often occur after a period of consolidation or a downtrend, signaling a reversal in market sentiment.
• Bearish Signal: When the MACD line crosses below the signal line, it signals downward momentum, often triggering a short-selling opportunity. Bearish crossovers can occur during retracements in an uptrend or at the start of a bearish reversal.
How to Use: Look for confirmation from price action or other indicators, such as a breakout above a resistance level for a bullish signal or a breakdown below support for a bearish signal. It's essential to avoid acting solely on a crossover; consider volume (stocks, crypto), candle stick formations and other market conditions.
Example: A bullish crossover on the daily chart on TRADENATION:XAUUSD indicates a potential buying opportunity as the price begins to rise. Add a stop-loss below recent lows to manage risk and look for a 1:2 risk:r eward in the next resistance.
________________________________________
2. Zero Line Crossovers
The MACD’s zero line acts as a boundary between bullish and bearish momentum, making it a valuable trend confirmation tool:
• Above Zero: When the MACD line moves above the zero line, it confirms an uptrend, as the fast-moving average is above the slow-moving average. Sustained movement above zero often indicates a strong bullish trend.
• Below Zero: A MACD line below zero reflects a downtrend, indicating bearish market conditions. Persistent movement below zero confirms bearish momentum.
How to Use: Use the zero line crossover to validate trades based on other signals, such as candlestick patterns or trendline breaks. The crossover can act as a second layer of confirmation for existing trade setups.
Example: MACD on a crypto pair crosses above the zero line, confirming the start of a new bullish trend. Traders can combine this with volume analysis to ensure strong market participation.
________________________________________
3. Histogram Analysis
The histogram represents the distance between the MACD line and the signal line, offering insights into momentum:
• Expanding Histogram: Indicates strengthening momentum in the direction of the trend. Larger bars show increasing dominance of bulls or bears.
• Contracting Histogram: Suggests weakening momentum, signaling a possible reversal or consolidation. Smaller bars indicate a loss of trend strength.
How to Use: Monitor the histogram for early signs of momentum shifts before a crossover occurs. The histogram can act as a leading indicator, providing advanced warning of potential changes in price direction.
Example: A shrinking histogram in a forex pair signals that the bullish momentum is losing steam, warning traders of a possible retracement. This can be a cue to tighten stop-loss levels or take partial profits. Conversely, an expanding histogram during a breakout confirms the strength of the move.
________________________________________
4. Identifying Divergences
MACD divergences are powerful tools for spotting potential reversals:
• Bullish Divergence: Occurs when the price makes a lower low, but the MACD forms a higher low, signaling weakening bearish momentum. This often precedes a trend reversal to the upside.
• Bearish Divergence: Happens when the price makes a higher high, but the MACD forms a lower high, indicating diminishing bullish strength. This suggests a potential reversal to the downside.
How to Use: Combine divergence signals with support or resistance levels to enhance reliability. Divergences are most effective when spotted at major turning points in the market.
Example: On a TRADENATION:EURUSD chart, a bearish divergence signals an upcoming price reversal from an up trend to a down trend.
________________________________________
5. Trend Confirmation
MACD confirms trends by staying consistently above or below the zero line:
• Above Zero: Indicates a strong uptrend. Look for pullbacks to enter long trades. The longer the MACD remains above zero, the stronger the trend.
• Below Zero: Reflects a persistent downtrend. Use rallies as opportunities to short. A sustained period below zero reinforces bearish dominance.
How to Use: Use MACD’s trend confirmation alongside other trend-following tools like moving averages or Ichimoku clouds. Ensure that market conditions align with the broader trend.
Example: Combining MACD trend confirmation with moving averages helps traders stay on the right side of the trend in a stock market index. For example, buy when both MACD and a 50-day moving average indicate an uptrend. Exit trades when the MACD begins to cross below zero or shows a divergence.
________________________________________
6. Overbought and Oversold Conditions
Although MACD is not traditionally an overbought/oversold indicator, extreme deviations between the MACD line and the signal line can hint at stretched market conditions:
• Overbought: When the MACD line is significantly above the signal line, it may indicate a price correction is imminent. This often occurs after an extended rally.
• Oversold: When the MACD line is well below the signal line, it suggests a potential rebound. Such conditions are common following sharp sell-offs.
How to Use: Monitor extreme readings in conjunction with oscillators like RSI for added confidence. Look for reversals near key support or resistance levels.
Example: An extended bearish move with a large MACD-signal line gap warns traders of a potential price correction. This can signal an opportunity to exit. Pair this observation with a bullish candlestick pattern to confirm the move (in this example morning star)
________________________________________
7. Combining MACD with Other Indicators
MACD works best when paired with complementary indicators to provide a more comprehensive market analysis:
• RSI (Relative Strength Index): Use RSI to confirm momentum and overbought/oversold conditions.
• Bollinger Bands: Validate price breakouts or consolidations with MACD signals.
• Support and Resistance: Use MACD signals around key levels for confluence.
How to Use: Wait for MACD signals to align with other indicator readings to improve accuracy. Cross-validation reduces false signals and increases confidence in trades.
Example: A bearish MACD crossover near a key resistance level reinforces a short-selling opportunity.
________________________________________
8. Multi-Timeframe Analysis
Using MACD across different timeframes strengthens trade signals and provides context:
• Higher Timeframe: Identify the broader trend to avoid trading against the market. For instance, if the daily chart shows a bullish MACD, focus on long trades in lower timeframes.
• Lower Timeframe: Pinpoint precise entries and exits within the higher timeframe’s trend. The MACD on lower timeframes can help fine-tune timing.
How to Use: Align MACD signals on both higher and lower timeframes to confirm trade setups. This alignment minimizes the risk of false signals.
________________________________________
9. Customizing MACD Settings
Traders can tailor MACD settings to suit different trading styles and timeframes:
• Shorter Periods: Provide more sensitive signals for scalping or day trading. Shorter settings react quickly to price changes but may generate more false signals.
• Longer Periods: Produce smoother signals for swing trading or position trading. Longer settings are less responsive but more reliable.
How to Use: Experiment with different settings on a demo account to find what works best for your strategy. Adjust settings based on the volatility and nature of the asset.
Example: A scalper uses a 5, 13, 6 MACD setting to capture quick momentum shifts in the market, while a swing trader sticks with the standard 12, 26, 9 for broader trends. Compare results across different markets to refine the approach.
________________________________________
10. Crossovers or Divergence at Key Levels
Combining MACD crossovers with price action levels enhances the reliability of trade signals:
• Horizontal Levels: Use MACD signals to confirm reversals or breakouts at support and resistance levels. Crossovers near these levels are often more reliable.
• Fibonacci Retracements: You can combine MACD with retracement levels to validate potential entries or exits. Confluence with retracements adds weight to the signal.
How to Use: Wait for MACD signals to align with key price levels for higher probability trades. Confirmation from candlestick patterns or volume (stock and crypto) adds further credibility.
Example: A bullish MACD divergence aligns with a strong support level, signaling a strong buy setup. Add confirmation with a candlestick reversal pattern, such as a piercing pattern in our case, to enhance precision.
________________________________________
Conclusion:
The MACD indicator’s flexibility makes it a must-have tool for traders of all styles. By mastering these strategies and integrating them in your trading, you can elevate your trading decisions.
Disclosure: I am part of Trade Nation's Influencer program and receive a monthly fee for using their TradingView charts in my analyses and educational articles.

A different way to identify momentum with MACD (BABA)Before coming up with this idea I asked myself the following question: is there a way to visualize whether sellers or buyers are in control during a certain move/period of stock price action?
In order to achieve this, I decided to connect the moves with the associated changes on the MACD histogram bars and try to plot the "area's" on the Histogram bars as a form of "accumulative momentum".
With BABA, it can be seen seen that a "change of character" has occurred since march of 2022 where for the first time the area above the 0 line between the histogram bars became larger than the area below it. Is this further evidence that the stock has been in accumulation mode ever since? Time will tell!

Bitcoin BTC Monthly Chart Review Bitcoin's monthly chart with combination of RSI, Bollinger Bands and MACD indicators

MACD: Everything You Need To Know!The MACD indicator consists of three parts: the MACD line, the signal line, and the histogram. The MACD line is calculated by subtracting the 26-period exponential moving average (EMA) from the 12-period EMA. The signal line is a 9-period EMA of the MACD line, and the histogram represents the difference between the MACD line and the signal line.
Let's break this down a little further. The MACD line is a measure of the difference between the 12-period and 26-period EMAs. When the 12-period EMA is above the 26-period EMA, the MACD line will be positive. When the 12-period EMA is below the 26-period EMA, the MACD line will be negative.
When the MACD line crosses above the signal line, it's considered a bullish signal. This indicates that the trend is likely to continue upward. Conversely, when the MACD line crosses below the signal line, it's considered a bearish signal, indicating that the trend is likely to continue downward.
One of the most popular ways to use the MACD indicator is by looking for crossovers between the MACD line and the signal line. When the MACD line crosses above the signal line, it's considered a bullish signal, indicating that the trend is likely to continue upward. Conversely, when the MACD line crosses below the signal line, it's considered a bearish signal, indicating that the trend is likely to continue downward.
But using MACD isn't just about looking for crossovers. There are several other ways to use the indicator to make informed trading decisions. For example, you can use the MACD histogram to identify divergences between price and the MACD indicator, which can signal a potential trend reversal.

ALKYL AMINES, TRADING AT MA100!!1. MA 100 is giving a very good support for alkyl.
2. one thing to note is it is forming a cup and a handle pattern, with the neckline drawn.
3. the stock has not given any returns, from past 6 months.
4. on 1st of august, the stock broke the trend line, to give a breakout, but it was not much effective, and from that period the stock is in a range.
5. have a look on MACD, there's no big bars as much
RESISTANCE LEVELS ARE DRAWN, ONE CAN AIM FOR THE STOCK TO GO UPSIDE ALL OVER TILL 4382

SINGAPORE COVID-19 Wave 6I do not know the robustness of the data collected, as it differs greatly in different places.
But with just a quick comparison:
Singapore relaxed mask measures on 29 August, and from early September, there was already an uptick and the MACD histograms pointed out to late September crossover. Indeed, on 30 September, CNA reported a 40% week on week increase in COVID-19 cases. This wave/spike appears to be much less steep than the previous in June 2022. Nonetheless, with the F1 weekend happening, we might get a continuation of the spike for the month of October into November... a smaller but longer wave.
Demonstrates yet again that the MACD histograms have an edge in projecting the time line to a spike in cases. IF only the people know about such a simple and yet effective tool.
In the same comparison, the UK appears to have tapered down after a recent spike. However, noted that the daily numbers are actually weekly numbers. Demonstrates the robustness of data for reliability.
Indonesia looks to be tapering off too, but Malaysia appears to be looking at a crossover by mid-October for a wave, albeit a smaller wave.
Really, IF anyone still cares enough...

USDJPY short termAfter the big fall of USDJPY last week, we can predict a shift in momentum and search for sell opportunities.
On short term, MACD is showing bearish signals,
Good luck everyone,
Joe.

FCPO M1, MACD Divergence & RSI IndicatorsHi!
Another back test on M1 TF, observing price actions on candlesticks movement by applying HMA 9,21 & 50 as death and golden crossing and MACD & RSI as the reference on the market directions.
Gud luck!
p/s: no voice, pls ignore the background sound hehe

FCPO M1 TF Hi!
Again and again observing price reactions on M1 TF while applying HMA 9,21 & 50 to see price reactions when these HMA's crossing each others up and down.
Fibonacci retracement helps to measure entry, SL and TP. Observe closely when HMA 9 crossing HMA 50 it will give effect golden and death crossing , very useful to gain in Long or short position.
gud luck!

Negative Divergences Often Warn of Declines: Bitcoin & Gold Negative Divergences Often Warn of Impending Declines: Bitcoin Highlighted…. Is Gold Next?
OTC:GBTC
COMEX:GC1!
INDEX:BTCUSD
The CMT Association is proud to publish this guest post from Louise Yamada CMT. Louise was a Managing Director and Head of Technical Research for Smith Barney (Citigroup), and while there, was a perennial leader in the Institutional Investor poll and the top-ranked market technician in 2001, 2002, 2003 and 2004. Louise was the 2016 recipient of the CMT Association’s Lifetime Achievement Award.
In these examples we use the moving average convergence divergence (MACD) indicator to illustrate the concept of divergence, to forensically evaluate Bitcoin and to make some forward looking observations on the gold market.
Divergences:
• Negative momentum divergences often warn of impending price consolidations or declines.
• Divergence forms as price moves to a new high while the oscillator fails at a lower high, creating a negative divergence between the oscillator and price.
• Divergences of this type suggest that the underlying momentum may be waning.
Divergences carry different implications depending upon their time frame.
• Daily perspective divergences suggest either a consolidation, or a pullback in an ongoing uptrend.
• Weekly perspective divergences suggest a more sustained consolidation or even a reversal of trend, particularly if important support is violated.
• Monthly divergences have the potential to result in a more sustained decline or even to reverse an uptrend.
MACD sell signals give validity to divergences.
• Monthly signals have much more weight than weekly and daily.
• Monthly divergences don’t always occur prior to monthly MACD sell signals
• But when a sell signal does occur it offers a structural warning.
Graystone Bitcoin Trust (GBTC) Weekly:
• The March 2021 high (A) was followed by a roughly equal price high (B). However, the MACD momentum peaked at a significantly lower high (Line A1-B1), forming a classic divergence that suggested that upward momentum was fading.
• At point C, the weekly MACD moved onto a sell signal (the fast moving average crossed below the slower moving average) strongly suggesting that positions should be either lightened or sold.
• After the sell signal was generated, price declined from 50 to 24.
• A weekly MACD buy signal was then generated at point D. The subsequent rally carried price near the prior high.
• The failure of the MACD to match its prior high warned of potential weakness.
• The MACD generated another sell signal at point E, suggesting lightening or selling positions. Price offered another decline from 50 to 24.
• After a multi-week consolidation in March-April 2022, price broke below the support @24 (S1-S2).
• MACD continues to decline, suggesting that the price decline may not be over, notwithstanding interim rallies.
• Before considering a new long, evidence of stabilization at a low and the gradual reversal of the daily, weekly and eventually, monthly MACDs would be required.
Grayscale Bitcoin Trust (GBTC) Daily
• On the daily perspective chart that there is a divergence from price (A-B) and the MACD (C-D)
• The divergence warned of the possibility of bearish developments spreading to the weekly and monthly.
Graystone Bitcoin Trust (GBTC) Monthly:
• The monthly chart also shows a divergence at points MD1 and MD2 and on the histogram at MD3 and MD4.
• At the second price high (B), MACD hadn’t yet generated a sell signal, but it was beginning to flatten and roll over.
• One can also see the falling histogram, as the MACD narrows (blue arrow), and the divergence progressed, until it finally generated a clear sell.
• Price lingered above the support at 24 (S2) for several months providing ample time to adjust positions before the May 2022 price breakdown.
Momentum is still declining, suggesting that it’s too soon to consider re-entry, notwithstanding interim rallies, which can carry into resistance, formerly support.
Graystone Bitcoin Trust (GBTC) relative to SPX Weekly:
• One can also note a similar warning in the weekly Relative Strength (RS) negative divergence.
• In this case the RS for BITCOIN/SPX was also suggesting a change from a period of relative overperformance to one of relative underperformance.
Is Gold Next?
Gold is displaying many of the same long term MACD warning behaviors evident in the GBTC chart.
COMEX Gold Daily:
• Despite the May 2020 (R1) and 2022 (R2) price peaks being roughly equal, the MACD (R3 & R4) peaked at a much lower level.
• A MACD Sell signal occurred after the 2020 peak (R3), alerting to the possible price decline, which eventually carried to the March 2021 low near 1,700 (S1).
• The lower March 2022 MACD peak (R4) also registered a sell signal, suggesting one might lighten positions.
COMEX Gold Monthly:
• There is a monthly multi-year MACD negative divergence between the 2012 (R1) and 2022 (R2) price peaks.
• In 2012, the monthly MACD structural sell signal (R3) was very effective as price collapsed toward 1,100 on the sell signal.
• In March 2022, the MACD, registered another major monthly sell (R4), and then subsequently rallied to test the high (R2) without generating a new buy signal (A), a sign of weakness.
• The MACD has remained negative and appears poised to perhaps continue down.
• This suggests that Gold may be in danger of a potentially large decline, especially if support at 1,700 is broken.
• Such a breach could easily find support at the breakout level from the 2013 to 2019 basing pattern at 1400.
• It is possible, however, that although GOLD has broken out in many other currencies, the extraordinary current strength in the US dollar may be contributing to the Gold disappointment.
Louise Yamada CMT
LYAdvisors LLC

using MACD histrogram as a volatility toolMany traders use the MACD for divergence or crossover signals. It is my opinion that market participants trade almost every oscillator this way. This I find rather simplistic and not respecting what the data shows you. In this tutorial I will show a new approach to reading the MACD, obviously I'm probably not the only person who looks at MACD this way however.
MACD colors:
blue = MACD
orange = Signal line
green and red waves = histogram
The MACD is based on the distance between 2 exponential moving averages. The signal line is a smoothed version of the centered oscillator that difference creates. And the histogram is the difference between the MACD and signal line, this is extremely simple.
On the chart I have plotted these 2 EMA's for clarifying my approach to the MACD. Notice that when price rapidly changes these 2 lines move away from eachother, we see the MACD line also move away from the signal line in the process creating a big histogram wave. After the trend becomes less volatile and more one directional the EMA's stay at the same distance from eachother. This creates a flat histogram.
The trading approach I'm showing here is that instead of trading tops and bottoms from the histogram/crossovers you use the MACD as a directional tool and you use the histogram as a volatility tool. We wait for a crear trend to get established after a big histogram wave and then for the trend to stabilise: MACD histogram flattening. Now we have a one directional trend and it is a good place to start opening positions in the trend direction as it is stable.
Notice how we got a nice discount after the trend stabilised and became on directional. I provide below some snapshots of how the market looked when trades would have been opened:
long setup:
short setup:
result:
Use this information with caution as these examples are obviously cherry picked. I hope this gives some perspective on using the MACD in your trading arsenal.

Fantom in descending wedge scaring away all evils 👻💀The price is in an interesting region on the Pitchfork fork.
And MACD is confirming uptrend.
A good time for entry I believe is at 50% of Fibo correction.
The uptrend will expand upon breaking above the wedge.
Against Bitcoin, the asset is also at an interesting moment.
We had a rejection of the last support breakout, and consequently a diagonal resistance breakout.

🚨🔍 SPX 2021/2022: MACD Trend Indicates Major Correction 🔎🚨In this analysis, we look at the SPX MACD Histogram on the daily, and how a clear trend is present that indicates an imminent market correction.
All 4 charts are linked below in case you'd like to take a closer look!
The trend is a MACD Histogram;
a. Contraction
b. Breakout / Warning shot
c. Correction
Today we are in the middle of the breakout / warning shot
I compare this trend to historical bear markets / corrections;
1. 1965-75
2. 1986-88
3. 1998-2009
Based upon the performance & significance of the trend historically, I would appear that we will now see a push onto new ATHs during Oct/Nov, followed by a major market correction in EOY 2021 / start of 2022
What are your thoughts?
yemala

EUR GBP - High Probability reversalThere is a high probability setup opportunity on EUR GBP. The reason for me considering this a high probability reversal is that we have a strong convergence on RSI as well as on MACD.
On the MACD it can be seen more clearly that we have a convergence at a lower low but histogram is above the zero.
Potential TP areas are at the first zone of weekly resistance with 1 : 1 RR and the second zone of weekly resistance with 1 : 2,29 RR.
Keep in mind this is a trade which can take from a few weeks to a month or two to develop. If you are a swing trader you got to be patient and stick with your idea until you are proven the opposite.

The MACD explained ! All you need to know about it Hello everyone, as we all know the market action discounts everything :)
_________________________________Make sure to Like and Follow if you like the idea_________________________________
In this video, I am gonna explain what is the MACD and how to use it and how to identify buy and sell signals using this indicator.
So what is the MACD, The MACD is a trend-following momentum indicator (so a momentum indicator is a technical analysis tool that allows us to determine the strength or weakness of a stock's price movement )
There are a lot of people that use the MACD when they analyze charts because it's very simple and it's very good but I always say never just use 1 indicator to analyze a chart, always try to use at least 3 this way u can make sure that the result is more accurate and the market most likely to move as u analyzed.
let's look at the theory behind the MACD before looking at a real-life example and how to identify buy and sell signals using this indicator :
The typical settings for the MACD are 12 26 and 9.
The MACD consist of 4 parts :
1) Zero line
2) MACD line
3) Signal line
4) Histogram
We start off with our zero line and this is where the MACD line and the signal line move around and basically so if the MACD is trading above the 0 line then it's bullish and if it's under then it's bearish.
Then we have the MACD line and it comes from the 12 26 section, and it gets calculated by subtracting the 26 EMA of the price out of the 12 day EMA of the price.
And after that we have a second line that gets plotted from the 9 section so basically, it’s a moving average for the MACD line so it tries to smooth the MACD line and give us some signals and it's called the signal line.(it's called a signal line because that's where we get our buy and sell signals from)
So on top of that, we have another part in this indicator which is called the histogram. So this histogram job is to show how close these lines will crossover, so when the distance between the MACD line and the signal line is far the histogram gets bigger and bigger.
So how do we use this indicator :
1) Crossovers between the MACD line and the Signal line.
* When the MACD line crosses above the Signal line then its a buy signal (Bullish Crossover)
* When the MACD line crosses below the Signal line then its a sell signal (Bearish Crossover)
2) The Histogram .
A lot of people use histograms as a way to predict when a reversal will occur.
We know that the MACD is a momentum indicator so it can show us when sell pressure is low. And that means it might be a good time to buy. And It can tell you when your long position is about to run out of steam and when you should exit.
3) Divergences between the MACD and the Market Price .
A Divergence means that the indicator is not moving in sync with the Market Price and a Reversal could happen (Note that Reversal trading is risky so please calculate your risks before using this Strategy)
always remember that :
Bullish divergence is when the Market price is going down but the MACD is going up.
Bearish divergence is when the Market Price is going up but the MACD is going down.
I hope I’ve made the MACD easy for you to understand and please ask if you have any questions .
Hit that like if you found this helpful and check out my other video about the Moving Average, Stochastic oscillator, The Dow Jones Theory, How To Trade Breakouts and The RSI. links will be bellow

Using the Moving Average Convergence Divergence (MACD)MACD – What it is
The Moving Average Convergence Divergence (MACD) is the momentum indicator that shows the relationship between two different moving averages:
1. The 12 period exponential moving average – On Tradingview it is the Fast Length.
2. The 26 periods exponential moving average –On Tradingview it is the Slow Length.
The MACD line is calculated by subtracting the 26 period EMA from the 12 period EMA.
The Signal line is the 9 period exponential moving average.
These two lines are then plotted on top of each other. These are the two lines you see when you turn on the MACD indicator.
Additionally, there is a histogram that shows the distance between the two lines. Larger bars tell us that the MACD and Signal are further apart.
When it comes to candles, size matters. The larger the candle the more momentum the trend has.
The histogram will turn green when the MACD line is above 0 (bullish) and it will turn red when the MACD line is below 0 (bearish).
Very bearish momentum is shown above. Photo was taken May 23, 2021.
How to use the MACD
The most important thing to know about the MACD is how to read the relationship between the two lines.
I’ve found that the best timeframe to use the MACD with is daily. This is because the MACD is a lagging indicator and using daily data prevents a lot (not all) of false buy and sell signals.
These signals are:
• When the MACD line crosses above the signal line it is a buy signal
• When the MACD line crosses below the signal line it is a sell signal
Additionally, it is best to use the MACD in a trending market; a market with a clearly defined up or down trend.
Using the MACD with trend lines is a very powerful combination.
The reason for this is that if the market is moving sideways, you can see small fluctuations where the MACD and Signal Line cross but the price does not really go anywhere. These are false breakouts.
Therefore, these signals are not automatic buys and sells.
There are ways of confirming the indications from the MACD chart.
One way is a strategy that uses the RSI and MACD together (which is beyond the scope of this text, but I will discuss in my next article).
Another way is to use the MACD with the current trend. So, if you are in an uptrend and then you see a bullish cross, then this is confirmation that you are likely to go higher.
The same is true in reverse.
Also, please note that the cross over happens well after the price either stabilizes or rises. Again, this is because the MACD is a lagging indicator.
Leading Indicator?
Since the MACD and Signal lines are lagging indicators is there something that can be used in a predictive way?
Some traders use the histogram as a way to predict when a reversal will occur.
Since the MACD is a momentum indicator it can show us when sell pressure is alleviating. Meaning it might be a good time to buy.
This doesn’t always work of course, but with good risk management (stop losses) you can often get into a position well before its breakout.
Conversely, it can show you when your long position is running out of steam and can warn you when to get out.
MACD Divergence
Another useful way to use the MACD is to spot divergences.
A bullish divergence, very similar to the RSI, is when the short-term price trend is going down but, the MACD is going up.
Bearish divergence, also very similar to the RSI, is when the price trend is going up but, the MACD is going down.
Trading this way is sometimes not a good idea because you are trading against the trend. Please practice good risk management if you are trading reversals.
Also, notice the buy signal right before the sell signal that is circled. I really want to hammer home the point that the signals are not automatic buys and sells.
Price action is a great way to confirm the reversal (to the up or down side) of a trend. Because simply spotting a divergence does not guarantee the price will follow.
Final thoughts
As you can see there are different ways of successfully using the MACD. I hope I’ve made a few of these ways clear in this beginner guide.
Please let me know if you have any questions and if you like it, please hit the thumbs up and be sure to follow for more.
Links to my Fibonacci Retracement and RSI guides are below.
Thanks for reading!

$NBS $USDT Uptrend$NBS Chart is looking bullish and Bollinger band are squeezing on the daily screaming to break out! #volume inbound #usdt Mac D crossing on the 4 hour chart

XPEV Round 2Looks ready for another move. RSI curled above 50, break of falling wedge, hist rolling over. Just needs to break resistance with significant volume. Thoughts?

BEST 15M TRADE STRATEGY USING MOST CURRENT PROGRAMED INDICATORS THIS SHORT TERM TRADING STRATEGY IS USING THE MOST CURRENT PROGRAMED INDICATORS TODAY
IN THE MARKET.
Trade pairs with no news that trading session.
Trade daily trend of either the current 4H or Day chart (MACD/SIGNAL LINES, 5/10EMA LINES SHOW DIRECTION).
US session - trade anytime after CLOSE of 1st 15m bar as NYSE opens - 9:30 am ET.
Asian session - trade anytime after CLOSE of 1st 15m bar as JPY opens - 8 pm ET.
UK session - Trade anytime after CLOSE of 1st 15m bar as GBP opens - 3 am ET.
Add Kijun-Sen indicator - The Kijun-sen also means "base line" and is the mid-point of the 26-period high and low. When the price is above Kijun-sen then short- to medium-term price momentum is up (price below momentum is down). This indicator determines trade directional bias.
Add volume indicator - check volume MA box: shows you the average atr value line (choose whatever color).
Volume is the amount of $ that went into a particular candle or in Forex the # of trades that took place.
We look for the volume bar to have reached the volume ma line to trade 100% position size or at least reach. 75% to the volume ma line to trade 1/2 position size. Do not trade if these rules are not met. (Reset setup).
Add %R indicator - Period 10, levels -20/-80, add -50 level, your own line color preference.
Williams %R, also known as the Williams Percent Range, is a type of momentum indicator that moves between 0 and -100 and measures overbought and oversold levels. The Williams %R may be used to find entry and exit points in the market.
We look for oversold condition below -80 level to confirm short entry or over bought condition above the -20 level to confirm long entry. This is contrary to past training but this works best on smaller time frames for the %R indicator.
Add Macd - faster settings of 12 - 17 - 9, Histogram only, make all bars red & green, uncheck macd & signal lines.
We look for histogram bars to be moving towards the zero line or a cross over of the zero line to confirm entry.
Trade Management: trade anytime after trading session candle CLOSED.
1 - Position size (compare volume bar to volume ma line).
a - Candle must have reached the average volume line 100% for a full position size.
b - If 75% of average volume line then ½ position size.
2 - Enter two trades.
3 - SL for both trades will be 5 pips above Kijun-Sen+ line.
4 - 1st trade TP will be 12 pips or 1 x ATR of pair.
5 - No TP on 2nd trade – letting profit run and adjusting SL to follow price.
6 - When 1st TP hit – move 2nd trade SL to breakeven.
7 - Adjust the 2nd trade SL to follow price or exit if price stalls.
EURAUD 15m Short Trade - 1st 15m candle close of NYSE open.
1 - Price below Kijun-Sen+ base line so bearish bias.
2 - Volume bar at ATR average line so price has momentum - trade 100% position size.
3 - %R oversold below -20 level confirms entry.
4 - Macd with red bar below 0 line confirms entry.
5 - 1st TP hit - 2nd trade SL moved to breakeven.
6 - As price continued to fall 2nd trade SL followed highs of previous candle to current price candle.
7 - Either SL was hit or exited trade because price candles stalled sideways.

BTCUSD 1D Heikin, RSI and MACD - Dec 17th, 2018This chart uses Heikin Ashi Candlesticks with CM TrendBars (21D), EMAs (9,15,21,55), RSI (13D, 80/20 ranges) and a MACD indicator.
The Heikin Ashi candlesticks are a different type of candlestick pattern, meaning ‘average bar’ in Japanese, which reduce underlying noise and produce a smoother looking candlestick pattern. The ‘smoother’ candlestick patterns is because Heikin Ashi takes the price bar and averages out the prices, vs the traditional candlestick that simply uses the high and low of the session. As a result, it helps reduce false signals and therefore a Heikin Ashi chart tends to be more red in a downtrend than traditional chart styles.
The candlestick pattern continues it's bearish trend, with no green candles since the 13th of November. We are seeing a tightening of the candle bodies over the last week, with spinning tops on 5 of the last 8 days. While the other three days were 'hanging' men candles with reasonably large bodies. This indicates indecision in the market, and consolidation, around the closest level of resistance, the 3285 print level. Today, with 3 hrs to go, could post the 1st green candle in 2 weeks but the day's has not yet closed.
The RSI (Relative Strength Indicator) is a momentum oscillator that measures the speed and change of price movements. Once we have identified a trend in the market we can use the RSI to identify how strong that trend is (will it continue or reverse). I set the outliers at 80/20, that is below 20 it is oversold and above 80 it is overbought. Because we are in a long term downtrend, it is worth noting that the RSI will be in the under 20 more than above 80, and that I should consider 10 or below as a more reliable oversold signal.
The RSI has remained below 30 since the 14th of November, and has hovered around the 20 area since the 28th of November (3 weeks). A minor point worth noting is that it has touched the 20 line three times since the 28th of November crossover and basically remained above 20. Over the same period the price range has continued to contract and remain in a tightening band. If we see the RSI break above 30 and head towards 65, this could indicate a trend change and a bullish signal. Until then, we really cannot make any trading positions on the current weak divergence.
The MACD (Moving Average Convergence Divergence) is a trend following momentum indicator that shows the relationships between 2 MA's, the MACD (26-12 day MA) and the Signal line (9D). As we can safely assume that the two MA will move towards an equilibrium over time, we can make assertions about price in several key ways including crossovers, divergences between the two MAs, and divergence between the MACD and the price. The MACD Histogram = MACD - Signal Line, and it is simply a more visible indication of the difference between the true.
The MACD Histogram is visually the clearest signal to read, and it provides the earliest indication of a possible trend change. Since the 26th of November it turned more bullish, crossing the 'zero' line on 2nd of December. It weakened from the 6-9th, but then returned to a more bullish trend. We saw the MACD cross over the Signal line on the 2nd of December, and as above touch it again on the 8th, before continuing it's bullish trend (although relatively weak) up until today. As the price has continued down since the 26th this is a clear divergence from the MACD and it indicates a lack of bearish strength and a possible price retracement/reversal in the future.
If the market posts a green candle by the end of the day, this would add further confluence to the probability of a change in trend.

The Best BITCOIN Overview: Are We BULLS or BEARS Right Now?Dear Friends
The generous D4rkEnergY has decided to provide you with this easy to understand Bitcoin-overview, which will help you decide whether we are bullish or bearish on Bitcoin at the moment. This is not rocket science.
Here we go...
As long as we stay above the orange uptrend line, which is formed since June, we are still bullish on BTC. We closed yesterday with a Doji candle, which typically is a sign of reversal. Not a lot of volume though.
MACD histogram shows us, that bulls are in control and have gained momentum since mid September. All bullish signs, that is confirming that we most likely will continue our uptrend.
BUT...
- IF we fall below the orange uptrend line, the bigger descending triangle will be in play, which per definition is bearish. But I would still consider this as a grey zone/neutral area, hence the fact, we might see a lot of bear traps here.
- IF we fall and close below 6,000 USD, we are definitely bears. We can call off my Christmas Rally I have been talking about the last 2 weeks, and we will most likely go down and test 5,000 USD and probably also below.
You are very welcome!
D4 Loves You <3
Please leave a like if you appreciate the content. Thanks in advance!
