Deep Dive Into Moving Average Convergence Divergence (MACD)🗓 The Moving Average Convergence Divergence (MACD) is one of the most popular momentum indicators in technical analysis. Whether you're a beginner or an experienced trader, understanding how the MACD works can significantly enhance your trading decisions.
📚 Introduction: What Is MACD and Why It Matters
The MACD (Moving Average Convergence Divergence) is one of the most powerful and widely used momentum indicators in technical analysis. It was developed by Gerald Appel in the late 1970s and has since become a staple in the toolkit of traders and investors across markets — from stocks and forex to cryptocurrencies.
At its core, MACD helps traders understand the relationship between two moving averages of an asset’s price, providing insight into both trend direction and momentum strength. By analyzing how these averages converge and diverge, the indicator offers valuable signals for entries, exits, and trend reversals.
What makes MACD especially popular is its versatility — it works well in trending markets, can be used across all timeframes, and combines both leading and lagging components. Whether you're a day trader or a long-term investor, understanding how MACD works gives you an edge in making timely and informed trading decisions.
📚 How the MACD Is Calculated: The Components Explained
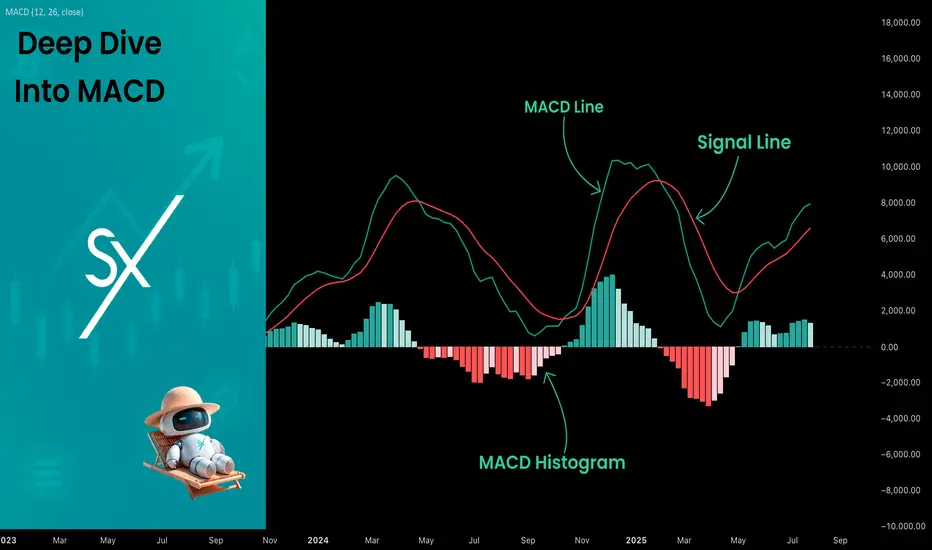
The MACD is built from three core components: MACD line, Signal line and MACD histogram.
🔹 Calculating the MACD Line:
The MACD line is the difference between two Exponential Moving Averages (EMAs), typically 12-period EMA (fast) and 26-period EMA (slow). The formula is:
MACD Line = EMA(12) − EMA(26)
This line captures momentum by tracking how the shorter-term average diverges from the longer-term average. When the MACD line rises, the short-term momentum is increasing faster than the longer-term trend — a sign of bullish acceleration. The reverse implies bearish momentum.
🔹 Calculating the Signal Line:
To reduce noise and provide clearer signals, a 9-period EMA of the MACD line is plotted on top. This is the Signal Line, and it acts as a trigger:
When the MACD line crosses above the signal line → bullish signal (buy)
When the MACD line crosses below the signal line → bearish signal (sell)
Signal Line = EMA(9)(MACD Line)
🔹 Calculating the MACD Histogram:
The Histogram shows the difference between the MACD Line and the Signal Line:
Histogram = MACD Line − Signal Line
It provides a visual representation of momentum strength. The histogram bars expand when momentum strengthens and contract as it fades. It helps you spot shifts in momentum earlier than a basic crossover.
📚 How to Use MACD in Trading Strategies
⚡️MACD Signal Line Crossover
Buy Signal:
MACD Line crosses above the Signal Line from below (bullish crossover)
Preferably when both lines are below the zero line (early in the trend)
Price closes above the long-term trend approximation, in our case we use 200-period EMA
Sell Signal:
MACD Line crosses below the Signal Line from above (bearish crossover)
Preferably when both lines are above the zero line (early in the trend)
Price closes below the long-term trend approximation, in our case we use 200-period EMA
📈Long Trading Strategy Example
1. Wait until MACD line crosses over the Signal line from down to up. In our example we use 1D time frame for BITMART:BTCUSDT.P . Open long trade if point 2 will be completed.
2. Price candle shall be closed above the 200-period EMA. This is long-term trend filter to increase the probability that trades will be open only in the direction of the main trend.
3. Close the long trade when the MACD line crosses under the Signal line. This is an approximation that short-term impulse is over and correction is about to start.
In our case we have +20% return on this long trade, but, please, notice that we have not used initial stop-loss in this strategy. Trade was closed according to the technical condition, this approach can violate the risk management rules, but also can be applicable if you trade the amount ready to lose using this strategy. We will talk about stop-loss later.
📉Short trading strategy example
1. Wait until MACD line crosses under the Signal line from up to down. In our example we use 1D time frame for BITMART:ETHUSDT . Open short trade if point 2 will be completed.
2. Price candle shall be closed below the 200-period EMA. This is long-term trend filter to increase the probability that trades will be open only in the direction of the main trend.
3. Close the short trade when the MACD line crosses over the Signal line. This is an approximation that short-term impulse is over and correction is about to start.
In this case we have +15% return on the short trade. Again, strategy used the technical condition to close the trade and now let's cover how to place the stop-loss. There is no right answer how to use stop-losses. The first and the most obvious way to place stop-loss is using recent swing low/high, but the problem is that all traders are seeing them and do the same. Price tends to reach such levels to collect liquidity.
Another one way to place stop-loss is using the signal candle's high/low. This is so-called 1 candle stop-loss. Usually it's very tight and can allow to have the fantastic risk to reward ratio, but we are now recommend to use it if you are not a professional trader because win rate of such strategy decreases.
Third approach in placing stop-loss which we often use in our algorithmic strategies is the Average True Range (ATR). ATR is the volatility measurement, it allows to take into account the current volatility. Sometimes it helps to avoid the stop-loss hit when trade finally goes in your direction. You can just simply subtract (in case of long trade) or add (in case of short trade) ATR value to the entry price and obtain the dynamic stop loss based on current market condition. Also multiplier can be used for ATR. You shall choose the approach which is more comfortable for you, backtest all these approached to make your choice.
🧪Important: we used the long signals only below the zero-line and short signals above it in the attempt to catch the beginning of a trend and have large potential move. On the picture below you can see the same BITMART:BTCUSDT.P , but what will happen if we open long on the lines crossover above zero line? This trade will not be profitable because of restricted potential.
⚡️MACD Zero Line Crossover
Buy Signal:
MACD Histogram crosses above the zero line (momentum shifts from bearish to bullish)
Price closes above the long-term trend approximation, in our case we use 200-period EMA
Sell Signal:
MACD Histogram crosses below the zero line (momentum shifts from bullish to bearish)
Price closes below the long-term trend approximation, in our case we use 200-period EMA
📈Long Trading Strategy Example
1. Wait until MACD Histogram crosses over zero line. Open long trade if point 2 will be completed.
2. Price candle shall be closed above 200-period EMA. This is long-term trend filter to increase the probability that trades will be open only in the direction of the main trend.
3. Take profit when price reaches 3:1 risk to reward ratio according to the stop-loss from point 4.
4. Stop-loss shall be placed below recent swing low. This point can be discussed, you can use any stop-loss technique described earlier in this article. We demonstrate the simplest one, the key here is using at least 3:1 RR.
📉Short trading strategy example
1. Wait until MACD Histogram crosses under zero line. Open short trade if point 2 will be completed.
2. Price candle shall be closed below 200-period EMA. This is long-term trend filter to increase the probability that trades will be open only in the direction of the main trend.
3. Take profit when price reaches 3:1 risk to reward ratio according to the stop-loss from point 4.
4. Stop-loss shall be placed above recent swing high. This point can be discussed, you can use any stop-loss technique described earlier in this article. We demonstrate the simplest one, the key here is using at least 3:1 RR.
⚡️MACD Divergence Strategy
MACD Divergence is a strategy that helps traders identify potential reversals in market direction before they become obvious on the price chart. This makes it a favorite tool among swing traders and crypto enthusiasts looking to catch major moves early.
But what exactly is a divergence? In simple terms, divergence occurs when price and momentum (MACD) are moving in opposite directions — signaling that the current trend may be losing strength and preparing for a reversal. There are two main types of divergence.
🐂 Bullish Divergence
Price makes a lower low
MACD Histogram makes a higher low
This suggests that while price is still falling, downward momentum is weakening. The bears are losing control, and a bullish reversal may be near. Trading signal is very simple, when bullish divergence happens wait for the first increasing column on MACD histogram and open long trade. Place stop-loss under recent swing low and take profit at 3:1 RR.
🐻Bearish Divergence
Price makes a higher high
MACD makes a lower high
This suggests that while price is still falling, downward momentum is weakening. The bears are losing control, and a bullish reversal may be near. Trading signal is very simple, when bearish divergence happens wait for the first decreasing column on MACD histogram and open short trade. Place stop-loss above recent swing high and take profit at 3:1 RR.
🧪 Important hint: MACD histogram shall cross the zero line between two lows/high to create the most reliable divergence signals. We are not recommend to use it without zero-line crossover to decrease number of false signals.
📈Long Trading Strategy Example
1. MACD Histogram shall create higher low.
2. Price shall create lower low.
3. MACD Histogram shall cross the zero line between lows.
4. MACD Histogram shall show the first increasing column.
5. Put stop-loss under the recent swing low.
6. Put take profit at 3:1.
🧪 You can enhance the long signal with the MACD Line divergence. In our case we have both divergences: with MACD Histogram and MACD Line.
📉Short trading strategy example
1. MACD Histogram shall create lower high.
2. Price shall create higher high.
3. MACD Histogram shall cross the zero line between lows.
4. MACD Histogram shall show the first decreasing column.
5. Put stop-loss above the recent swing high.
6. Put take profit at 3:1.
🧪Divergence is extremely strong signal, but when price continue it's move in the direction of a trend and it's not reversing it can also be the signal for the trend continuation. This situation is called "Baskerville Hound" signal, this name was given by famous trader Alexander Elder. We don't recommend to use it for novice traders, but it's useful to know about it.
📚 Conclusion
The Moving Average Convergence Divergence (MACD) is more than just a crossover tool — it's a powerful momentum indicator that offers deep insight into the strength, direction, and timing of market trends. By understanding how the MACD line, Signal line, and Histogram interact, traders can uncover early trend shifts, spot momentum divergences, and time entries and exits with greater confidence.
Whether you're a short-term trader using fast crossovers for scalping or a long-term investor watching for weekly divergences, MACD can adapt to your style when used thoughtfully. Like all indicators, it works best when combined with price action, support/resistance levels, and other indicators — not in isolation.
Ultimately, mastering MACD is not about memorizing patterns, but about learning to read the story of momentum that unfolds beneath the surface of price. With disciplined application and practice, MACD can become a reliable compass in your trading strategy.
Macdsignal
Momentum Trade in Saksoft Limited1. Reversal from 61.8% retracement
2. Good Volume
3. HH-HL Structure
4. RSI above 50
5. MACD signal turning green

Choose your Side- i often compare TheKing with Nasdaq right now.
- Have a main reason :
- NAS100 (Nasdaq) have mostly "Top Tech Companies" acting as Thermometers in this index.
- SPX (SP500) have Tech Companies + traditional ones. Nasdaq Companies are also included in SPX, but 500 Companies start to be a lot.
- DJIA (Dow Jones Industrial Average) is a Mastodons, i don't use it much because this top 30 is too mixed ( coca cola, boeing, techs, big banks, nike.. etc).
- i mostly use very high TFs, i prefer look from far, less noise, more easy and less headaches.
- i use sometimes to trade with 1D, H12, H4 TFs but when we are bullish. In bearmarket, it's hard to find entries points in bearish mode.
- i don't short markets and accumulate more coins/tokens, so i just DCA, Dollar Cost Averaging is investing a fixed amount of money into a particular investment at regular intervals.
- so this chart is basically only about MACD :
- it's really interesting to see Nasdaq making another red columns in 3W TF, while the markets should recover slowly.
- if you take a look at BTC, columns stayed in Light Red Color and reducing size.
What could it means ?
- Keep in mind that BTC is not a STOCK.
- One of the most pivotal events on Bitcoin's blockchain is the halving, when the supply of new bitcoins is cut in half (2024).
- BTC have 21M Supplies and that's all. no more will be created.
- At any time BTC could stop to follow Nasdaq and do his way, TheKing used to do that before already.
- A small bounce in Nasdaq could be also a huge move for BTC.
- " Choose your side " and DCA the money you don't need for living.
Happy Tr4Ding !

Mastering MACD- Complete Guide- 10 ways to trade itThe Moving Average Convergence Divergence (MACD) is a versatile indicator that can help traders navigate the markets with precision. From trend identification to momentum assessment, the MACD provides multiple actionable insights. In this educational post, we’ll explore the key ways to use MACD effectively, with an example illustration accompanying each strategy.
________________________________________
1. Signal Line Crossovers
The most common use of MACD is the signal line crossover, which identifies potential shifts in market momentum:
• Bullish Signal: When the MACD line (fast-moving) crosses above the signal line (slow-moving), it suggests upward momentum is increasing. This can be an entry signal for a long trade. Bullish crossovers often occur after a period of consolidation or a downtrend, signaling a reversal in market sentiment.
• Bearish Signal: When the MACD line crosses below the signal line, it signals downward momentum, often triggering a short-selling opportunity. Bearish crossovers can occur during retracements in an uptrend or at the start of a bearish reversal.
How to Use: Look for confirmation from price action or other indicators, such as a breakout above a resistance level for a bullish signal or a breakdown below support for a bearish signal. It's essential to avoid acting solely on a crossover; consider volume (stocks, crypto), candle stick formations and other market conditions.
Example: A bullish crossover on the daily chart on TRADENATION:XAUUSD indicates a potential buying opportunity as the price begins to rise. Add a stop-loss below recent lows to manage risk and look for a 1:2 risk:r eward in the next resistance.
________________________________________
2. Zero Line Crossovers
The MACD’s zero line acts as a boundary between bullish and bearish momentum, making it a valuable trend confirmation tool:
• Above Zero: When the MACD line moves above the zero line, it confirms an uptrend, as the fast-moving average is above the slow-moving average. Sustained movement above zero often indicates a strong bullish trend.
• Below Zero: A MACD line below zero reflects a downtrend, indicating bearish market conditions. Persistent movement below zero confirms bearish momentum.
How to Use: Use the zero line crossover to validate trades based on other signals, such as candlestick patterns or trendline breaks. The crossover can act as a second layer of confirmation for existing trade setups.
Example: MACD on a crypto pair crosses above the zero line, confirming the start of a new bullish trend. Traders can combine this with volume analysis to ensure strong market participation.
________________________________________
3. Histogram Analysis
The histogram represents the distance between the MACD line and the signal line, offering insights into momentum:
• Expanding Histogram: Indicates strengthening momentum in the direction of the trend. Larger bars show increasing dominance of bulls or bears.
• Contracting Histogram: Suggests weakening momentum, signaling a possible reversal or consolidation. Smaller bars indicate a loss of trend strength.
How to Use: Monitor the histogram for early signs of momentum shifts before a crossover occurs. The histogram can act as a leading indicator, providing advanced warning of potential changes in price direction.
Example: A shrinking histogram in a forex pair signals that the bullish momentum is losing steam, warning traders of a possible retracement. This can be a cue to tighten stop-loss levels or take partial profits. Conversely, an expanding histogram during a breakout confirms the strength of the move.
________________________________________
4. Identifying Divergences
MACD divergences are powerful tools for spotting potential reversals:
• Bullish Divergence: Occurs when the price makes a lower low, but the MACD forms a higher low, signaling weakening bearish momentum. This often precedes a trend reversal to the upside.
• Bearish Divergence: Happens when the price makes a higher high, but the MACD forms a lower high, indicating diminishing bullish strength. This suggests a potential reversal to the downside.
How to Use: Combine divergence signals with support or resistance levels to enhance reliability. Divergences are most effective when spotted at major turning points in the market.
Example: On a TRADENATION:EURUSD chart, a bearish divergence signals an upcoming price reversal from an up trend to a down trend.
________________________________________
5. Trend Confirmation
MACD confirms trends by staying consistently above or below the zero line:
• Above Zero: Indicates a strong uptrend. Look for pullbacks to enter long trades. The longer the MACD remains above zero, the stronger the trend.
• Below Zero: Reflects a persistent downtrend. Use rallies as opportunities to short. A sustained period below zero reinforces bearish dominance.
How to Use: Use MACD’s trend confirmation alongside other trend-following tools like moving averages or Ichimoku clouds. Ensure that market conditions align with the broader trend.
Example: Combining MACD trend confirmation with moving averages helps traders stay on the right side of the trend in a stock market index. For example, buy when both MACD and a 50-day moving average indicate an uptrend. Exit trades when the MACD begins to cross below zero or shows a divergence.
________________________________________
6. Overbought and Oversold Conditions
Although MACD is not traditionally an overbought/oversold indicator, extreme deviations between the MACD line and the signal line can hint at stretched market conditions:
• Overbought: When the MACD line is significantly above the signal line, it may indicate a price correction is imminent. This often occurs after an extended rally.
• Oversold: When the MACD line is well below the signal line, it suggests a potential rebound. Such conditions are common following sharp sell-offs.
How to Use: Monitor extreme readings in conjunction with oscillators like RSI for added confidence. Look for reversals near key support or resistance levels.
Example: An extended bearish move with a large MACD-signal line gap warns traders of a potential price correction. This can signal an opportunity to exit. Pair this observation with a bullish candlestick pattern to confirm the move (in this example morning star)
________________________________________
7. Combining MACD with Other Indicators
MACD works best when paired with complementary indicators to provide a more comprehensive market analysis:
• RSI (Relative Strength Index): Use RSI to confirm momentum and overbought/oversold conditions.
• Bollinger Bands: Validate price breakouts or consolidations with MACD signals.
• Support and Resistance: Use MACD signals around key levels for confluence.
How to Use: Wait for MACD signals to align with other indicator readings to improve accuracy. Cross-validation reduces false signals and increases confidence in trades.
Example: A bearish MACD crossover near a key resistance level reinforces a short-selling opportunity.
________________________________________
8. Multi-Timeframe Analysis
Using MACD across different timeframes strengthens trade signals and provides context:
• Higher Timeframe: Identify the broader trend to avoid trading against the market. For instance, if the daily chart shows a bullish MACD, focus on long trades in lower timeframes.
• Lower Timeframe: Pinpoint precise entries and exits within the higher timeframe’s trend. The MACD on lower timeframes can help fine-tune timing.
How to Use: Align MACD signals on both higher and lower timeframes to confirm trade setups. This alignment minimizes the risk of false signals.
________________________________________
9. Customizing MACD Settings
Traders can tailor MACD settings to suit different trading styles and timeframes:
• Shorter Periods: Provide more sensitive signals for scalping or day trading. Shorter settings react quickly to price changes but may generate more false signals.
• Longer Periods: Produce smoother signals for swing trading or position trading. Longer settings are less responsive but more reliable.
How to Use: Experiment with different settings on a demo account to find what works best for your strategy. Adjust settings based on the volatility and nature of the asset.
Example: A scalper uses a 5, 13, 6 MACD setting to capture quick momentum shifts in the market, while a swing trader sticks with the standard 12, 26, 9 for broader trends. Compare results across different markets to refine the approach.
________________________________________
10. Crossovers or Divergence at Key Levels
Combining MACD crossovers with price action levels enhances the reliability of trade signals:
• Horizontal Levels: Use MACD signals to confirm reversals or breakouts at support and resistance levels. Crossovers near these levels are often more reliable.
• Fibonacci Retracements: You can combine MACD with retracement levels to validate potential entries or exits. Confluence with retracements adds weight to the signal.
How to Use: Wait for MACD signals to align with key price levels for higher probability trades. Confirmation from candlestick patterns or volume (stock and crypto) adds further credibility.
Example: A bullish MACD divergence aligns with a strong support level, signaling a strong buy setup. Add confirmation with a candlestick reversal pattern, such as a piercing pattern in our case, to enhance precision.
________________________________________
Conclusion:
The MACD indicator’s flexibility makes it a must-have tool for traders of all styles. By mastering these strategies and integrating them in your trading, you can elevate your trading decisions.
Disclosure: I am part of Trade Nation's Influencer program and receive a monthly fee for using their TradingView charts in my analyses and educational articles.

Multiple Signals Shows BTC Might Touched Short-Term BottomLast time BINANCE:BTCUSDT had all 3 of these signals was in August 2024:
1️⃣ RSI <30 in oversold territory
2️⃣ MACD < 0
3️⃣ Fear & Greed Index at "Extreme Fear"
Also, since 2024 began, every time CRYPTOCAP:BTC had a wick + volume spike, it marked a "short-term" bottom.
What do you think? Is this the bottom for BITSTAMP:BTCUSD ?
Leave a comment!
🔴 Read my signature & publications for more info you don’t want to miss.
🔥 for more future "guesses" like this!

Let's talk about the MACD components, signals and strategies The Moving Average Convergence Divergence (MACD) is a powerful technical indicator widely used in crypto trading to identify trends, momentum shifts, and potential entry or exit points.
Here's how to effectively use MACD in your crypto trading strategy:
Understanding MACD Components
The MACD consists of three main elements:
MACD Line: Calculated by subtracting the 5-period Exponential Moving Average (EMA) from the 20-period EMA
Signal Line: A 9-period EMA of the MACD line
Histogram: Represents the difference between the MACD line and the signal line
Key MACD Trading Signals
Signal Line Crossovers
Buy Signal: When the MACD line crosses above the signal line
Sell Signal: When the MACD line crosses below the signal line.
Zero Line Crossovers
Bullish Signal: MACD crosses above the zero line
Bearish Signal: MACD crosses below the zero line
Divergences
Bullish Divergence: Price makes lower lows while MACD makes higher lows
Bearish Divergence: Price makes higher highs while MACD makes lower highs
MACD Trading Strategies
Trend Following
Use MACD to identify and follow strong trends. When the MACD line is above the signal line, it indicates an uptrend, while the opposite suggests a downtrend
Momentum Trading
The MACD histogram can help identify building momentum. Increasing histogram bars suggest strengthening momentum in the current direction
Divergence Trading
Look for divergences between price action and MACD to spot potential trend reversals
Multiple Timeframe Analysis
Combine MACD readings from different timeframes to get a more comprehensive view of the market
Best Practices
Confirm Signals: Use MACD in conjunction with other indicators like RSI or Bollinger Bands for stronger confirmation
Avoid Choppy Markets: MACD is less effective in ranging or sideways markets, potentially generating false signals
Risk Management: Always use stop-loss orders and proper position sizing to manage risk
Timeframe Selection: Choose an appropriate timeframe based on your trading style (e.g., intraday, swing, or long-term)
Default Settings: Stick to the default MACD settings (12, 20, 5) as most traders use these, potentially creating self-fulfilling prophecies in the market

Welcome to the Bitcoin Christmas PUMP! BTC 1D MACD Crossover↖️⬆️ Click the 🚀
Welcome to the Bitcoin Christmas PUMP!
₿ ₿ ₿ ₿ ₿ 🚀🚀🚀🚀🧑🏻🎄🧑🏻🎄🧑🏻🎄🎅🎅🎅🧑🏻🎄🧑🏻🎄🧑🏻🎄🚀🚀🚀🚀₿ ₿ ₿ ₿ ₿
The 1D MACD Crossover just signaled on COINBASE:BTCUSD BTC 1 Day candle.
But that's not all. It's the type of crossover. Text book.
RSI just entering 70 area.
The last time the 1D MACD crossover happened, Bitcoin saw a 45% pump.
looks like it should go to just past new year. The big question is does it continue before taking a breather.....?
In fact, when using the last pump as a guide, it falls perfectly in line with the Fib levels and lands right around $150,000. (just my silly extrapolation. I'm sure it's nothing. ;)

Highly Accurate "BUY" Signal with MACD
The "Conject28 3in1 Trend Indicator" I developed generates highly accurate BUY signals when combined with the MACD indicator.

Bullish Alert: Tata Technologies|Strong Swing Trade Potential!📈 Bullish Alert: Tata Technologies Ltd. Shows Strong Swing Trade Potential! 🚀
Stock Analysis Report
Stock Name : Tata Technologies Ltd.
Timeframe: Daily
Current Market Price (CMP) : ₹1068
________________________________________
Trade Type
• Trade Type: Swing Trade
________________________________________
Technical Analysis
1. Trendline Breakout:
The stock has recently broken above a key trendline with increased volume, indicating a strong bullish signal.
Following the breakout, the stock has successfully retested the trendline, further
validating the upward momentum.
2. Indicators:
MACD: Buy signal confirmed.
Oscillator: Buy signal confirmed.
3. Moving Averages:
The price is currently trading above both the 50-day and 100-day moving averages, reinforcing the positive trend.
________________________________________
Target Prices
• T-1: ₹1115
• T-2: ₹1150
• T-3: ₹1180
________________________________________
Stop Loss
• SL: ₹1045
________________________________________
Summary : Tata Technologies Ltd. presents a strong swing trade opportunity. The stock exhibits a bullish trend supported by a recent trendline breakout, successful retest, and positive signals from key technical indicators. With the price trading above significant moving averages, potential target prices are set at ₹1115, ₹1150, and ₹1180, while a stop loss is recommended at ₹1045 to manage downside risk.
________________________________________
Disclaimer : " Please do not base your trades solely on the ideas mentioned above. Conduct your own research before making any trading decisions. We are not responsible for any financial losses that may result from applying this study or from taking any early entry or exit in trades. "

JIO FIN SERVICES LTD, Breakout in Daily Chart with High VolumeStock : JIO FIN SERVICES LTD
CMP : 344.90
Timeframe : Daily
Pattern : Breakout with Volume
Trade View : Bullish
Price Action & Technical Analysis
- Strong Bullish Candle with volume
- Breakout the Resistance
- MACD & Oscillators Buy Signal
- Moving Average Crossovers
Target 1 - 356
Target 2 - 376
Target 3 - 394
Stoploss - 325
Disclaimer : " Please do not base your trades solely on the ideas mentioned above. Conduct your own research before making any trading decisions. We are not responsible for any financial losses that may result from applying this study or from taking any early entry or exit in trades. "

Apollo Tyres, Bearish Reversal with Divergences & Evening StarStock : Apollo Tyres
CMP : 499
Timeframe : Monthly
Pattern : Bearish Reversal with Divergences & Evening Star
Trade Type : Short
Price Action & Technical Analysis
- Bearish Divergence
- MACD Down
- Price is below 5 Moving Average
Target 1 - Rs. 436
Target 2 - Rs. 366
Stoploss - Rs. 520
Disclaimer : "The information provided in this content is for educational purposes only. Please do your own research and consult with a professional financial advisor before making any investment or trading decisions. The author is not responsible for any financial losses incurred as a result of applying the information contained in this material."

Robinhood waking up bigtime Macro signs BULLISHHi guys this is a MACRO analysis on Robinhood (HOOD). Macro meaning larger timeframe aka the 1 week in this instance.
Alot of stocks are down from their previous tops. Which means potentials for longterm gains for many names possible.
During the decline of assets, price action may create specific chart patterns that may signal the bottom.
For HOOD -> such a pattern was observed. We've been in this pattern since January 2022.
Making it a BIG DEAL. Acting like a pressure cooker if you will.
This pattern is known as the Rectangle pattern, better known as Consolidation or Consolidation zone.
Remember chart patterns must be traded on confirmation of a breakout. Its never a good idea to buy within chart patterns as experts say within chart patterns its a 50/50 chance. Therefore, probabilities increase once confirmation comes in.
We are currently in the process of trying to breakout.
I am now on full observation mode, as i will be looking to add.
This current move was initiated by a retrace to the golden FIB ratio at around 10.60$. We maintained support, allowing for our current UPTREND.
Notice also i have momentum indicators up.
STOCH RSI has crossed Bullish. This will allow for buying to commence.
MACD is also giving MACRO bullish signs, BULLISH CROSS ABOVE the 0 level and increasing size of the histobars. Major uptrends occur when MACD is crossed bullish above 0 level, you could even say Bull markets occur.
We will continue our Uptrend until Bearish crosses are seen.
Now lets look at the market structure above the consolidation zone. Notice how theres not much data above. Only a single sharp group of candles on the left. This shows no resistance exists above consolidation zone. This means price action above will cut through like butter to my 1st target zone at around $30-35.
NOW REMEMBER watch for confirmation of a breakout atleast on the 1 day but 1 week prefered.
I will be continously updating new information as needed.
__________________________________________________________________________________
Thank you for taking the time to read my analysis. Hope it helped keep you informed. Please do support my ideas by boosting, following me and commenting. Thanks again.
Stay tuned for more updates on HOOD in the near future.
If you have any questions, do reach out. Thank you again.
DISCLAIMER: This is not financial advice, i am not a financial advisor. The thoughts expressed in the posts are my opinion and for educational purposes. Do not use my ideas for the basis of your trading strategy, make sure to work out your own strategy and when trading always spend majority of your time on risk management strategy.

FAANG, macd and MAs divergence.ie minimize risk by buying positions when both MAs(price action) fits macd potential. Divergence is bearish.
maximize gains by ONLY buying good positions.

Rumble (RUM) Macro developments found looking like a solid buyHi guys. As always, im on the lookout for macro developments or signals found in assets. Which pose for high probability/ best scenario for taking positions.
Rumble (RUM) is on my radar for this idea post.
My analysis is on the 1 week timeframe.
As you can see RUM has been in a Descending channel since Feb 2022.
Recently we reached the bottom of the channel at 3.43 level. And began our recent rally.
We are as of now, in the process of breaking out of this Descending channel.
This is HUGE. The trend is beginning to shift in RUM. So we can call it a trend change attempt.
If we can confirm out of this Descending Channel. This is extremely bullish in my opinion for RUM.
It will negate the downtrend and give a sign that we may now be starting an uptrend in RUM, marking a bottom as well.
VOlume looks great with an increase.
Our MACD indicator is also giving signs of an Uptrend. With a bull cross ABOVE the 0 lvl indicating great opportunity as long as we continue this MACD trend.
Target 1 is around the $10.00
Target 2 is around $12.00

3 MACD strategy creation...I am looking to create a strategy but I need help please. I've been using 3 MACDs.
- MACD 1 = 1 Day
- MACD 2 = 4 Hour
- MACD 3 = 1 Hour
The strategy is that I am using the 1 Day and the 4 Hour as trend indicators. Both of them have to be rising, then the long is taken when the 1 Hour MACD crosses above Zero at candle close. If the 'trend' MACDs are rising and the 1 Hour rises crossing above zero, I take the Long.
So far I'm doing this manually. I've been watching videos and reading pine script examples but I just don't get it. I've tried AI to help write it. No luck. Is this simple enough that someone could create this / write this for me/us?
Thanks!!!
- Scott

Shopify Macro Pattern Bullish Until Proven OtherwiseHi Guys! This is a Macro Technical Analysis on Shopify (SHOP) on the 1 Week Timeframe.
Its to add to my previous analysis while keeping it brief and concise.
Recently we Broke through and confirmed BELOW both the Uptrend Channel and the 21 EMA.
Normally this spells TROUBLE, especially if we confirm BELOW 21 EMA, as this moving average normally holds SUPPORT through BULLTRENDS.
Even more so that the MACD has crossed BEARISH as well.
However digging deeper, its seen that the channel and 21 EMA break was followed by DECLINING VOLUME.
Normally, for Trend Reversals and for the direction of a trend to actually go that way you need a spike in VOLUME.
(Watch VOLUME in the coming weeks. Can give us hints to what will come next.)
Comparing our current move to previous moves, look to "Similar Pattern". It may be probable that we just move side ways before continuing our UPTREND.
Notice how to the T, our current move follows the previous example. The 21 EMA is also flattening out, indicating this sideways movement.
Another likely scenario, if volume picks up can be a test of the 50 SMA (Green moving average).
BUT provided this Weeks candle closes ABOVE we are testing support. So if we can stay ABOVE this, 50 SMA is less Probable. So pay attention to this weeks candle close and for CONFIRMATION.
Also NOTE we have had a BULLISH CROSS of the 21 EMA above the 50 SMA.
Along with how previous history BUllish move played out.
This makes me think we are in the Early phases of a BULL run in Shopify.
This is NOT a DEFINITE, Sure thing but we may be mirroring the "Similar Pattern".
But always remember that things that happened before does not have to happen again.
I think other than Volume, another MAJOR thing to watch is the MACD.
Particularly, the main focus should be staying ABOVE the 0 level.
Going BELOW 0 level, may indicate further price DECLINES.
So watch how the Histogram bars shape up, we want smaller RED bars that change to a lighter RED color. Eventually would like to see GREEN bars in the coming weeks. That would give confidence that BULLISH momentum is coming back to Shopify.
Take a look at how the MACD shaped up during the "Similar Pattern". If we stay ABOVE 0 level, all is good.
Keep that in the back of the mind as you follow the MACD.
RSI also gives some clues. The area between the RED & BLACK Horizontal lines, coincides with being BELOW 21 EMA.
If we are below the RED line, normally its a good area to add to your position during a BULL run.
The warning sign is if the RSI drops towards and BELOW the BLACK line, that would lead to further PRICE Declines.
Using both the MACD and RSI in combination will help remove false signals. If you see that the histograms are turning light red, to light green and the RSI curved back up towards and ideally above RED line. This would likely push Price back ABOVE 21 EMA, and continue our BULL Run.
I think this week, its important to stay ABOVE the SUPPORT line. Staying above may bring in more confidence.
__________________________________________________________________________________
Thank you for taking the time to read my analysis. Hope it helped keep you informed. Please do support my ideas by boosting, following me and commenting. Thanks again.
Stay tuned for more updates on SHOP in the near future.
If you have any questions, do reach out. Thank you again.
DISCLAIMER: This is not financial advice, i am not a financial advisor. The thoughts expressed in the posts are my opinion and for educational purposes. Do not use my ideas for the basis of your trading strategy, make sure to work out your own strategy and when trading always spend majority of your time on risk management strategy.

Dogeusdt , Target 🐕🎯 Target , 🎯 69 , then 74 . Then 83
Based on Fibonacci and price action and dealing with the formed triangle, If it can pass the sensitive level of 74, it can go up to 79 and even higher , In the lower time frame, the flag pattern can also be seen, so the doge is prone to rise. , but I think it will have a collision after the resistance level and it will even go down to 58 and then reach a unique peak,It may never see level 58 ,, the fluctuations in Doge are very high,🐕 and you have to be very careful.

Advanced Micro Device Can we bounce from 21 Weekly EMA?Hi Guys! This is a Technical Analysis on Advanced Micro Device (AMD) on the 1 Week Timeframe.
Previously i posted a chart on the Daily Timeframe, mentioning of a potential breakout to the upside. But it was short lived as a fakeout, and we are down 7ish% since then.
To get an understanding of what went wrong, i decided to analyze the Weekly timeframe to get a bigger picture.
As you can see:
We have closed BELOW the SUPPORT line of the triangle.
We have also closed below this short term RED Horizontal support line.
And we are now Testing SUPPORT on the 21 Weekly EMA.
This is a Major development in my opinion.
21 EMA is used to determine trend:
->If its ABOVE = BULLISH
->If its BELOW = BEARISH
Whenever we are ABOVE the 21 EMA, its important for the BULLISH trend to have price action test SUPPORT on the EMA, every now and then.
For the BULLISH Trend to continue, we need CONFIRMATION that the 21 EMA indeed acted as SUPPORT.
But there is also the case, of the 21 EMA not being able to maintain SUPPORT.
So whats more likely in our current situation?
In my Opinion, its becoming more likely or probable that we BREAK BELOW 21 EMA.
For me and for more evidence i like to use INDICATORS.
Ive highlighted some Scenarios that mirror our current developments in the 3 indicators ive added.
Notice the Differences between how far we drop under the 21 EMA and the variations found in the indicators.
For Price action to weaken and drop below 21 EMA, 3 things need to happen:
1. RSI -> Showing the Orange line break support and move BELOW the Black line. The longer stay below and continue lower, more likely for price declines.
2. MACD -> BEAR CROSS, (Blue line below Orange line) and the appearance of Red Histogram.
3. STOCH RSI -> Below the 20 level. The longer we stay below this level, more likely for price decline
We are currently in this SCENARIO, highlighted by BLACK BOX.
So now to determine exactly how far BELOW we go, If we do break SUPPORT.
To gauge at that, we look LEFT and we look at the specific changes/ differences in the indicators.
For LARGER PRICE DECLINES like in Scenario #3 and #4
-> MACD Histogram Bars were LARGE
-> MACD Blue/Orange lines moved BELOW 0 level
-> STOCH RSI for #3 continued for about 133 days (longest compared to other scenarios).
-> RSI Orange line stayed below Black line for extended period
Now notice #1 and #2
-> The indicators didnt show extreme variations as seen in #3 and #4
-> Scenario #2 Price action was below 21 EMA for a decent amount of time but it was consolidating, rather than having a major decline.
-> Though the RSI Orange line was below the Black for extended time,
-> the STOCH RSI was at oversold area for 119 days,
-> the MACD Orange/Blue line NOT dose diving BELOW 0 level, helped price action maintain a range before moving back over 21 EMA.
We have to keep in mind though that history DOES NOT have to repeat and that a new scenario can be possible
BUT Main thing to watch is the size of the histograms of the MACD and whether or not we stay ABOVE the 0 level, in my opinion.
A level to look at is the SUPPORT line labeled "MAJOR SUPPORT".
IF we do close BELOW 21 EMA, it becomes more likely we test this line.
________________________________________________________________________________
Thank you for taking the time to read my analysis. Hope it helped keep you informed. Please do support my ideas by boosting, following me and commenting. Thanks again.
Stay tuned for more updates on AMD in the near future.
If you have any questions, do reach out. Thank you again.
DISCLAIMER: This is not financial advice, i am not a financial advisor. The thoughts expressed in the posts are my opinion and for educational purposes. Do not use my ideas for the basis of your trading strategy, make sure to work out your own strategy and when trading always spend majority of your time on risk management strategy.

btc going to drop box 12.6k - 9kthe hidden bearish divergence is a signal that there will be a downtrend continuation. daily negative divergence is a confirmation that uptrend is finished. price dropping below the 200ma of weekly is a sign price is moving towards the downside. a close below 23.3k the daily 200ma will confirm price will drop toward the previous low of 15.5k. most likely this 15.5k low will not hold and we will create a new lower low.
a new lower low in price and a higher and high in oscillators, be it monthly chart, weekly chart and daily chart. this will give us a signal the start of real bullrun.. key level to note 23,3k 15.5k, 12.6k and 8.9k

AUS200Hello Traders,
I hope you are all doing well.
The AUS200 has broken resistance on the 4 HR. Question is will price continue or is this a fake out?
The MACD signal is overbought, so I would wait for price to retest resistance area and see some bullish momentum candlesticks.
My advice wait and have patience to see what the price will do.
What are your thoughts?
Have a great trading day

ZEUS Bullish MACD Setup - High Accuracy of Winning TradesOur MACD Setup is created to reveal winning entry points for a trade with high accuracy.
In our MACD Setup we combine multiple conditions to recognize only strong entry points.
Multiple factors need to be met in confluence:
1. Recognize the Trend = Bullish / Bearish Trend (50 EMA is Above / Below 200 EMA)
2. There is a MACD Cross = Bullish / Bearish MACD Cross (MACD Cross is Below / Above Zero Horizontal Line)
3. Avoid False Signals in a Sideways Markets = MACD Cross far from horizontal zero “0” line
4. Filter only Strong Trend Situations = Candle Close above/below 200 EMA
5. Avoid Extreme Values in RSI = check if there is way to go before we get oversold/overbought
6. Our Algorithm Filters Signals in Side Trend and Low Volume Markets
Let´s explain the conditions step by step
1. Recognize the Trend
Exponential Moving Average (EMA) is one of the most effective trend identification indicator. Traders like it because of it its simplicity.
EMA is usually used in combination between 200 days (as a slow indicator) and 50 days (as fast indicator of the trend).
Bullish Trend = EMA 50 is Above EMA 200
Bearish Trend = EMA 50 is Below EMA 200
2. There is a MACD Cross
After we recognized the Trend (Bullish Trend in our case) we would like to trade with the trend so we are looking for Bullish MACD Cross.
Bullish MACD Cross is Below Zero Horizontal Line
3. Avoid False Signals in a Sideways Markets
So we found Bullish MACD Cross and now we want to be sure that the Cross far away from the Zero Horizontal Line.
Our algorithm filters crosses and shows only signals with decent distance form Zero Horizontal Line.
4. Filter only Strong Trend Situations
Once we have met the first three criteria (Bullish Trend and Bullish MACD Cross far from Zero Horizontal Line) we need confirmation that the market is still strong and is moving forward in an uptrend.
So we look at price action and there need to be Candle Close Above EMA 200 . Closing about EMA 200 indicates continuation of the trend.
5. Avoid Extreme Values in RSI
The other condition is based on RSI and we are looking only for situations where RSI is not overheated so there is a way for trend continuations.
In our case RSI was in the middle values so we can expect market to continue its uptrend.
6. Our Algorithm Filters Signals in Side Trend and Low Volume Markets
We have developed our own Algorithm which filters signals in low volume markets and side trend.

MACD: Everything You Need To Know!The MACD indicator consists of three parts: the MACD line, the signal line, and the histogram. The MACD line is calculated by subtracting the 26-period exponential moving average (EMA) from the 12-period EMA. The signal line is a 9-period EMA of the MACD line, and the histogram represents the difference between the MACD line and the signal line.
Let's break this down a little further. The MACD line is a measure of the difference between the 12-period and 26-period EMAs. When the 12-period EMA is above the 26-period EMA, the MACD line will be positive. When the 12-period EMA is below the 26-period EMA, the MACD line will be negative.
When the MACD line crosses above the signal line, it's considered a bullish signal. This indicates that the trend is likely to continue upward. Conversely, when the MACD line crosses below the signal line, it's considered a bearish signal, indicating that the trend is likely to continue downward.
One of the most popular ways to use the MACD indicator is by looking for crossovers between the MACD line and the signal line. When the MACD line crosses above the signal line, it's considered a bullish signal, indicating that the trend is likely to continue upward. Conversely, when the MACD line crosses below the signal line, it's considered a bearish signal, indicating that the trend is likely to continue downward.
But using MACD isn't just about looking for crossovers. There are several other ways to use the indicator to make informed trading decisions. For example, you can use the MACD histogram to identify divergences between price and the MACD indicator, which can signal a potential trend reversal.

SCB | Wave Projection | ABC Target Bullish Pennant +22%Price action and chart pattern trading:
> The price during last few weeks squeezed just under EMA200D with a series of bullish candlestick pattern
> A possible ABC uptrend wave with bullish pennant pattern target +22% at TP3 1.618 fibonanci extension.
> Support @ S1 -7% and S2 -10% downside
> Risk reward ratio: 2:1
> MACD squeezed momentum under the baseline
Always trade with affordable risk and respect your stoploss
