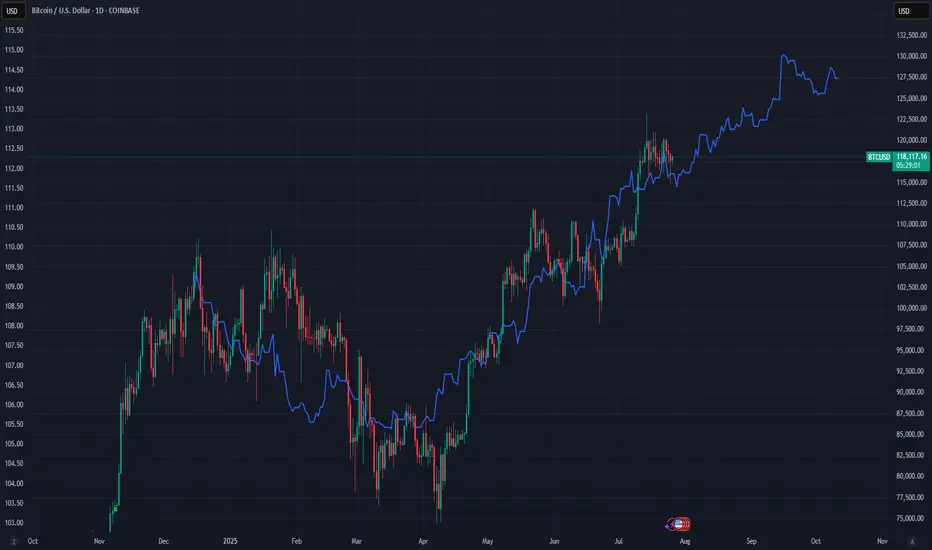
Bitcoin vs Global M2: Can Liquidity Predict the future?This chart compares Bitcoin’s price (daily) with a Global M2 indicator that includes the monetary supply of major economies like the U.S., Eurozone, China, and Japan.
It’s not a perfect global measure — but it gives us a reliable macro signal of what global liquidity is doing.
And when it comes to Bitcoin, liquidity is everything.
Why this matters:
Bitcoin is often seen as volatile or unpredictable. But when we zoom out and overlay it with liquidity flows (like M2), a powerful pattern emerges:
Bitcoin tends to follow global M2 with a ~10-week lag.
When M2 rises, Bitcoin often rallies weeks later. When M2 contracts, Bitcoin loses momentum.
This makes M2 a powerful leading indicator — not for predicting exact price levels, but for catching the direction of trend and regime shifts.
What this chart tells us:
M2 leads, Bitcoin follows.
The curves won’t align perfectly — but the macro structure is there.
Big expansions in M2 create a friendlier environment for risk assets like BTC.
This is the same logic used by macro strategists like Raoul Pal: liquidity drives everything.
Important disclaimer:
This doesn’t mean M2 tells you where price will be on a specific date. But it can help identify turning points — and confirm whether we’re in a reflationary vs contractionary environment.
Think of it as a weather forecast, not a GPS pin.
In other words:
This chart doesn't show the price. It shows the future.
Macro
Bitcoin Bullish Structure Holds: Focus on Support Entries & Brea__________________________________________________________________________________
Technical Overview – Summary Points
__________________________________________________________________________________
Momentum: Uptrend synchronization on all timeframes (MTFTI Strong Up). Risk On / Risk Off Indicator: strong buy on larger TF, neutral intraday.
Supports/resistances: Main HTF supports well below current price (115,736–117,000, 111,980). Key resistances to break: 120,998.7 and 122,318.
Volumes: Normal to moderate, no climax, no distribution detected.
Multi-TF behaviour: No behavioural excess, no sell signal, intraday phases are consolidative just below resistance, which is normal.
__________________________________________________________________________________
Strategic Summary
__________________________________________________________________________________
Overall bias: Strong bullish, no end-of-trend alert. Buying retracement towards the Pivot Lows is preferred.
Opportunities: Entries on dips to 115,700–117,000 (2H/4H); breakout above 120,250/122,300.
Risk zones: Return below 115,700 or 111,980 = structural alert. Increased vigilance for macro releases (ECB/PMI/Jobless Claims).
Macro drivers: Fed in focus (no move expected), volatility risk around July 29–30 (FOMC).
Action plan: Entry on retracement, dynamic management. Stop-loss under 115,736 then 111,980. Partial exits on excess or confirmed breakout.
__________________________________________________________________________________
Multi-Timeframe Analysis
__________________________________________________________________________________
1D: Resistances 122,318, 120,998.7; supports 115,736.9, 105,100.2. Risk On / Risk Off Indicator: strong buy, all synchronized bullish, no exhaustion. Daily bias: robust uptrend.
12H/6H/4H: Bullish confluence. Strong momentum, stable volume, validated supports. No ISPD excess, sectoral strength intact.
2H/1H: Consolidation below resistance; healthy structure. Supports to be favored for swing/intraday positioning. Minor intraday hesitation, no reversal.
30min/15min: Behavioural neutrality, lateral movement. Volume normal to mildly elevated, no overheating. Structural risk absent.
Additional indicators:
Risk On / Risk Off Indicator: Strong buy up to 2H; neutral on short TF.
ISPD DIV: Neutral, healthy market, no excess detected.
Volume: No climax or distribution, multi-TF structural support.
Cross-timeframe synthesis: Multi-timeframe bullish alignment, no structural weakness. Opportunities on retracement, breakout plays above all-time highs.
__________________________________________________________________________________
Synthesis & Strategic Bias
__________________________________________________________________________________
BTC trend and momentum remain aligned, sector leadership (Risk On / Risk Off Indicator) intact.
Strong HTF support, major resistances must break for extension.
External risk: macroeconomic catalysts (Fed, ECB, US PMI).
Premium opportunities on dips to supports, dynamic management essential around macro events.
Final bias: as long as supports and indicator alignment hold, bull run continues. Partial exit at resistance; stops below validated pivots.
USD/JPY: A Bullish Thesis for Trend ContinuationThis analysis outlines a data-driven, bullish thesis for USD/JPY, identifying a strategic long entry within an established market trend. The setup is supported by a combination of fundamental catalysts and a clear technical structure.
📰 The Fundamental Picture
The primary driver for this trade will be the high-impact US economic data scheduled for release. This release is expected to inject significant volatility into the market. Fundamentally, this trade is a play on the deep policy differences between the US Federal Reserve and the Bank of Japan. While the Fed's future steps are a topic of debate, the Bank of Japan's policy remains one of the most accommodative in the world, creating a long-term headwind for the Japanese Yen. This dynamic provides a strong fundamental basis for relative US Dollar strength against the Yen.
📊 The Technical Structure
Chart analysis reveals that USD/JPY is in a confirmed and healthy uptrend. The current price action indicates a constructive pullback, presenting a strategic opportunity to join the dominant trend at a favorable price. The proposed entry point is positioned at a key technical level that offers a low-risk entry. Technical indicators support the continuation of the trend, suggesting that momentum remains with the bulls.
✅ The Trade Plan
This trade is structured with a clear and favorable risk-to-reward profile, aiming to capitalize on the established trend.
👉 Entry: 146.343
⛔️ Stop Loss: 145.233
🎯 Take Profit: 148.560
⚖️ Risk/Reward Ratio: 1:2

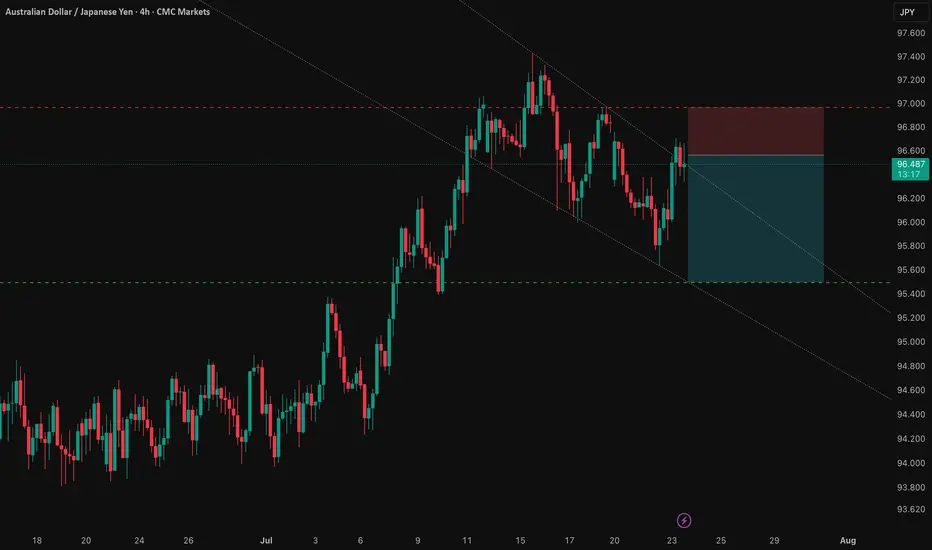
AUD/JPY: Capitalizing on the RBA-BoJ Monetary Policy GapThis analysis outlines a compelling short opportunity in AUD/JPY, driven by a powerful confluence of fundamental and technical factors. The trade is strategically positioned ahead of a key catalyst that could unlock significant downside potential.
1️⃣ The Core Thesis: A Clear Policy Divergence
The primary driver behind this trade is the stark and widening gap in monetary policy between the Reserve Bank of Australia (RBA) and the Bank of Japan (BoJ). The RBA is signaling a clear dovish pivot amid a weakening labor market, making an interest rate cut imminent. Conversely, the BoJ is in a tightening phase, creating a fundamental headwind for the AUD relative to the JPY. This divergence underpins the strategic bearish bias.
2️⃣ The Confirmation: Technical Alignment
This fundamental view is supported by a clear technical picture. The pair is in a well-defined downtrend and is currently testing a critical support level. This alignment of fundamental and technical factors presents a clear short opportunity, with the entry positioned for a breakdown below this key juncture.
3️⃣ The Catalyst: The RBA Bulletin
The immediate catalyst for this trade is the upcoming RBA Bulletin on July 24, 2025. Any dovish language from the RBA concerning Australia's economic outlook will likely reinforce expectations for a rate cut and accelerate the downward move in AUD/JPY.
The Trade Setup ✅
Here is the recommended trade setup:
📉 Trade: SHORT AUD/JPY
👉 Entry: 96.56200
⛔️ Stop Loss: 96.96386
🎯 Take Profit: 95.49900
🧠 Risk/Reward Ratio: 2.65
This setup offers a compelling risk-reward profile, capitalizing on a clear and powerful macroeconomic theme. The trade is designed to perform should the expected catalyst confirm the underlying bearish fundamentals.
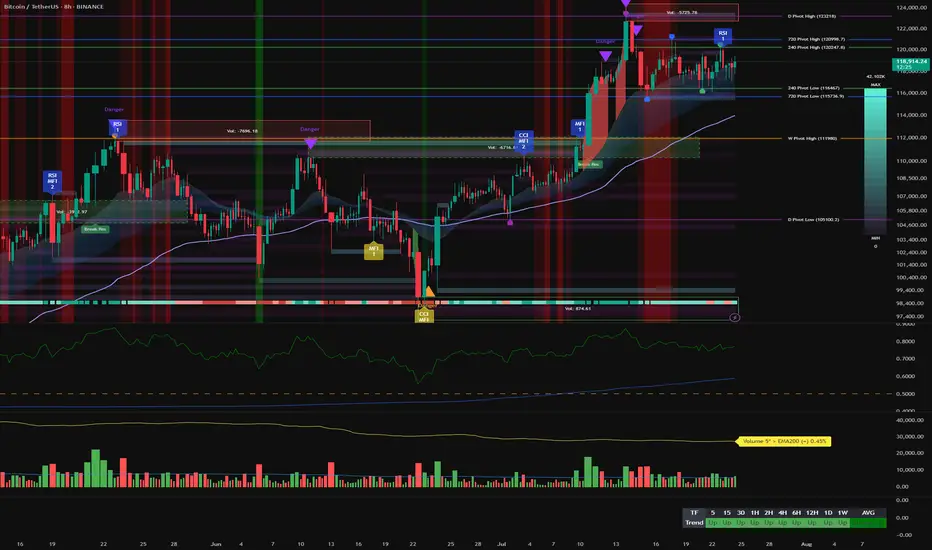
Bitcoin Bullish Momentum, Swing Setups on Support Pre-ECB__________________________________________________________________________________
Technical Overview – Summary Points
__________________________________________________________________________________
Strong bullish momentum confirmed on all timeframes >1H; structure Up.
Major supports: 105100, 111980, 115736; main resistance: 122318 (ATH).
Volumes normal at all timeframes except 30min (very high at lows, institutional absorption).
No behavioral anomaly signals (ISPD DIV neutral, Risk On / Risk Off Indicator = "STRONG BUY" everywhere except 15m/30m).
Multi-timeframe alignment, only 15m/30m in minor divergence (Down, no structural impact).
__________________________________________________________________________________
Strategic Summary
__________________________________________________________________________________
Bullish swing/mid-term bias confirmed: Optimal opportunities on pullbacks 117900–116467.
Risk/stop zone: below 115736 USDT (key multi-frame pivot).
Catalysts: ECB (24/07, volatility expected); strict monitoring post-announcement.
Plan: swing entries on pullback, strict risk management, reduce exposure before macro events.
__________________________________________________________________________________
Multi-Timeframe Analysis
__________________________________________________________________________________
Daily (1D) : Consolidation after ATH, strong supports (105100, 111980). Strong momentum, Risk On / Risk Off Indicator at "STRONG BUY," ISPD neutral. Normal volumes.
12H/6H : Price oscillating near upper pivots (115736, 116467). Buyers in control. "STRONG BUY" generalized.
4H/2H : Range 116467–119676, Up momentum. Swing setups/favorable to buyers on weakness.
1H : Full confirmation of the bullish bias. 116.5–117K area = key support for scalp/swing.
30min/15min : Minor short-term bearish divergence, increasing volumes, no structural warning. Possible scalping on bullish reaction 117800–116467.
Risk On / Risk Off Indicator = "STRONG BUY" on all timeframes (>1H). Only micro-risk: "Down" divergence on 15/30min, to be watched.
Main risk: $130K area (Glassnode major statistical resistance), possible capitulation below 115736 (swing invalidation).
Targets: 122–130k.
Macro: Reduce exposure before 24/07 (ECB), adjust stops if extreme volatility.
__________________________________________________________________________________
Fundamental & On-Chain Summary (Glassnode, July 22, 2025)
__________________________________________________________________________________
BTC in price discovery, all holder cohorts in profit (>95% STH).
Profit-taking rising but no climax detected; market is "breathing".
Major support: $110K; major resistance: $130K.
Attractive risk/reward outside euphoria zones. Stop advised <115736.
No immediate disruptive macro catalyst. Watch for volatility spikes at ECB decision (24/07).
__________________________________________________________________________________
Actionable Synthesis & Plan
__________________________________________________________________________________
"Swing long" favored on pullback 117900–116467 / stop below 115736.
Scalping weaknesses 117800–116467 on bullish reaction, monitor post-ECB confirmation.
Reduce leverage/exposure ahead of ECB.
R/R ratio >2 on bullish swing scenario; strict stop-loss.
Robust bullish context, valid technical structure. Active approach required short term: seize pullbacks, protect stops, adjust post macro-news.
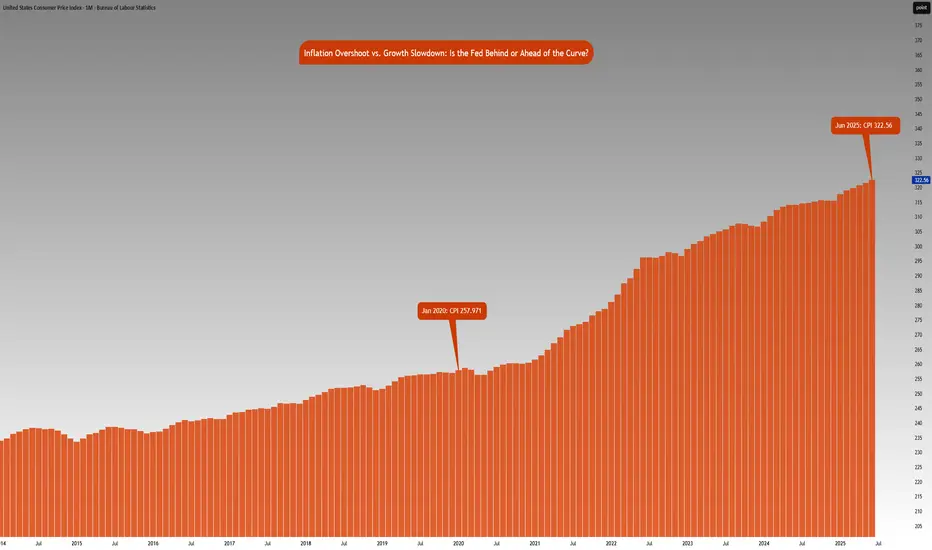
Inflation vs. Growth : Is the Fed Behind or Ahead of the Curve?CME_MINI:NQ1! CME_MINI:ES1! CME_MINI:MNQ1! CME_MINI:MES1! CBOT:ZN1!
Fed Policy recap:
There is an interesting and unusual theme to keep an eye on this week. The Fed is in a ‘blackout period’ until the FOMC meeting- this is a customary quiet period ahead of an FOMC policy meeting. Fed Chair Powell is scheduled to give a public talk on Tuesday. Although his address will be focused on the capital framework of the large banks, this appearance will be closely watched for any subtle signals on the FOMC policy stance.
Especially given that last week, Federal Reserve Governor Chris Waller made a speech, “The Case for Cutting Now” with a purpose as he stated to explain why the FOMC should reduce rate by 25 bps at the July 30th, 2025 meeting.
His stated reasons were:
1. Tariffs create one-off price level increases with transitory inflation effects, not sustained inflation momentum.
2. He argued that much of economic data points towards interest rates should be lowered to FOMC’s participants' median neutral rate, i.e, 3%.
3. His third stated reason notes that while the state of the labor market looks resilient on the surface, accounting for expected data revisions, private-sector payroll growth has peaked, with more data suggesting increased downside risks.
His speech further explains:
• Growth has decelerated sharply: Real GDP rose only ~1% annualized in 1H25, a significant slowdown from 2.8% in 2H24, and well below long-run potential.
• Consumer spending is weakening, with real PCE growth falling to ~1%, and June retail sales showing soft underlying momentum.
• Broader labor market indicators, including the Beige Book and JOLTS data, show declining labor demand and hiring caution, suggesting increasing downside risks to employment.
• Inflation is slightly above target (PCE ~2.5%) but driven primarily by temporary, one-off tariff effects. Core inflation ex-tariffs is likely near 2%, and expectations remain anchored.
• Current fed funds range (4.25%–4.50%) is well above neutral (3%), implying excessive restraint.
• With inflation risks subdued and macro conditions deteriorating, a preemptive rate cut now provides optionality and avoids falling behind the curve if the slowdown deepens. Further cuts may be warranted if trends persist.
• The tax bill contains pro-growth provisions, but its economic impact is expected to be minimal in 2025.
Source: Federal Reserve Speech, The Case for Cutting Now Governor Waller
Inflation Analysis:
Let’s compare this with what we have previously mentioned regarding inflation. CPI index stood at 257.971 points in January 2020. Projecting this at a 2% Fed target, June 2025 inflation should be around 287.655 points. However, June 2025 inflation is currently at 322.56 index points, 12.2% higher above 2% the inflation trend. Effectively, this means annualized inflation since January 2020 is roughly 4.15%.
The Fed is in a real dilemma whether cutting rates given the inflation trend in the last 5 years and risks to inflation outlook justify cutting rates.
Key Questions to ask
Markets are forward looking. Investors and participants want to know:
• How will the rates impact the cost of debt service? Currently the third largest government expenditure, over $1.03 trillion.
• Will the tariff rate offset the tax revenue losses by extending tax cuts?
• Is the fiscal path sustainable?
• What happens to the long end of the yield-curve?
• Will the Fed monetize the debt issuance imbalance?
• Is this simply Governor Waller positioning himself for the next appointment of Fed Chair when Fed Chair Powell’s term expires in May 2026?
It seems there is a huge conflict between longer term implications vs quick short term fixes that align with US administration objectives.
The Week ahead:
It is a relatively light economic calendar in the US. Flash PMI readings and housing data on the docket. The primary focus as it has been for most weeks since President Trump took office, will be on the developments in trade policy and any further comments on Fed and Chair Powell. The threat of renewed tariffs starting August 1st, is also key to monitor and whether these protectionist measures will force US’s trading partners to make further concessions to negotiate trade deals.
The earnings season is off to a good start with major US banks reporting higher EPS and revenue than expectations. This week investors will be looking at Q2 earnings reports from Alphabet, Meta, Microsoft from the Mag 7 and Tesla.
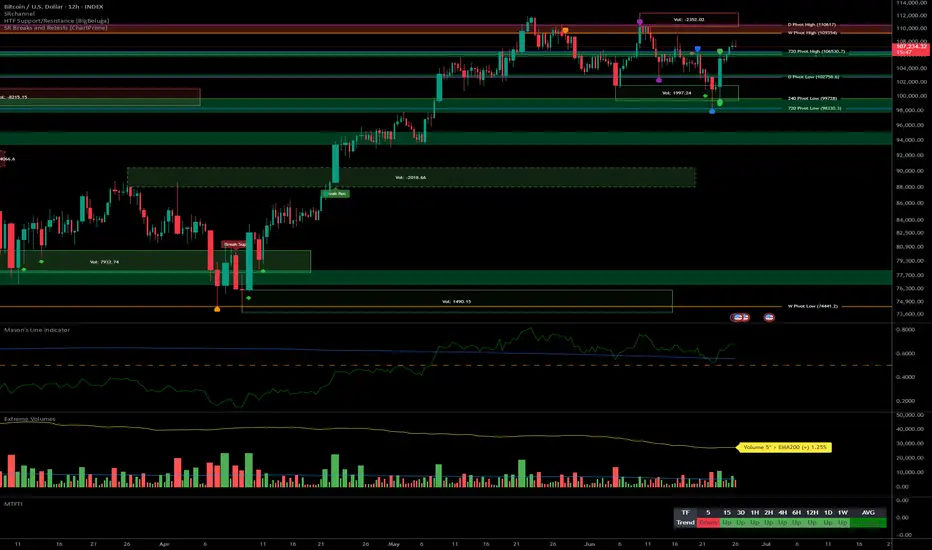
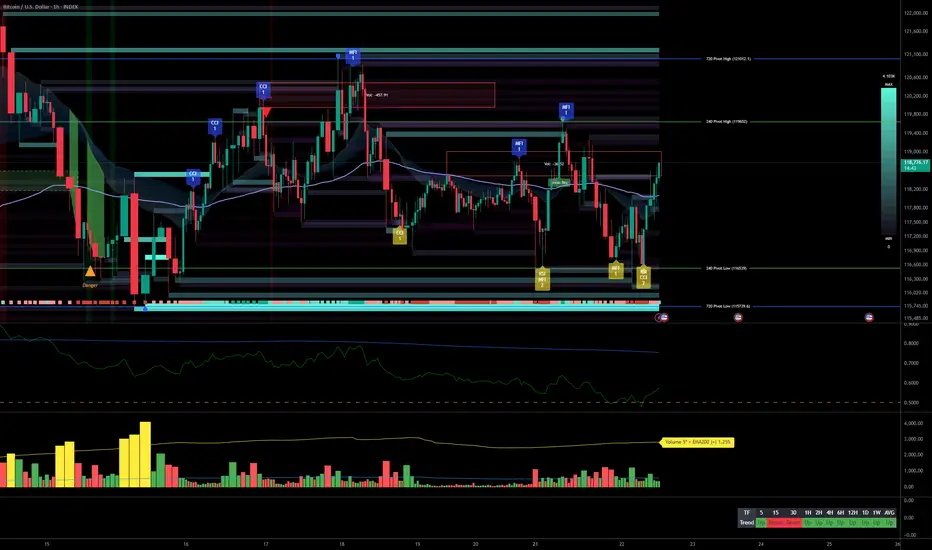
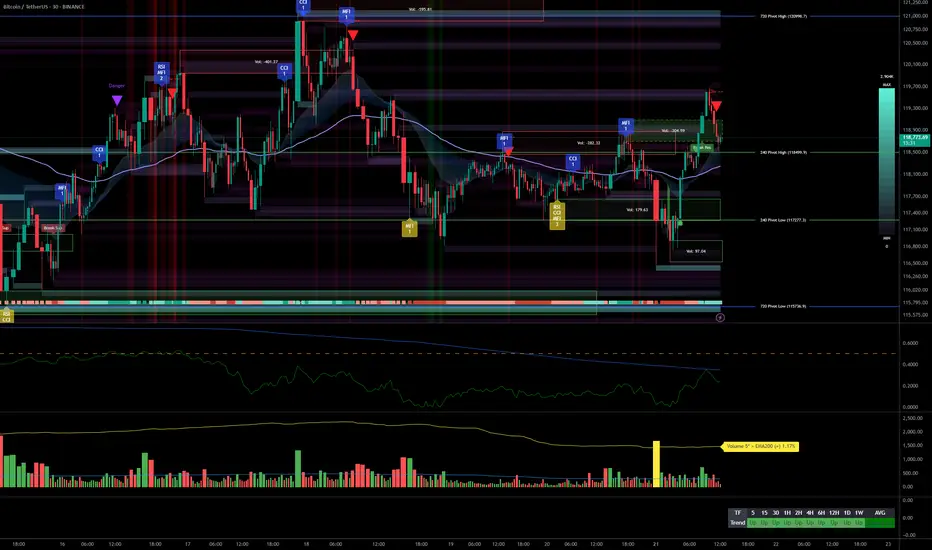
Bullish Multi-Timeframe Alignment, Macro Risks & Key Levels__________________________________________________________________________________
Technical Overview – Summary Points
__________________________________________________________________________________
Momentum: Strong bullish trend across all timeframes.
Major Supports: 115796/117277 (720/240 Pivot Low).
Key Resistances: 119000–123200 (240/D Pivot High), watch for potential extension or profit-taking.
Volume: Healthy participation, no marked anomalies.
Risk On / Risk Off Indicator: Strong sector momentum except 15min (neutral), risk appetite confirmed.
Multi-TF Behavior Synthesis: No "behavioral sell" warning, ISPD DIV neutral, no climax.
__________________________________________________________________________________
Strategic Summary
__________________________________________________________________________________
Global Bias: Clearly bullish, all timeframes aligned, no notable technical divergences.
Opportunities: Buy on pullback (HTF support) or on breakout/consolidation above 123200 with increasing bullish volume.
Risk Zones: Drop below 115796 invalidates scenario; watch for “sell” behavioral signals (ISPD red/extreme volumes) or persistent sector divergence.
Macro Catalysts: Next Fed meeting (July 21st), ongoing geopolitical tensions.
Action Plan: Closely monitor supports/resistances, strict stops below 115796, dynamic adjustment to upcoming macro volatility.
__________________________________________________________________________________
Multi-Timeframe Analysis
__________________________________________________________________________________
1D: Bullish breakout, leading tech/growth sector, stable volume.
12H: Bullish signal, price held above all key HTF pivots.
6H: Consolidation below key resistance 123218, no distribution, strength intact.
4H: Sideways just below resistance, controlled pause, possible push upwards.
2H: Stalling under resistance yet bullish momentum still present.
1H: Supports defended, rising volume on rebounds, no excess.
30min: Intraday momentum positive; no signs of reversal, strong indicator consensus.
15min: Testing pivots, slight momentum decline, neutral on Risk On / Risk Off Indicator.
__________________________________________________________________________________
Technical confluence: All timeframes aligned upward, strong sector momentum, controlled volumes, no behavioral excess. Watch for resolution near the 119000–123200 resistance zone (potential supply), and monitor for alert signals on behavioral/volume side. Macro: anticipate volatility around July 21 (Fed).
__________________________________________________________________________________
Macro & Decision Synthesis
__________________________________________________________________________________
News / Macro: Upcoming Fed meeting = caution period, expected volatility spike. Geopolitics: Middle East/Europe tensions, no Asian shock.
On-chain: BTC in price discovery, initial STH profit-taking, everyone in latent profit (interim top risk if overheated, reward up to $130k possible).
Actionable checklist:
Optimal entry: Pullback on 115796–117277 or strong breakout above 123200 with confirmed volume
Stop-loss: Below 115796 (major pivot); intraday swings below 117277
Imperative risk management, avoid leveraged trades ahead of macro event
__________________________________________________________________________________
Final Conclusion
__________________________________________________________________________________
Bitcoin is structurally bullish, supported by perfect multi-timeframe alignment, strong sector leadership (Risk On / Risk Off Indicator), and positive on-chain signals. However, proximity to historical resistances and looming volatility call for strict, active risk management. Targets: $123k/$130k; stops below 115796.
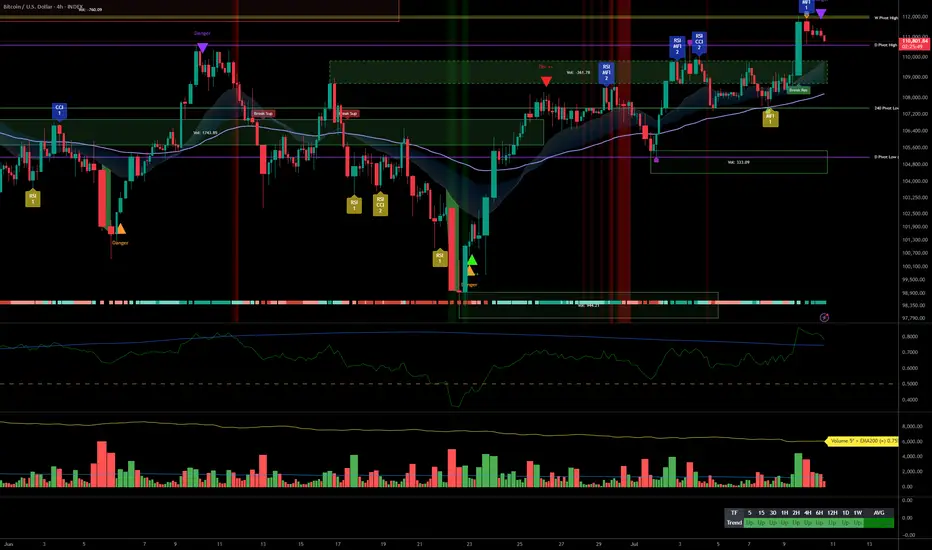
Bitcoin at 120,000: Decisive Breakout or Renewed Consolidation?__________________________________________________________________________________
Technical Overview – Summary Points
__________________________________________________________________________________
Momentum: Strongly bullish on H1 and above; healthy consolidation below ATH.
Supports/Resistances: 120,000 USDT (pivot resistance), 116,400–117,000 (major support), 104,000–110,000 (long-term support).
Volumes: Normal, no anomaly nor climax detected.
Risk On / Risk Off Indicator: Strong buy signal on all timeframes except very short term. Sectoral health confirmed.
Multi-timeframe: Short-term bearish divergence on 15/30min, but robust technical structure above H1-D1.
__________________________________________________________________________________
Strategic Summary
__________________________________________________________________________________
Global bias: Confirmed bullish across all timeframes; no major break detected.
Opportunities: Strategic buys between 116,400–117,000 (pullback); confirmed breakout above 120,000 (target 130,000).
Risk zones: Below 116,000 (potential correction to 112,000–104,000), false breakout at the top.
Macro catalysts: Monitor Fed (next FOMC July 29-30), volatility on risk assets, geopolitical tensions.
Action plan: Prioritize stop management, stay reactive ahead of macro events. Main scenario: buy confirmed pullback or validated breakout.
__________________________________________________________________________________
Multi-Timeframe Analysis
__________________________________________________________________________________
1D / 12H: Bullish structure intact but facing historical resistance (120k), strong supports in place (104–107k).
6H / 4H / 2H: Consolidation below resistance, no signs of exhaustion, tactical supports at 116,000–117,000.
1H / 30min / 15min: Weakness on shorter timeframes (sellers at top), confirmation of range polarization. No emotional excesses (ISPD DIV neutral), standard volumes.
Risk On / Risk Off Indicator: Strong buy except for very short-term fatigue.
Summary:
Multi-horizon bullish bias, technical and sectoral confluence for upside extension if clear breakout >120,000. Key support to hold at 116,400–117,000. Buy dips, ride breakout up to 130,000. Focus on risk management, flexibility advised as macro (Fed) nears.
__________________________________________________________________________________
Key macro events to watch
__________________________________________________________________________________
2025-07-18: Fed rate/volatility debate (Equity, Bonds, BTC).
2025-07-29: FOMC (potential pivot for risk assets).
__________________________________________________________________________________
Strategic decision & final summary
__________________________________________________________________________________
Main bias: Bullish, to be validated at key levels, favor buying dips/breakouts.
Risk management: Stop below 116,000, scale out progressively after 125k, reinforced protection ahead of FOMC.
Opportunities: Pullback 116,400–117,000 (RR >3); H4/D breakout >120,000 targeting 130,000 (RR >2).
Monitoring: Macro (Fed, geopolitics), dynamic management according to market response to news.
Conclusion:
A validated move above 120,000 projects target to 130,000 (next statistical/on-chain extension). Deep dips can be bought above 104,000. Do not loosen risk management as Fed date approaches.

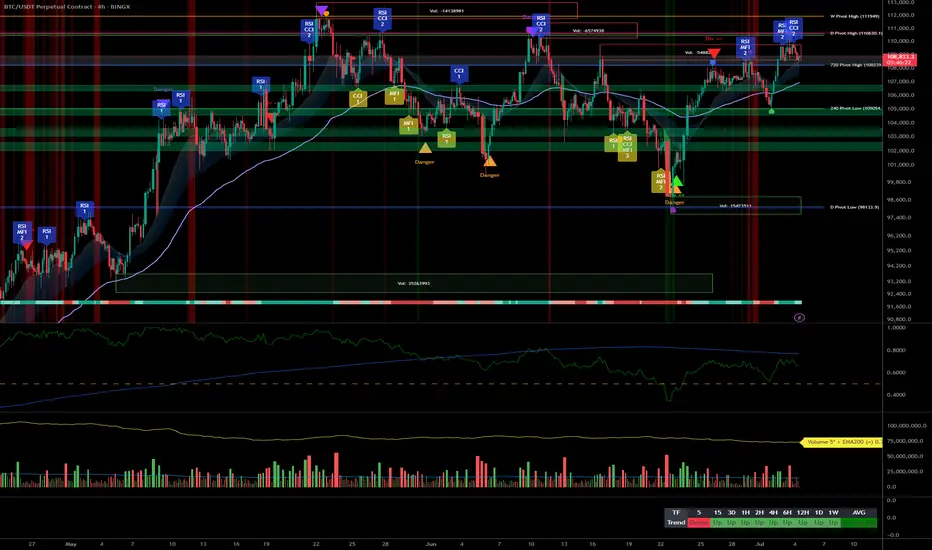
Bitcoin Swing Reinforcement, Strategic Stops Below 115k__________________________________________________________________________________
Technical Overview – Summary Points
__________________________________________________________________________________
Momentum : Strong bullish trend on all timeframes above 1h (MTFTI dark/gray, “Strong Up” confirmed).
Supports/Resistances :
Key supports: $104,000–$110,000 (HTF), $116,000–$118,000 (STF).
Strategic resistances: $120,000–$122,000 (HTF), ATH $125,000.
Volumes : No excess, healthy and regular flows.
Risk On / Risk Off Indicator : Strong BUY across all higher timeframes, US tech sector momentum is bullish.
ISPD DIV : Neutral across all TFs, no extreme behavioral signals.
Multi-TF behavior : Bullish confirmation down to 1H; neutral/profit-taking mood on 15min–5min.
__________________________________________________________________________________
Strategic Summary
__________________________________________________________________________________
Overall bias : Strong bullish as long as the $116,000 zone holds.
Opportunities : Swing entries on pullbacks $116,000–$118,000; first take-profits at $122,000–$125,000. Potential extension up to $130,000 if on-chain momentum persists.
Risk zones : Below $115,000 = invalidation, structural downside risk (swing closure recommended).
Macro catalysts : No imminent major macro event, structurally mild volatility. Geopolitical hand neutral for now.
Risk management : Mandatory stop $114,800–$115,000, current risk/reward >2:1 on the bounce zone.
Action plan : Buy on clean retracement above 116k–118k, actively track STH profit-taking, reactively adjust if major S/R clusters break.
__________________________________________________________________________________
Multi-Timeframe Analysis
__________________________________________________________________________________
1D : Supports 104k–110k, major resistance 120k–125k. Risk On / Risk Off Indicator STRONG BUY. ISPD DIV neutral, volumes regular. MTFTI Strong Up.
12H : S/R 117.5k–119.3k, strong support 115k–116k. Risk-on sectorial momentum active. Volumes unaltered, confirmed uptrend.
6H : Resistance 119.3k, support 116k. Still strong buy, healthy flows, technical uptrend confirmed. Bounce ops 116k–117k.
4H : Support 117.5k–118.2k. Resistance 120k–121k. Risk On / Risk Off Indicator only buy, general up. No abnormal volume.
2H : Support 118k/116k, resistance 120k. Sectorial momentum intact, uptrend solid, best scalping/retest at 118k.
1H : Support 118k, res. at 119.5k then 120k. Sectorial momentum strong, no volume/ISPD excess.
30min : Support 118k, resistance 119k/119.8k. Slight momentum drop, context healthy. Fast entries on rebounds.
15min : Support 118.2k, resistance 119.3k. Risk On / Risk Off Indicator neutral. MTFTI micro-volatile. Volumes steady.
__________________________________________________________________________________
Decision Synthesis
__________________________________________________________________________________
Confluences : Bullish alignment across HTFs, strong sector momentum, healthy volumes, no behavioral excess.
Divergences : Slight short-term fading on lower TFs. Adjustment signal, not a trend reversal.
On-chain : All holders in profit, early STH profit-taking but no structural top. Potential extension 122–130k$ before local exhaustion zone.
Risks : Drop below 115k would invalidate the swing dynamic. Geopolitical stress to be monitored, but little short-term transmission.
Strategy : Buyers to reinforce between 116k–118k, secure partials above 122k. Strict stop below 115k.
__________________________________________________________________________________

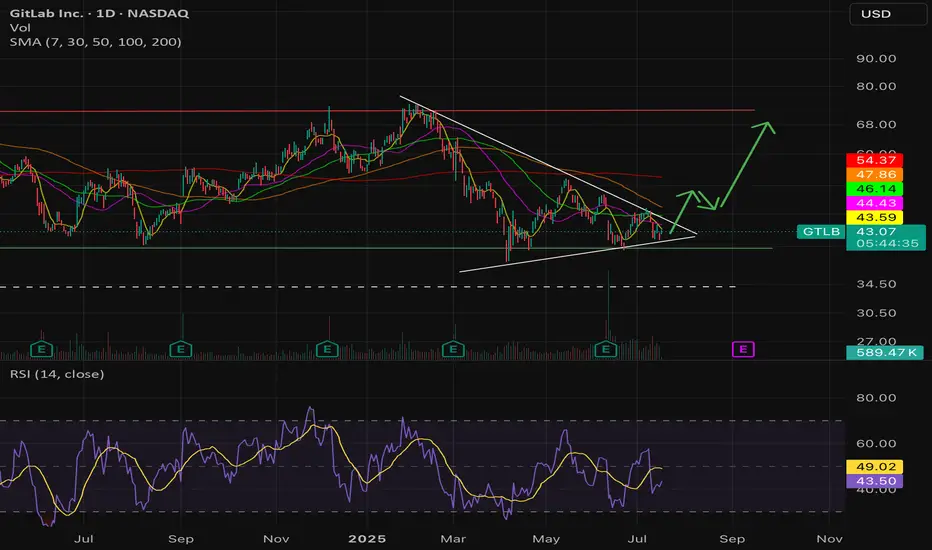
$GTLB undervalued, Potential 2X, AI assisted coding tailwind- NASDAQ:GTLB is likely one of the play for Agentic AI. When other companies like Windsurf, Codium, Cursor are in a goldrush. NASDAQ:GTLB is selling shovels.
- AI assisted coding is now a theme and is happening at a fast pace. I'm certain NASDAQ:GTLB will be a beneficiary of this trend.
- NASDAQ:GTLB has launched various AI based features on its platform which will get adoption and it will be easier for the company to upsell these features.
- P/S for NASDAQ:GTLB is depressed. If they even execute on their fiscal goals, re-rating should lift the stock up.
- NASDAQ:GTLB should be a 2X in less than 3 years in my opinion given secular shift and macro as a tailwind.
Fair value for NASDAQ:GTLB as of now is $68-72
Bullish momentum holding, accumulation zones in focus__________________________________________________________________________________
Technical Overview – Summary Points
➤ Strong bullish momentum across all timeframes.
➤ Key supports: 104–110k$ and 110–115k$; pivot resistance: 124k$.
➤ Normal volumes, no panic or exhaustion phases detected.
➤ The Risk On / Risk Off Indicator consistently supports the bullish trend, with minor short-term slowing.
➤ No behavioral alerts (ISPD DIV), multi-timeframe structure fully aligned.
__________________________________________________________________________________
Strategic Summary
➤ Structurally bullish bias as long as supports above 104–110k$ hold.
➤ Tactically seek long entries on retracements to 110–115k$ (preferred swing bias).
➤ Fast profit-taking zone above 124k$ or on loss of key support clusters.
➤ Macro environment neutral to slightly positive, no urgent negative catalysts.
➤ Action: prioritize long trades on pullback, strict stops below 104k$, reduce sizing before major news releases.
__________________________________________________________________________________
Multi-Timeframe Analysis
1D:
- Strong 124k$ resistance, major supports at 104.5k$ & 108–110k$ (technical and on-chain clusters).
- Risk On / Risk Off Indicator: strong buy, balanced volumes.
- Buy zone = pullback to 108–110k$; rapid profit-taking on break of 124k$ without macro confirmation.
12H:
- Distribution below 124k$ resistance, optimal support at 110–115k$.
- Risk On / Risk Off Indicator bullish, clear bullish confluence.
- Wait for confirmed break to extend; buy dips.
6H / 4H:
- Failed breakout at 124k$, solid supports at 110–115k$.
- Momentum intact, stable volumes, healthy structure.
- Dip accumulation recommended as long as supports hold.
2H / 1H:
- Active defense of 110–115k$ support and pivots at 115–118k$.
- Risk On / Risk Off Indicator very favorable (swing pullback entries).
- Stable volumes, no exuberance.
30min / 15min:
- Moderated momentum, micro-range below 120k$.
- Treat every dip as an opportunity to join the main trend.
Cross-summary: As long as >110k$ holds, each pullback is an accumulation opportunity. Only a persistent break below 104k$ invalidates the bias.
__________________________________________________________________________________
Fundamental & On-chain Analysis
Macro: US CPI above expectations, no Fed rate cut expected, neutral to risk-on environment. No immediate negative news, volatility under control.
Calendar: increase caution before key macro releases, reduce swing exposure ahead of FOMC/high-vol days.
On-chain: major accumulation supports 104–110k$; watch for loss of STH in profit momentum.
Strong coherence between technical and on-chain clusters, but remain watchful for euphoric tops >124–130k$.
__________________________________________________________________________________
Strategic conclusion and action plan
Trend: Bullish unless crash below 104k$.
Action: Prioritize buying pullbacks at 110–115k$, strict stops under key pivots.
Swing window possible up to 130k$ if no on-chain/macro overheating.
Increase prudence if break >124k$ occurs without macro/sector momentum.
As long as the multi-timeframe structure holds and on-chain support clusters are respected, every pullback to 110–115k$ should be seen as a buy opportunity. Key watch: breakouts above 124k$ without macro confirmation and on-chain STH/profit stress signals.
__________________________________________________________________________________

Bitcoin Key 116800 Support Tested, US CPI as Decisive Catalyst__________________________________________________________________________________
Technical Overview – Summary Points
➤ Bullish momentum maintained across all major timeframes (1D to 1H). Key supports held at 116800-117200. Very high volume on low timeframes, indicating distribution/recharging. Risk On / Risk Off Indicator shows Buy across major TFs, micro-buy opportunity signaled on 15min. No extreme behavioral signals, except short-term positive micro-signal.
__________________________________________________________________________________
Strategic Summary
➤ Cautious bullish swing bias as long as 116800-117200 holds. Monitor strong tech sector momentum (Risk On / Risk Off Indicator). Heightened risk zone if support breaks (downward targets: 111000/110500/107200). Main catalyst: US CPI release—active trading management advised before/after. Tactical approach necessary: stop below 116200, TP 119000/120000. Closely watch low timeframe volumes and ISP signals.
__________________________________________________________________________________
Multi-Timeframe Analysis
➤
1D: Bullish, multiple supports at 10510/107200/11050-11190, resistance at 123000/119000-120000. Strong Risk On / Risk Off Indicator acquisition, normal volumes, no behavioral overheating.
12H: Momentum intact, 116800-117200 key area. Volume normal, stable mature market, no emotional excess.
6H: Bullish retest validated on 116800, rising volume but no dramatic spikes, key moment for trend.
4H: Dynamic support at 116800, resistance 119000-120000. Uptrend, healthy as long as support holds.
2H: Very high volume amid consolidation/reloading, increased volatility around 116800.
1H: Still Up, but extreme volume, increased caution. Possible stop hunting.
30min: Slowdown, volume still very high, micro-correction or local exhaustion.
15min: Micro-correction but ISP buy triggered; potential short-term bounce.
Key alignments: All TFs 1D–1H Up, supports held. 30min/15min correction on volume excess.
Major confluence: 116800-117200 = absolute pivot: break = correction, bounce = further up.
Divergences: Extreme volume not confirmed by ISP, except 15min.
Technical zone of action: Bullish scenario confirmed if bounce on 116800; invalidation on breakdown.
__________________________________________________________________________________
Macro & Fundamental Analysis
➤ No major macro event in the very near term
➤ Sole catalyst ahead: US CPI release, watch for possible whipsaws
➤ Institutional flows (ETF AUM record highs); on-chain stability, visible accumulation
➤ Volatility tightly compressed, coiling for next breakout on impulsive move
➤ Geopolitical noise present but limited direct impact in short term
To watch: post-CPI reactions, low timeframe volumes, defense/break of 116800-117200 cluster, micro ISP 15min signal, volatility & ETF institutional flows.
__________________________________________________________________________________
Summary & Action Plan
➤ Preferred scenario: Cautious swing long if 116800-117200 support cluster holds, stop <116200, TP 119000-120000+
➤ Invalidation: Prolonged breakdown of 116800: exit, wait for signal resynchronization.
➤ Catalysts: US CPI, watch for whipsaws (<1h pre/post-release).
➤ Risk management: Avoid adding if extreme volumes persist without ISP buy on short TFs (30m/1H), close monitoring ahead of data.
➤ On-chain context: Record volatility compression—major move likely soon; spot supply clustered—expect amplified reactions.
__________________________________________________________________________________

Bitcoin facing breakout, active management recommended__________________________________________________________________________________
Technical Overview – Summary Points
Strong bullish momentum across all timeframes (MTFTI “Strong Up”).
Key supports: 110,483–111,949. Major resistances: 118,689–119,499.
Volumes normal to slightly elevated. No anomaly or climax.
Behaviour: early caution signals on ISPD DIV (4H–2H), sector “sell” trigger on the Risk On / Risk Off Indicator (15min).
__________________________________________________________________________________
Strategic Summary
Overall bullish bias on all timeframes. Structural uptrend confirmed, but early behavioural/sector divergence at short term.
Buy zones: pullback to 110,483–111,949. Stop/alert below 110,483 H4/H6 close.
Opportunities: tight trailing above 118,689 to capture extension. Partial take profit advised in upper range (118,689–119,499) if divergences persist.
Risks: geopolitical risk-off catalysts, start of selling extension, or loss of support.
Plan: active management required, avoid overexposure, plan for key break levels, readiness to exploit imminent breakout.
__________________________________________________________________________________
Multi-Timeframe Analysis
1D : Price above all pivots, strong momentum. Key resistance in play (119,499), supports at 110,483/105,054. Volumes normal, bullish alignment.
12H : Confluence of resistances (119,499–115,495), structure intact, buy opportunity on retrace. No major alert.
6H : Strong buying extension, pure momentum. No excess signals.
4H : First divergence (ISPD DIV “sell”). Consolidation on resistance, consider partial profit-taking.
2H : Bullish momentum but ISPD DIV “sell” and moderately high volumes. Localized euphoria risk.
1H : No excess, post-breakout consolidation.
30min : Extreme consolidation, decelerating volumes, possible fatigue.
15min : Sector “sell” trigger (Risk On / Risk Off Indicator “Sell”). Trend remains up, but caution is advised.
Multi-tf summary:
Bullish alignment across all horizons. Short-term behavioural caution, but trend remains unchallenged as long as above 110,483–111,949.
__________________________________________________________________________________
Synthesis & Strategic Bias
Multi-timeframe momentum confirmed, watch supports at 110,483–111,949.
Buy on valid retrace, take profit at highs if behaviour diverges.
Break below 110,483 (H4/H6 close) = invalidation signal.
Key triggers: geopolitical news, broken supports, selling spikes.
Base scenario: likely imminent directional breakout (volatility). Watch for spikes on major headlines.
__________________________________________________________________________________
Fundamentals and Macro News
Uncertain backdrop (Fed, US inflation, bonds & FX), no major macro trigger in 48h but latent volatility.
Crypto: Bitcoin stable, general accumulation, no violent distribution detected.
Geopolitics: rising tensions (Iran, Ukraine). Can prompt sharp risk-off if escalation occurs.
No major macroeconomic event scheduled (empty calendar).
__________________________________________________________________________________
On-chain Analysis
Accumulation phase for all holders, >19k BTC/month absorbed. Extreme volatility compression (coiling).
Realized & implied volatility is exceptionally low, setting up violent move.
ETF (IBIT BlackRock): record accumulation. Downside break could trigger psychological stress.
Baseline: technical & on-chain setup disfavors bears. Any exogenous shock accelerates volatility.
__________________________________________________________________________________
Strategic Recap & Action Plan
Bullish bias validated, risk of market fatigue on short-term signals.
Buy on controlled pullback, tight trailing at highs, partial profit-taking in 118,689–119,499 band.
Swing stop below 110,000 (H4); total invalidation if daily support fails.
Expect directional move + volatility on next impulse (8–48h).
__________________________________________________________________________________
Conclusion
BTC remains in a primary bullish trend, supported by on-chain accumulation and extreme structural compression. Only active management (profit, leverage, stops) optimizes R/R and prepares to respond to an imminent, directional volatility event. Stay proactive and plan!
__________________________________________________________________________________

DXY (USD Basket) - 3 Month - Short Squeeze In Play?Technicals:
The last 3-month candle closed above the major resistance that tends to hold according to historic levels going back to the year 1967.
Golden Cross is almost complete (50 MA crossing the 200 MA).
Fundamentals:
The dollar has only been more shorted once in history (2018), setting things up for a potential "Short Squeeze" and triggering a "Risk Off" scenario. Tends to hurt risk assets quite hard—for example, tech stocks, crypto, and other leverage plays.
A rise in the DXY could potentially trigger a "Short Squeeze" for foreign countries, companies, and investors that borrow in USD, creating "economic panic" in other countries that get their currency devalued relative to their obligations.
Countries that need USD to service their debt. With the current tariffs, the flow of dollars in the world will change. The question is: what will the effect look like in August when these tariffs start to go live? Like I mentioned before, other countries need the dollars in order to service their debt. If it gets more expensive for US consumers to import (caused by the tariffs), the exporting countries won’t get those dollars—setting it up for a buying cycle that could potentially drive the USD (DXY) higher, even to all-time highs.
Current narrative:
The narrative right now is that the USD will get "worthless," setting the stage to take more risk and use more leverage, maybe without even hedging. A surprise variable to this narrative could be devastating to the financial markets—not just in the US, but even to the world. IF/When this happens, everyone will hunt the USD once again, creating a new bullish narrative for the USD, and everyone will be forced to return to the reserve currency.
Nothing in this post should be considered financial advice. Always do your own research and analysis before investing.

BTC Multi-TF Analysis: Bull Bias Holds, All Eyes on Resistance__________________________________________________________________________________
Technical Overview – Summary Points
__________________________________________________________________________________
Momentum: Very strong bullish bias across all major timeframes. No selling signal detected; slight micro-pause on 15min.
Key Supports / Resistances: Immediate resistance at 111,000–112,500. Critical supports: 108,000–109,000, then 105,000. Any lasting break below 107,500 is a key alert.
Volume: Healthy, balanced volumes. Some moderate surges on 1H/2H, but no climax.
Risk On / Risk Off Indicator: Strong Buy across all TFs except 15min (partial pause).
Multi-TF behavior: Complete convergence. No sign of distribution. ISPD DIV neutral overall.
__________________________________________________________________________________
Strategic Summary
__________________________________________________________________________________
Dominant bias: Bullish, confirmed by both technical and on-chain context.
Opportunities: Add on retracements to major supports (108k–109k, potentially 105k). Target breakout >112.5k for extension or further swing adds.
Risk/Alert Zones: Breakdown <107.5k (especially with high volume/macro event). Congestion zone at 111–112.5k: monitor reactions and volumes closely.
Macro catalysts: FOMC, Jobless Claims, Bond Auction (see economic calendar). Adjust sizing before and after.
Action plan: Gradual buys on major supports; heightened monitoring pre-US announcements (avoid overexposure during high-volatility). Structural stop below 107.5k; for swing, <105k ideal.
__________________________________________________________________________________
Multi-Timeframe Analysis
__________________________________________________________________________________
1D: Structurally solid market above key supports. No divergence or selling signals. Resistances: 111,500–112,500. Main support: 105,050.
12H: Dominant buyer pressure. Key support at 107,500–108,000. No speculative excess.
6H: Marked accumulation. Multi-TF resistance at 111,000–111,500.
4H: All trends aligned; focus on resistance 111–112k.
2H: Ongoing momentum. Moderate volume. Watch 107,400–108,000 for dips.
1H: Reinforced bullish bias; no short-term weakness.
30min: Opportunities on any pullback to supports (110,400, 109,000).
15min: Micro-pause on sector momentum. Potential consolidation below 111k–111,500.
Risk On / Risk Off Indicator: Strong Buy on all TFs except 15min (neutral, no sell).
ISPD DIV: Neutral across the curve, no behavioral excess detected.
__________________________________________________________________________________
Cross Analysis & Executive Summary
__________________________________________________________________________________
Confluences: Major bullish bias. Risk On / Risk Off Indicator in Strong Buy (except 15min). Balanced volumes. ISPD DIV neutral.
Dissonances: Micro-pause on 15min momentum under resistance (possible very short-term consolidation).
Opportunities: Pullbacks to 108k–109k or even 105k, clear breakout above 112.5k.
Risks: Break below 107,500 (key alert), high volume+rejection under 111–112.5k (possible profit-taking).
__________________________________________________________________________________
Macro & On-chain Focus
__________________________________________________________________________________
Macro: Awaiting FOMC (late July), key US macro data (Jobless Claims, 30Y Bond Auction). Neutral to potentially high volatility environment around economic catalysts.
On-chain: Long-term holder supply at ATH. US ETF inflows positive. Healthy on-chain: little short-term top risk. Key on-chain threshold at 98.3k (Short-Term Holder Cost Basis).
Institutional: No panic, ongoing “disciplined accumulation”, no excess euphoria.
__________________________________________________________________________________
Operational Action Plan
__________________________________________________________________________________
Closely monitor 111–112.5k resistance: reactively adapt based on price/volume.
Gradual re-entries on major supports if no behavioral anomaly or excessive selling volume.
Structural stop <107.5k, swing invalidation <105k.
Swing opportunity window post-FOMC if dovish or calm.
Adjust exposure and risk management around key macro dates.
__________________________________________________________________________________
EUR/NZD – Macro Outlook & Why It’s a Conviction LongMacro Thesis:
EUR/NZD presents one of the clearest long opportunities this week, supported by a sharp divergence in macro fundamentals, a favorable positioning landscape, and confirmation across sentiment and structural models.
🔍 Key Drivers:
1. Macro Fundamentals (ENDO):
The euro area maintains a relatively stable inflationary outlook with moderate growth, while the ECB remains cautious but not overly dovish.
In contrast, New Zealand is showing consistent deflationary pressure – inflation data is softening, M2 growth is stagnant, and real activity (PMI, Retail Sales, NFP) continues to cool. This creates a clean fundamental divergence in favor of the euro.
2. COT Positioning:
There is no excessive long build-up on the EUR side, and NZD remains weak across institutional positioning metrics. This opens the door for further upside without the risk of crowded positioning.
3. Z-Score (Positioning Extremes):
Z-Score data highlights NZD as sitting at an extreme negative reading (Z_Long < –1.7), suggesting it is fundamentally oversold and under institutional pressure. EUR, by contrast, is neutral.
This imbalance further validates the long EUR/NZD setup, particularly from a flow and momentum continuation standpoint.
4. EXO Models (Score, RR_w, Interest Rate Bias):
The pair scores well in weekly RR analysis, supported by strong ENDO/EXO bias convergence. NZD continues to lose monetary support (dovish IR & Overnight trends), while EUR stays relatively neutral.
From a structural model perspective, the bias is clearly long.
5. Sentiment Environment:
The global risk-on tone continues, but it’s paired with relative softness in commodity currencies like NZD. That dynamic adds additional fuel to the long side of EUR/NZD, especially while EUR remains resilient and stable.
✅ Summary & Trading Plan:
Bias: Long EUR/NZD
Conviction Level: High (9/10 – multi-layer confirmation)
Holding Horizon: 1–3 weeks
Invalidation: Exit on reversal of NZD macro tone or shift to risk-off globally
Why This Pair?
EUR/NZD offers one of the clearest expressions of fundamental divergence in the current macro environment.
You have stable inflation and steady growth in Europe versus a weakening macro pulse in New Zealand.
There are no major positioning risks, sentiment supports the setup, and structurally the pair aligns with the broader market tone.
Clean macro. Clean structure. No crosswinds.

Bitcoin Analysis: Risk under 108k, aiming 111k+ in continuation__________________________________________________________________________________
Technical Overview – Summary Points
__________________________________________________________________________________
Momentum: Strong uptrend across all major timeframes (MTFTI “up”). Buyers remain in control; daily/4H/1H structure robust.
Key supports: 108,239.1 (720min Pivot, critical transversal support), 105,054.7 (240min Pivot), 99,581 (240min Pivot). Active defense seen on 108,239.1 at all timeframes.
Main resistances: 110,630.1 (1D), 110,483.1 (240min), 111,949 (W). The 110–111k area acts as the short-term ceiling.
Volume: Moderate activity, no spikes or climaxes, slight intensification noted on the 30min during key tests.
Risk On / Risk Off Indicator: “STRONG BUY” signal on all Tfs ≥30min, contributing to marked bullish momentum. Minor short-term divergence only on 15min.
Multi-TF behavior: ISPD DIV and Investor Satisfaction are neutral, no extreme behavioral stress; psychology is balanced, neither panic nor euphoria.
__________________________________________________________________________________
Strategic Summary
__________________________________________________________________________________
Overall bias: Bullish, synchronized multi-timeframes, dominant bullish liquidity.
Opportunities: Optimal long entries on validated pullback to 108,239.1, add on breakout of 110,630–111,949. Gradual partial take profit recommended in the 111k area.
Risk zones: Invalidation below 108,239.1 (confirmed H2 close), risk of further correction toward 105k then 99.5k; suggested swing stop under 108,000.
Macro catalysts: No major event, global markets stable. Geopolitical tensions monitored, low short-term impact.
Action plan: Prioritize “buy the dip” on pivots, active monitoring for any breakout/failure. Dynamic stop management, partial profit-taking on extension.
__________________________________________________________________________________
Multi-Timeframe Analysis
__________________________________________________________________________________
1D: Very strong daily structure, high momentum, intermediate supports near 98k/100.5k. Watch for major resistances at 108–111k.
12H/6H/4H: Ranging below 110–111k resistance, no fragility. Supports 108,239.1 and 105,054.7 holding, no selling pressure detected. Watch for breakout/impulse.
2H/1H: Buy zone if maintained >108,239.1, risk of sell-off below this pivot toward 105k. Price is ranging, momentum remains positive.
30min/15min: Consolidation on supports. 15min: temporary divergence on the Risk On / Risk Off Indicator but bullish structure intact unless a clean break below 108,239.1.
Risk On / Risk Off summaries: Dominant “strong buy” tone, synchronized momentum, only weak short-term divergence. No behavioral stress (ISPD DIV neutral everywhere).
__________________________________________________________________________________
Cross-analysis and recommendations
__________________________________________________________________________________
Momentum: Bullish environment sustained as long as >108,239.1. Continued upside bias if breakout above 110–111k is confirmed.
Risks: No major vulnerabilities detected. Very low probability of a local top, except in the case of exogenous macro shock.
Macro & On-chain: Stable newsflow, no distribution from HODLers or significant new inflows. Preferred strategy: swing trading in trend direction, tight stop under the main pivot.
__________________________________________________________________________________
Decision summary
__________________________________________________________________________________
Preferred scenario: Hold long >108,239.1, add on validated pullback, look for breakout with volume extension to 111k+.
Risk management: Stop under 108,000, partial profit-taking in the 110,630–111,949 area.
No immediate macro constraints: Use this calm window to ride the trend.
Monitoring: Resilience of the main support, any sudden geopolitical shocks.
BTC/USDT keeps a clear bullish bias, favoring swing or trend-following strategies as long as key pivots hold. Buy the dips remains optimal while technical structure holds; strict stop management is advised pending any “breakout fail”.
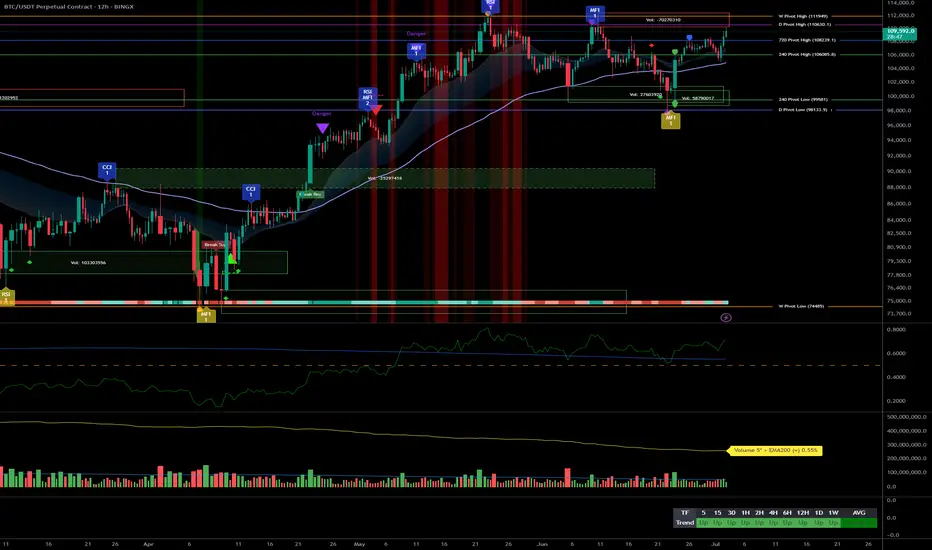
Bitcoin Robust Bullish Structure, Key Entries at 105k & 100k__________________________________________________________________________________
Technical Overview – Summary Points
__________________________________________________________________________________
Bullish momentum confirmed across all timeframes : Structure remains healthy, no behavioral anomalies detected.
Key supports: Main HTF pivot around $98,000–$100,000; first intermediate support zone at $105,000.
Major resistances: Critical area between $109,000 and $112,000, dense pivot and volume profile confluence.
Volumes: Normal to very high depending on TF, no speculative excess; gradual rise hints at possible expansion phase.
Risk On / Risk Off Indicator : Strong Buy from daily to 1H, shifting to neutral on shorter timeframes (30min–15min).
ISPD DIV/Mason's line: Predominantly neutral histogram, no overheat or capitulation detected.
Multi-timeframe behavior: Robust underlying structure, increased volatility but no massive selling stress.
__________________________________________________________________________________
Strategic Summary
__________________________________________________________________________________
Global bias: Bullish dominance as long as $98k–$100k holds.
Opportunity zones: Buy on pullback to $105k, swing confirm above $111k with volume/ISPD validation.
Risk / Invalidation: Stop loss below $98k; extra caution on macro/Fed events.
Macro catalysts: Fed/NFP-US (July 2–4), monitor behavior via ISPD DIV (blue to red).
Action plan: Structured and tactical long bias, “no trade” zone before major US releases, immediate stop on support break.
__________________________________________________________________________________
Multi-Timeframe Analysis
__________________________________________________________________________________
1D: Bullish momentum, no overheat. Pivot 98–100k = strategic fallback.
12H–6H: Signs remain bullish, no anomalies, intermediate supports at 105–107k.
4H–2H: Positive consolidation, rising volumes; possible accumulation on 105k dips.
1H–30min: Multiple resistances under 110–112k, very high volumes, maintain vigilance for sudden spikes.
15min: Extreme volatility, but no clear seller excess; watch for “trap” formation.
Risk On / Risk Off Indicator : Strong Buy on main timeframes, shifting to neutral/buy on 30min/15min (breather zone).
ISPD DIV/Mason's line: No buyer capitulation, overall neutral histogram.
Summary: Bullish cross-timeframe alignment, only macro events may trigger a break.
Key economic calendar
- 07/02: Powell speech – Potential added risk-on boost.
- 07/02: US tariff updates – Possible volatility.
- 07/04: NFP, ISM... High expected volatility.
Action : Heightened caution pre-announcements, validate through volume/ISPD.
On-chain: Dominant HODLing, no dumping, stable institutional volume.
Macro: Fed, inflation, geopolitics under watch.
Tactical: Spot any warning via ISPD or volume cluster.
__________________________________________________________________________________
Conclusion & risk management
__________________________________________________________________________________
Strong bullish bias as long as $98k–$100k holds .
Optimal buy on $105k/$100k dips, swing confirm on $111k break .
Outside of US events: strict tactical discipline required .
Absolute invalidation zone: break below $98k (HTF + STH cost-basis) .
Remain vigilant for ISPD red + volume spike / macro headlines .
__________________________________________________________________________________
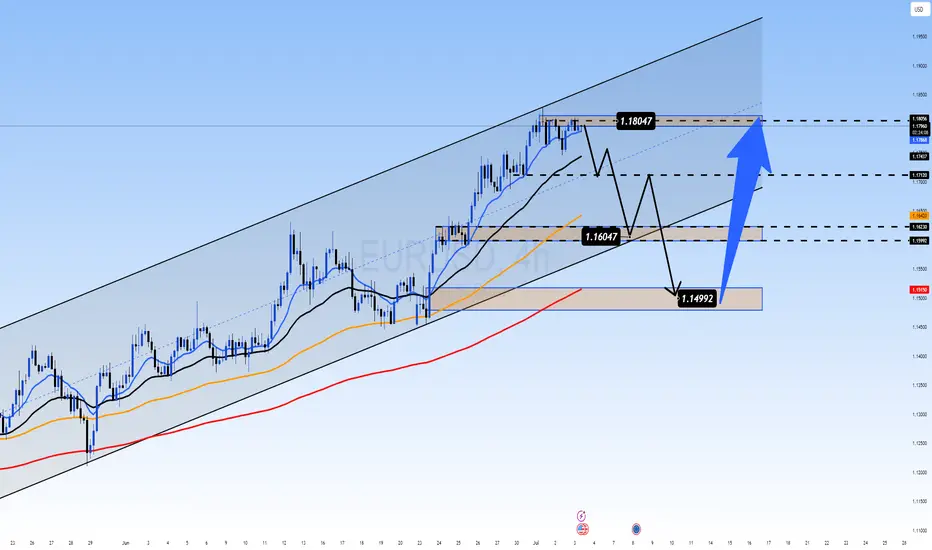
Nearing the Top: A Final Push or Smart Money Liquidity Trap?EUR/USD – Nearing the Top: A Final Push or Smart Money Liquidity Trap?
🌍 MACRO OUTLOOK – EURO CLIMBS WHILE USD TREADS ON UNCERTAIN POLITICAL GROUND:
EUR/USD is trading just below the 1.1700 mark as investors remain cautious about the US dollar's long-term credibility. Growing concerns over the Federal Reserve’s independence — should the “Trump 2.0” scenario unfold — have weighed heavily on USD sentiment across global markets.
Meanwhile, the Euro is gaining support thanks to a relatively hawkish tone from the European Central Bank (ECB). Policymakers appear reluctant to ease policy prematurely, which supports the Euro through expectations of prolonged higher interest rates.
However, with no major catalyst in play yet, traders are watching closely for mid-tier US data and any upcoming statements from ECB officials that might set the tone for the next directional breakout.
📊 TECHNICAL ANALYSIS – H4 TIMEFRAME:
Market Structure: EUR/USD remains in a well-defined ascending price channel. However, the pair is now testing the upper band near the 1.1804 resistance, a key liquidity zone where sellers previously stepped in.
EMA Alignment: Price is trading above the EMA 13/34/89/200 cluster — a strong sign of sustained bullish momentum.
Momentum Indicators:
RSI is hovering near 70 — potential overbought territory.
ADX remains above 25 — confirming trend strength but signaling caution at extended highs.
FVG (Fair Value Gap): A visible unfilled gap between 1.1600 and 1.1640 could act as a magnetic zone for price to revisit before the next impulse move.
🔹 Key Resistance: 1.1804 – 1.1835
🔹 Key Support: 1.1640 – 1.1600 (gap zone)
🔹 Major Demand Zone: 1.1499 – 1.1515
🎯 TRADE PLAN:
Scenario 1 – Buy the Dip (Primary Bias):
Entry: 1.1600 – 1.1640
Stop Loss: 1.1550
Targets: 1.1750 → 1.1800 → 1.1850
Scenario 2 – Buy Deep Pullback:
Entry: 1.1499 – 1.1515
Stop Loss: 1.1450
Targets: 1.1640 → 1.1700
Scenario 3 – Countertrend Sell at Key Resistance (High Risk):
Entry: 1.1804 – 1.1830
Stop Loss: 1.1860
Targets: 1.1720 → 1.1650
📌 Strategic Insight:
EUR/USD may be setting up for either a breakout continuation above 1.1800 or a temporary reversal to sweep liquidity from the lower zones. Momentum favors bulls, but chasing highs without confirmation is risky. Focus on clean retracements and volume-supported entries.
💬 If EUR/USD drops back into the 1.1600 zone, will you load up for another leg higher — or wait for confirmation of trend strength? Share your view in the comments!
GBPUSD – Pound Stumbles on Political Risk and NFP FearGBPUSD – Pound Stumbles on Political Risk and NFP Fear: Reversal or Breakdown?
🧭 MACRO SNAPSHOT – All Eyes on UK Politics and US Jobs
The British Pound came under renewed pressure on Wednesday, losing nearly 0.8% intraday, driven largely by escalating political uncertainty in the UK. Concerns over early elections, party leadership instability, and fiscal doubts have weighed on GBP sentiment.
Meanwhile, the US Dollar remains supported ahead of the June Non-Farm Payrolls (NFP) release. With recent labor data showing signs of weakness (ADP: -33K), today’s NFP is expected to shape short-term Fed expectations. A weak report may cap USD gains and provide a rebound opportunity for GBP – but risk is two-sided.
📊 TECHNICAL STRUCTURE – H4 Chart Insights:
Trend Channel: GBPUSD is still trading within an ascending channel, but recent rejection at 1.3769 raises caution.
EMA Signals: Price has broken below EMA 13 and 34, showing momentum loss. EMA 89 is the next possible support near 1.3570.
Fibonacci Zones:
0.382: 1.3543
0.5: 1.3466
0.618: 1.3390
Key Levels to Watch:
Resistance: 1.3681 – 1.3769
Support: 1.3570 – 1.3450 (golden pocket)
The price is likely to test the midline or lower bound of the channel before resuming a move higher, assuming macro tailwinds don’t intensify GBP selling.
🎯 TRADE PLAN:
🔵 Buy Setup (Reversal from Demand Zone):
Entry: 1.3450 – 1.3460
SL: 1.3390
TP: 1.3570 → 1.3680 → 1.3760
Bias: Counter-trend rebound from golden pocket & ascending trendline
🔴 Sell Setup (Short-term pullback):
Entry: 1.3680 – 1.3700
SL: 1.3765
TP: 1.3570 → 1.3450
Bias: Fade weak bullish momentum near prior high resistance
📌 Risk Context:
Today’s US NFP report is high-impact – expect volatility spikes and spread widening. UK political headlines could cause gaps or sharp reversals. Traders are advised to reduce size or wait for clear rejection/confirmation candles before entry.

Bitcoin Uptrend Momentum, Key Buy Zone at 106.3K–105.9K__________________________________________________________________________________
Technical Overview – Summary Points
__________________________________________________________________________________
Momentum : Uptrend confirmed across all timeframes ≥1H; no signs of exhaustion or overheating.
Major supports : 106,319, 99,581, 98,133 USD
Major resistances : 108,239, 108,685, 111,949 USD (ATH)
Volume : Normal on higher TFs, very high on 30min/15min (potential breakout or institutional shake-out).
Behavior : Risk On / Risk Off Indicator = Strong Buy from 1D to 1H, neutral on 15min; ISPD DIV neutral across all TFs (no extreme behaviors).
__________________________________________________________________________________
Strategic Summary
__________________________________________________________________________________
Bias : Bullish as long as 98,133 is held on daily closes; structural buying pressure confirmed.
Opportunities : Swing accumulation on pullbacks to 106,319–105,900; targeting 108,700 then 111,949 on breakouts.
Risk : Geopolitical catalyst or break below D Pivot Low 98,133.
Macro catalyst : No major events (Fed, CPI, NFP) over the next 48h. Watch Powell’s speech (2 July).
Action Plan : Long entry on pullback to 106,300–105,900, stop <105,900, targets at 108,700 then 111,900. Exit on daily close below 98,133.
__________________________________________________________________________________
Multi-Timeframe Analysis
__________________________________________________________________________________
1D – Daily : Strong uptrend; balanced volumes; supports at 98,134 / 99,581; resistance at 108,239–111,949.
12H/6H/4H : Positive confluence. Accumulate on any return to support; no behavioral excesses detected.
2H–1H : Rising volumes, no divergences; strong timing for entries on dips.
30min/15min : Very high volume (breakout/shake-out); structure remains bullish. 15min Risk On / Risk Off Indicator =Neutral → watch for short-term consolidation or traps but broader trend holds.
Clear bullish confluence on all TFs ≥1H, with no behavioral or macro warning.
Short-term risks on micro-TFs (extreme volume, possible shake-out).
Accumulation zone on 106,300–105,900 pullbacks, invalidation below 98,133.
__________________________________________________________________________________
Cross-Analysis & Strategic Synthesis
__________________________________________________________________________________
Trend : No reversal signals. All indicators (volume, price action, Risk On / Risk Off Indicator) point to trend continuation.
Macro & newsflow : Monetary status quo, no negative catalyst in the short term. Only open risk: geopolitical tensions, closely monitored.
On-chain & fund flows : Ongoing ETF inflows, stable capitals, strong HODL trend, SSR stable.
Risk management : Stop <105,900, hedge on geopolitical signals.
Summary:
All TFs ≥1H aligned in bullish cycle, corrections = structured long accumulation opportunities.
Key buy zone: 106,300 – 105,900; prudent stop <105,900; main targets 108,700 and ATH.
Closely monitor for Powell/Fed headlines.
__________________________________________________________________________________

Bitcoin Controlled consolidation above 106,480 Technical Overview – Summary Points
➤ BTC trades in the 1st quartile of its yearly range (100k – 111k).
➤ Stacked resistance zone: 108,239 to 110,603 USDT → potential seller exhaustion.
➤ Key support at 106,480; defensive cluster 102,626–99,581.
➤ Risk On / Risk Off Indicator = Strong Buy; ISPD Divergence = Neutral.
➤ Normal volume, but lack of fresh capital → sustainability of rally questionable.
__________________________________________________________________________________
Strategic Summary
➤ HTF trend bullish above 106,480; breakout > 108,239 targets 109,950 / 110,600.
➤ Buy swing pullbacks on 106,480 or 104,600. Invalidation < 102,626 = drop to 99k.
➤ Tactical short scalps around 108,250–109,000.
➤ Core PCE = major catalyst (June 27).
➤ Watch spot volumes, funding, and Risk On / Risk Off signals.
__________________________________________________________________________________
Multi-Timeframe Analysis
➤ 1D : bullish bias > 106,480; danger < 102,626.
➤ 12H : bullish consolidation; confirmed breakout > 108,239.
➤ 6H : compression; buy dips 106,480 / 104,600.
➤ 4H : lateral-bullish; key support = 104,600.
➤ 2H : neutral-bullish; triggers = 107,800 / 106,000.
➤ 1H : bull flag; micro-divergence, prefer long > 106,950.
➤ 30 min : tight triangle; breakout at 107,200 / 106,650 = signal.
➤ 15 min : bearish < 106,950, expected bounce on 106,480.
__________________________________________________________________________________
Macro, News & On-Chain Analysis
➤ Macro backdrop: “Higher for longer” stance continues, no FOMC imminent.
➤ Core PCE June 27: upside surprise (2.7% YoY vs 2.6% expected) – USD supported, potential headwind for risk assets.
➤ Pacific Region: ongoing tensions in Taiwan Strait and South China Sea:
- Increased military activity: air incursions, naval maneuvers.
- High risk of escalation flagged by defense analysts & social feeds.
- Risk sentiment: volatile – sudden events could trigger risk-off.
➤ On-chain: Range 100–110k; weak spot volume; cautious leverage; no major sell-side imbalance.
__________________________________________________________________________________
Conclusion
➤ BTC maintains a controlled bullish bias > 106,480.
➤ Swing buy zones = 106,480 & 104,600; targets 109,950 / 110,600.
➤ Main risk: break < 102,626 = sell-off toward 99k.
➤ Monitor Core PCE and geopolitical risk in the Pacific region.
__________________________________________________________________________________

BTC multi-timeframe: bullish momentum and strong support zones__________________________________________________________________________________
Technical Overview – Summary Points
__________________________________________________________________________________
Momentum: Clear bullish bias across all timeframes (MTFTI Up everywhere except 5min). Weak selling pressure, no distribution or capitulation signals.
Support/Resistance: Key resistances: 110647–109554 (HTF). Major supports: 102756 (D Pivot Low), 98330 (720 Pivot Low). Multiple buy zones on retracement.
Volume: Recent volumes below "extreme" threshold, no euphoria/capitulation detected.
Multi-TF Behavior: Global bullish alignment, volatility present intraday, but no confirmed reversal risk. Risk On / Risk Off Indicator shows no major anomaly.
__________________________________________________________________________________
Strategic Summary
__________________________________________________________________________________
Strategic Bias: Structurally bullish market. Prioritize tactical buys on pullback, active risk management.
Opportunities: Reinforce long positions on $106k/$103k/$100k retrace. Partial targets below 110–111k.
Risk Zones: Rejection under 106500–107000 with extreme volume spike = short-term top signal. Invalidation if H1 < 106k or H4 < 102.7k.
Macro Catalysts: US calendar (GDP, durable goods, jobless claims), geopolitics (Russia/Ukraine). No systemic alert, but caution required.
Action Plan: Filter entries on technical supports, exit on extreme sell volume or macro shock.
__________________________________________________________________________________
Multi-Timeframe Analysis
__________________________________________________________________________________
1D: Compression below historical resistances (109–111k), solid momentum, potential buy zone 102750–98330.
12H: Multiple resistances, uptrend, support confluence 102756–106530 pivot key.
6H: Price under resistance cluster (106530), possible profit-taking on rejection, strong support 102756.
4H: High-range structure, reinforced supports, next breakout could trigger acceleration with volume.
2H: Pivot zone 106500–107200, caution below close, buy zone on correction.
1H: Support stacking structure, no clear breakdown, critical node, aggressive buy 106100–105800.
30min: Compression at range high, caution on buying resistance, key spots 106000/104500.
15min: Possible buyer exhaustion under 108k, tactical buy on support 106000–106500 if confirmed.
Summary: Strong bullish alignment, same key supports, no panic. Risk On / Risk Off Indicator neutral, controlled market, possible whipsaw on short-term TFs but no major reversal sign.
__________________________________________________________________________________
Macro, News & On-Chain Analysis
__________________________________________________________________________________
Macro: Fed and traditional markets calm, no monetary alert. Israel/Iran ceasefire, increased volatility in Europe (Russia/Ukraine). Moderate risk-on sentiment.
Calendar: June 26: US durable goods/GDP/jobless claims (potential volatility).
On-chain: BTC range $100–110k, fundamental support $93–100k, no panic/capitulation. Low spot volumes, bullish digestion phase.
__________________________________________________________________________________
Conclusion
__________________________________________________________________________________
Dominant bias: Up/moderately bullish in short term, focus on retracement buying.
Risk management: Stop H4 < $102.7k, H1 < $106k, scalping: break of 106k with extreme volumes.
Action zones: Reinforce on $106k/$103k/$100k retrace, partial TP below 110–111k, extension if confirmed breakout.
Monitor: Volume, support reactions, macro catalysts.
Summary:
Technical and on-chain context remains bullish; best approach is tactical buying on pullback with dynamic stops. Stay agile in case of extreme selling volume or macro shocks. Act on signals, protect capital.
__________________________________________________________________________________