AUDCAD DESCENDING TRIANGLE BREAKOUTPair: AUDCAD
Timeframe: 1H , 4H
Analysis: Round number level, trend line, volume profile, support and resistance, descending triangle pattern
—————
Key Takeaway: Alot of bullish momentum for AUD as it is altogether, we are at a critical level of reaction at the moment by the top of our descending triangle. We are looking for a close above this level on the 4H chart, a re-test would also give us the perfect confirmation we need to enter long
—————
Level needed: need a close by 0.89635
—————
Trade: Long
RISK:REWARD 1:9
—————
DO NOT ENTER OUR SETUPS WITHOUT CONFIRMATION
Macro

$TPGTPG telecom LTD
Bullish Case
-Above the 2021 Yearly open. ( this is a weekly chart so need to view yearly chart to see 2021 YO)
-MACD Bull divergence
-MACD bullish crossover
-Above the bo line (Breakout line on daily)
Would like to see a pullback into the and below the breakout line to fake out all those who got long then starts the real breakout.
the FED meeting is on the 27th and anther rate hike while expected will drive another leg down in short term on Stonks imo.. watching closely.

DXY Macro LevelsDXY RSI compared to BTC
DXY/RSI bottoms mark the BTC top. Conversely, BTC bear markets generally occur when the DXY ranges before it drops and the bull market starts.
The multi diagonal and horizontal trending resistance should offer a solid rejection given how hot the dollar came into this zone. The inevitable fed pivot may just provide that drop-off we need for the macro trend to reverse.

CADJPY POTENTIAL DOWNTRENDPair: CADJPY
Timeframe: 1D , 4H
Analysis: Round number level, trend line, volume profile, support and resistance, consolidation
—————
Key Takeaway: Looking for breaks of this consolidation period, we have breached this level of support numerous times and we need to see a close below. looking to take profits on trend line suppot
—————
Level needed: need a close by 109.375
—————
Trade: Short
RISK:REWARD 1:7
—————
DO NOT ENTER OUR SETUPS WITHOUT CONFIRMATION

EURNZD BEST TIME TO BUY !Pair: EURNZD
Timeframe: 1D , 4H
Analysis: Round number level, trend line, volume profile, support and resistance, pennant, ascending triangle
—————
Key Takeaway: Seeing a breach of this vitally strong level of resistance, we have also seen a retest of this level indicating price will move upward through it.
—————
Level needed: need a close by 1.65295
—————
Trade: Long
RISK:REWARD 1:7
—————
DO NOT ENTER OUR SETUPS WITHOUT CONFIRMATION

CADCHF PENNANT BREAKOUT?Pair: CADCHF
Timeframe: 1D , 4H
Analysis: Round number level, trend line, volume profile, support and resistance, pennant pattern
—————
Key Takeaway: If we close below this support level of pennant we will look for short entry, we have also already broken high volume level, if we start seeing bullish momentum against this level then we are seeing a bounce and will look for long entry
—————
Level needed: need a close by —
—————
Trade: Neutral
RISK:REWARD 1:4
—————
DO NOT ENTER OUR SETUPS WITHOUT CONFIRMATION

10Y Bonds overbought10Y Bonds are overbought kissing 200 MA
RSI OB
MACD OB
-----------
This is a sign the ASX could bounce as 10 years pull-back from overbought and 200 MA being resistance.
If bonds reak above 200 MA it signals a continuance in market fear and scepticism.
US10Y Already found broke above 200 MA and it is now a supporting moving average, bad sign ASX could follow.

Combined Macro Charts For You!I'm a big fan of exotic charts. It is often tough to gauge the current markets by looking at individual charts so sometimes I like to combine them together. Here is a rough rationale of this chart:
TOTAL
Crypto Total seems to have a good representation small cap behavior and is often a leading indicator of the broader risk-on market.
S&P
Large caps, historically it's a trailing indicator, but doesn't have such a long tail as Treasury Yields.
1/DXY
Relatively good indicator of impedance changes. If I'm going to convert my dollars to something else, and then back again, it represents relatively how efficient the economic circuit is. More volatility = conflicting expectations by the market. It is sometimes inversely correlated with risk assets but not always.
US02Y/US10Y
Inverted 10Y/02Y. How are investors feeling about the short-term economy vs long-term? When this symbol experiences large downward volatility, the relative health of debt in the economy is unveiled and investors flee risk-on assets.
I weighted each of these symbols 25% by using the 3 Year MA:
...........................3Y.MA......................factor
TOTAL................1049933961759.....1
ES1!..................3723.74..................281956839
1/DXY...............0.010448................100491382251052
US02Y/US10Y..0.4784....................2194678013710
(sorry about all the dots, I had to use it to make it line up)
Here is the resulting symbol:
CRYPTOCAP:TOTAL+1/TVC:DXY*100491382251052+CME_MINI:ES1!*281956839+US02Y/US10Y*2194678013710
Normalized to 100:
(CRYPTOCAP:TOTAL+1/TVC:DXY*100491382251052+CME_MINI:ES1!*281956839+US02Y/US10Y*2194678013710)/67060000000
Here is the index without Treasury Yields, so each remaining symbol is now 33% of the chart:
CRYPTOCAP:TOTAL+1/TVC:DXY*100491382251052+CME_MINI:ES1!*281956839
Normalized to 100:
(CRYPTOCAP:TOTAL+1/TVC:DXY*100491382251052+CME_MINI:ES1!*281956839)/53870000000
Here is the chart, normalized to 100 along with some rough expectations:
I hope that this is somehow useful. The overall conclusion here seems to indicate the macro environment is currently not friendly at all.
Thanks for taking a look and I hope you enjoyed this idea. Hopefully it makes sense and I don't believe there are any major mistakes. If you spot a mistake, or have an exotic chart of your own you would like to share, please let me know!
Good luck and don't forget to hedge your bets. Take care and be safe.
- your fringe chartist

Consolidation/reversal area for the S&P 500?The S&P 500 sold off until June, when expectations of monetary tightening peaked. Since then, the index has powered off the June lows as the growing likelihood of recession makes it less tenable for the Fed to keep raising rates.
I suspect that interest rate expectations will continue to "drive the ship," and that stock prices will peak or consolidate whenever market expectations for a "dovish pivot" peak or consolidate.
Currently, FOMC FedWatch futures are pricing a 75% chance that the Fed will hike 50 bps in September, and a 25% chance that the Fed will hike 75 bps:
www.cmegroup.com
In November, the market is expecting a target rate of either 3% (75% chance) or 3.25% (25% chance), and in December, the market's placing about even odds that we end the year at either 3% or 3.25%. So in all, the market expects the Fed target rate to be either 75 bps or 100 bps higher than the current level by year end.
This is slightly more dovish than the Fed's own projections. The current Fed dot plot indicates that the median forecast by FOMC members is that they will raise the target to 3.25% by year end.
So, I think market expectations are now about where they should be. That suggests to me that most of the big gains in stocks are now behind us, and that the S&P 500's price may be entering a zone of consolidation as it approaches the 200-day EMA.
We definitely could see market expectations get even more dovish if economic data stay soft. For instance, maybe the consensus for September will move to a 25 or 50 bps hike. But if the economic data looks that bad, then the stock market may find other reasons for pessimism. A strong dovish pivot could also cause inflation expectations and commodities prices to rise again, which could throw a wet blanket on the stock market rally as well. I wouldn't expect ES to be able to get much father than 4320 without causing inflation to heat up and the Fed to flip hawkish again.
Bottom line: I think there's still some runway for stocks to move higher toward that 200-day EMA, but I wouldn't expect them to immediately go soaring off into a new bull market. More likely, they get a little more tentative here and consolidate for a while in this range.

Where have I seen this pattern before?Interesting market structure lately. It looks quite similar to a previous bear market. This may be just the beginning of more pain over the coming year.

$XLE: Weekly and monthly uptrendNice signal in energy names. Macro and fiscal policy are sure making the Fed's life hard. The trend in commodities, energy, value vs growth remains bullish, same as the trend in the Dollar vs the Euro. The recent drop in inflation and oil created a very low risk buy opportunity in commodities in general. I've rotated away from my growth focused portfolio in the prior week, and am long $XLE and other names in my portfolio. I suggest you do the same, very interesting time, where the easy money disappeared from markets and people will likely get schooled time and time again trying to gamble in the same garbage names as between 2020 and 2022.
Stay safe out there!
Best of luck,
Ivan Labrie.

CADCHF BEARISH SWING OFF RESISTANCE?Pair: CADCHF
Timeframe: 1D , 4H
Analysis: Round number level, trend line, volume profile, support and resistance, ascending triangle, consolidation
—————
Key Takeaway: We have seen the level of resistance we are now at hold for a few weeks and price cannot seem to break it. If we close below round number and high volume level then we will be entering short
—————
Level needed: need a close by 0.74470
—————
Trade: Short
RISK:REWARD 1:5
SL: 15
TP: 75
—————
DO NOT ENTER OUR SETUPS WITHOUT CONFIRMATION

Bitcoin Trend Analytics August 31The key support sustained the price yesterday and saw a quick bounce. The key support boosts the confidence of the bulls.
The short-term bullish support is able to keep the price above but not strong enough. Only by pushing it up and breaking the intraday resistance for 24 hours will the short-term bulls firm their stance.
It is a crucial moment from today until tomorrow as long-term data is going to be updated. At the same time, QT is going to double. If the market keeps the current momentum, it’ll go against the macro with an outstanding performance. Otherwise, a slide will follow after the breakdown of the key support.
QT doubles in September. Fed lifts the upper limit of QT to 95 billion (60 billion treasury bonds + 35 billion MBS). The market is under the pressure of quick and massive liquidity drainage.
The market expected interest rate hike in September: 50bp(31.5%),75bp(68.5%)

Bitcoin Macro Analysis - Log Curve 2024Bitcoin Logarithmic Growth curves displaying historic price movement since its existence. A lot of discussion now on whether the recent 'top' was a completion of our 4th bullrun or not, my observations below:
What we know:
- Price has touched the upper band of the Log curve at the end of a bullrun, this has happened 3 times in history - highlighted in red
- Price has touched the lower band of the Log curve at the end of bear markets, this has happened at least 3 times in history - highlighted in green
- Price % increases have gotten smaller over time with each bullrun, as is normal with a maturing asset on a Logarithmic scale
- Bitcoin's length (time/bars) of bull runs have been getting longer with each one at 11 bars, 24 bars, 35 bars respectively - highlighted in yellow
- Accumulation zones in green rectangles precede future ATH's
Present situation & unknowns:
- Price has not touched the upper band of the Log curve - highlighted in upper grey circle
- Price has not touched the lower band of the Log curve - highlighted in lower grey circle
- Bitcoin's bullrun, if peaked already, will have decreased in length (1st time in history) relative to past runs, sitting at 27 bars at the peak of 69k - highlighted in lower grey box
- I think to break and go below the bottom band for a longer period of time (low low prices), then it should take un-foreseen negative news in the global economy; I believe current factors are being priced already since Nov/Dec 2021.
If Bitcoin's bull run is still 'in process', then it currently fits the thesis and we could expect an ATH peak in late 2023 or 2024, somewhere around 55-66 bars to completion and a tap of the upper band on the Log curve. If this is the case, we do not want to see a touch of the lower band on the Log curve to further validate this, but it doesn't mean that can't happen.
Or, you can argue we've seen our bullrun already and topped at 69k, many make this argument and it's perfectly fine. If this is the case, however, then in theory we would be nearing our end of a bear market bottom, around 16-17k or perhaps one more lower low to finally bottom on a touch of the lower band of the Log curve then it proceeds to accumulation zone in green box.
Whichever side you are in belief of, the resulting action should be quite similar as an investor/trader imo at this point in time.
Hope this is helpful! Let me know your thoughts in the comments!
V

ARE THE BEARS GOING TO FULLY TAKE AUDUSD ?Pair: AUDUSD
Timeframe: 1D , 4H
Analysis: Round number level, trend line, volume profile, support and resistance, pennant pattern, ascending triangle
—————
Key Takeaway: Saw a big pullback today for this pair up to resistance. We are seeing strength in USD which tells us the pair is going to drop. We want to see a break of bottom pennant and dynamic support before we enter short again
—————
Level needed: need a close by 0.68795
—————
Trade: Short
RISK:REWARD 1:8
SL: 25
TP: 195
—————
DO NOT ENTER OUR SETUPS WITHOUT CONFIRMATION

Bitcoin In a Sucker's Rallyhello frends its ur pal coinholio and i have an opinion abou the marked
my thinkings is that the bit coin is not at a good price. too much people think that fed will pivot at the first sign of a down turn and we will get qe to maek price again. me no thinks that will happen sooner enough until market is alredy worse than it be right now. there is a rally in stocks that bitcoin follow right now because some peeps think we can land softly, but i think we will land on our bungholes, let me explain the reason why:
fed pause is not fed stimmy
if internet rates make a rise, the fed will stop making them go. but fed will not give stimmy until everyone gets fired and we are balls deep in a recession. me thinks not only the soft landing narrative is false, it will break down in the next few months and bitty will be mad. recession will come sooner at the end of the year and stimmy in mid to late 2023. the numbers of peoples with job is still very high but its one of the only raisins that we arent in official recessino, spy lags behind, but bitty will follow spy price action and get crushed to oblivion in a recession.
people is buying less stuffs, less stuffs is being producted, there is less supply, less demand, less of the real wagerinos. we is at the cusp of recession and its coming sooner than u think. my source is a forest rat, i met him in a forest and his name is benjamin and he told me that things are looking bad and i should move into the forest with him. then we discusted the market and he said he sold his house a few months ago. some people use like, leading and coincidence indicators to make decides about this but woodland creatures i thin can tell a more accurate story about whas gonna happen. im gonna not post much cuz they dont have internet in the forest but i put a lot of money into james bond and took him into the forest cuz apparently he does goodly during slowing economix gross.
thank you for watching if u like my video please smash that like button and subscribe to my channel and dont forget to enable the notifications so i can tell u which berries are safe to eat and which ones give u the runs

THE BEST PLACE TO BE SHORTING GBPNZDPair: GBPNZD
Timeframe: 1D , 4H
Analysis: Round number level, trend line, volume profile, support and resistance, trend channel
—————
Key Takeaway: GBP has significant weakness as it is and have been down trending for some time. We have just bounced off the top of the trend channel, high volume level and rounded number level which tells us we are in for another bearish swing
—————
Level needed: need a close by 1.90325
—————
Trade: Short
RISK:REWARD 1:4
SL: 40
TP: 150
—————
DO NOT ENTER OUR SETUPS WITHOUT CONFIRMATION

USDCHF ARE WE ABOUT TO SEE A REVERSAL?Pair: USDCHF
Timeframe: 1D , 4H
Analysis: Round number level, trend line, volume profile, support and resistance, ascending triangle pattern, pennant
—————
Key Takeaway: We have broken our upwards trend line and seen a bounce off our resistance levels. We now need to see a push through support and rounded number and we will then be entering short
—————
Level needed: need a close by
—————
Trade: Short
RISK:REWARD 1:11
SL: 20
TP: 220
—————
DO NOT ENTER OUR SETUPS WITHOUT CONFIRMATION

CADCHF REVERSAL INBOUND?Pair: CADCHF
Timeframe: 1D , 4H
Analysis: Round number level, trend line, volume profile, support and resistance, trend channel break
—————
Key Takeaway: Price flew through the top of our trend channel indicating a change in direction, we have seen a sharp reaction to our support level and price is jumping up very quickly so is a perfect time for a long entry, we will be riding this to the next significant high
—————
Level needed: need a close by 0.74145
—————
Trade: Long
RISK:REWARD 1:6
SL: 25
TP: 150
—————
DO NOT ENTER OUR SETUPS WITHOUT CONFIRMATION

NZDUSD CONTINUATION SETUPPair: NZDUSD
Timeframe: 1D , 4H
Analysis: Round number level, trend line, volume profile, support and resistance, Fibonacci retracement
—————
Key Takeaway: Seen price break trend line and test support, we have also seen a bounce off 0.5 on the fib retracement level. As USD strength is still all there we will be shorting this pair as we are starting to see signs of a continuation of bearish movement
—————
Level needed: need a close by 0.61945
—————
Trade: Short
RISK:REWARD 1:7
SL: 15
TP: 100
—————
DO NOT ENTER OUR SETUPS WITHOUT CONFIRMATION

AUDNZD DOUBLE TOP Pair: AUDNZD
Timeframe: 1D , 4H
Analysis: Round number level, trend line, volume profile, support and resistance
—————
Key Takeaway: Seen alot of resistance against trend line and a double top form on the 1H chart, once we see a good amount of bearish momentum we will be looking for short entry
—————
Level needed: need a close by 1.11460
—————
Trade: Short
RISK:REWARD 1:13
SL: 10
TP: 130
—————
DO NOT ENTER OUR SETUPS WITHOUT CONFIRMATION

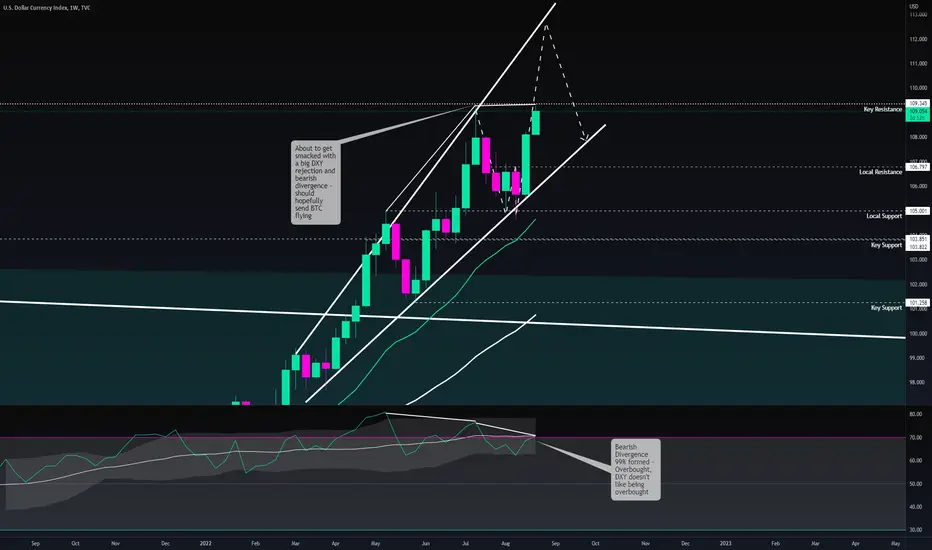
🤖 #DXY - 23.08 - #IDEA #SNAPSHOT 🤖🤖 #DXY - 23.08 - #IDEA #SNAPSHOT 🤖
About to get smacked with a big DXY rejection and bearish divergence - should hopefully send BTC flying
Key resistance at 109.33 overbought with a bearish divergence is really going to struggle to break. Losing 106.797 can really send this plummeting to 105 region and even 100, but that might be some weeks/months in the making.
USDCHF, WILL WE KEEP CLIMBING THE LADDER AND BREAK PENNANT?Pair: USDCHF
Timeframe: 1D , 4H
Analysis: Round number level, trend line, volume profile, support and resistance, pennant pattern, ascending triangle pattern
—————
Key Takeaway: Seen alot of strength with USD this month and we continue to climb the scale in USD base currency pairs. On the chart we can see a very steep climb for this pair which leads for me to believe that we can very easily break resistance and top trend line. Although we could see a bonce depending on high risk news we see this week, we always have to keep options open
—————
Level needed: need a close by 0.96690
—————
Trade: Long
RISK:REWARD 1:7
SL: 25
TP: 182
—————
DO NOT ENTER OUR SETUPS WITHOUT CONFIRMATION
