NKE: Macro structure [Monthly time frame]Price reached the top of the macro support: 56-27.
The correction from Nov'21 top has a picture perfect three-wave structure that has reached area of an ideal extension to finish itself (60-44 support).
Although, within the context of todays market uncertainty, recovery from this support zone, might still be a larger bounce before one more leg-down deeper into macro support
Best of trading and investing decision and thank you for you attention!
Macro

Behind the Curtain: Macro Indicators That Move the Yen1. Introduction
Japanese Yen Futures (6J), traded on the CME, offer traders a window into one of the world’s most strategically important currencies. The yen is not just Japan’s currency—it’s also a barometer for global risk appetite, a funding vehicle for the carry trade, and a defensive asset when markets turn volatile.
But what truly moves Yen Futures?
While many traders fixate on central bank statements and geopolitical news, machine learning tells us that economic indicators quietly—but consistently—steer price action. In this article, we apply a Random Forest Regressor to reveal the top macroeconomic indicators driving 6J Futures across daily, weekly, and monthly timeframes, helping traders of all styles align their strategies with the deeper economic current.
2. Understanding Yen Futures Contracts
Whether you’re trading institutional size or operating with a retail account, CME Group offers flexible exposure to the Japanese yen through two contracts:
o Standard Japanese Yen Futures (6J):
Contract Size: ¥12,500,000
Tick Size: 0.0000005 = $6.25 per tick
Use Case: Institutional hedging, macro speculation, rate differential trading
o Micro JPY/USD Futures (MJY):
Contract Size: ¥1,250,000
Tick Size: 0.000001 = $1.25 per tick
Use Case: Retail-sized access, position scaling, strategy testing
o Margin Requirements:
6J: Approx. $3,300 per contract
MJY: Approx. $330 per contract
Both products offer deep liquidity and near 24-hour access. Traders use them to express views on interest rate divergence, U.S.-Japan trade dynamics, and global macro shifts—all while adjusting risk through contract size.
3. Daily Timeframe: Top Macro Catalysts
Short-term movements in Yen Futures are heavily influenced by U.S. economic data and its impact on yield spreads and capital flow. Machine learning analysis ranks the following three as the most influential for daily returns:
10-Year Treasury Yield: The most sensitive indicator for the yen. Rising U.S. yields widen the U.S.-Japan rate gap, strengthening the dollar and weakening the yen. Drops in yields could create sharp yen rallies.
U.S. Trade Balance: A narrowing trade deficit can support the USD via improved capital flow outlook, pressuring the yen. A wider deficit may signal weakening demand for USD, providing potential support for yen futures.
Durable Goods Orders: A proxy for economic confidence and future investment. Strong orders suggest economic resilience, which tends to benefit the dollar. Weak numbers may point to a slowdown, prompting defensive yen buying.
4. Weekly Timeframe: Intermediate-Term Indicators
Swing traders and macro tacticians often ride trends formed by mid-cycle economic shifts. On a weekly basis, these indicators matter most:
Fed Funds Rate: As the foundation of U.S. interest rates, this policy tool steers the entire FX complex. Hawkish surprises can pressure yen futures; dovish turns could strengthen the yen as yield differentials narrow.
10-Year Treasury Yield (again): While impactful daily, the weekly trend gives traders a clearer view of long-term investor positioning and bond market sentiment. Sustained moves signal deeper macro shifts.
ISM Manufacturing Employment: This labor-market-linked metric reflects production demand. A drop often precedes softening economic growth, which may boost the yen as traders reduce exposure to riskier assets.
5. Monthly Timeframe: Structural Macro Forces
For position traders and macro investors, longer-term flows into the Japanese yen are shaped by broader inflationary trends, liquidity shifts, and housing demand. Machine learning surfaced the following as top monthly influences on Yen Futures:
PPI: Processed Foods and Feeds: A unique upstream inflation gauge. Rising producer prices—especially in essentials like food—can increase expectations for tightening, influencing global yield differentials. For the yen, which thrives when inflation is low, surging PPI may drive USD demand and weaken the yen.
M2 Money Supply: Reflects monetary liquidity. A sharp increase in M2 may spark inflation fears, sending interest rates—and the dollar—higher, pressuring the yen. Conversely, slower M2 growth can support the yen as global liquidity tightens.
Housing Starts: Serves as a growth thermometer. Robust housing data suggests strong domestic demand in the U.S., favoring the dollar over the yen. Weakness in this sector may support yen strength as traders rotate defensively.
6. Trade Style Alignment with Macro Data
Each indicator resonates differently depending on the trading style and timeframe:
Day Traders: React to real-time changes in 10-Year Yields, Durable Goods Orders, and Trade Balance. These traders seek to capitalize on intraday volatility around economic releases that impact yield spreads and risk appetite.
Swing Traders: Position around Fed Funds Rate changes, weekly shifts in Treasury yields, or deteriorating labor signals such as ISM Employment. Weekly data can establish trends that last multiple sessions, making it ideal for this style.
Position Traders: Monitor PPI, M2, and Housing Starts for broader macro shifts. These traders align their exposure with long-term shifts in capital flow and inflation expectations, often holding positions for weeks or more.
Whatever the style, syncing your trading plan with the data release calendar and macro backdrop can improve timing and conviction.
7. Risk Management
The Japanese yen is a globally respected safe-haven currency, and its volatility often spikes during geopolitical stress or liquidity events. Risk must be managed proactively, especially in leveraged futures products.
8. Conclusion
Japanese Yen Futures are a favorite among global macro traders because they reflect interest rate divergence, risk sentiment, and global liquidity flows. While headlines grab attention, data tells the real story.
Stay tuned for the next installment of the "Behind the Curtain" series, where we continue uncovering what really moves the futures markets.
When charting futures, the data provided could be delayed. Traders working with the ticker symbols discussed in this idea may prefer to use CME Group real-time data plan on TradingView: www.tradingview.com - This consideration is particularly important for shorter-term traders, whereas it may be less critical for those focused on longer-term trading strategies.
General Disclaimer:
The trade ideas presented herein are solely for illustrative purposes forming a part of a case study intended to demonstrate key principles in risk management within the context of the specific market scenarios discussed. These ideas are not to be interpreted as investment recommendations or financial advice. They do not endorse or promote any specific trading strategies, financial products, or services. The information provided is based on data believed to be reliable; however, its accuracy or completeness cannot be guaranteed. Trading in financial markets involves risks, including the potential loss of principal. Each individual should conduct their own research and consult with professional financial advisors before making any investment decisions. The author or publisher of this content bears no responsibility for any actions taken based on the information provided or for any resultant financial or other losses.

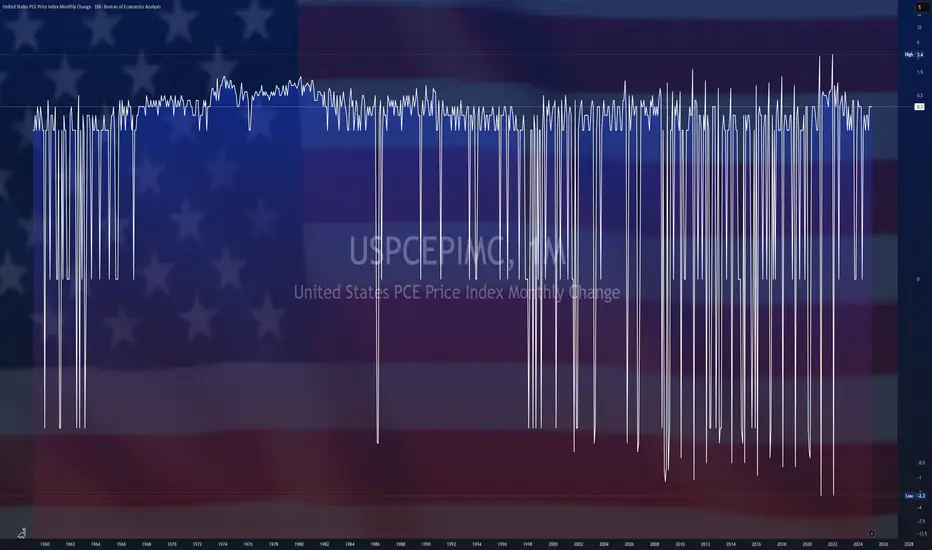
$USPCEPIMC -U.S Core PCE Inflation Rises More than ExpectedECONOMICS:USPCEPIMC
(February/2025)
source: U.S. Bureau of Economic Analysis
- The US PCE price index rose by 0.3% month-over-month in February, maintaining the same pace as the previous two months.
The core PCE index increased by 0.4%, the most since January 2024, surpassing the forecast of 0.3% and up from 0.3% in January.
On a year-over-year basis, headline PCE inflation remained steady at 2.5%, while core PCE inflation edged up to 2.8%, above the expected 2.7%.
Behind the Curtain The Economic Pulse Behind Euro FX1. Introduction
Euro FX Futures (6E), traded on the CME, offer traders exposure to the euro-dollar exchange rate with precision, liquidity, and leverage. Whether hedging European currency risk or speculating on macro shifts, Euro FX contracts remain a vital component of global currency markets.
But what truly moves the euro? Beyond central bank meetings and headlines, the euro reacts sharply to macroeconomic data that signals growth, inflation, or risk appetite. Using a Random Forest Regressor, we explored how economic indicators correlate with Euro FX Futures returns across different timeframes.
In this article, we uncover which metrics drive the euro daily, weekly, and monthly, offering traders a structured, data-backed approach to navigating the Euro FX landscape.
2. Understanding Euro FX Futures Contracts
The CME offers two primary Euro FX Futures products:
o Standard Euro FX Futures (6E):
Contract Size: 125,000 €
Tick Size: 0.000050 per euro = $6.25 per tick per contract
Trading Hours: Nearly 24 hours, Sunday to Friday (US)
o Micro Euro FX Futures (M6E):
Contract Size: 12,500 € (1/10th the size of 6E)
Tick Size: 0.0001 per euro = $1.25 per tick per contract
Accessible to: Smaller accounts, strategy testers, and traders managing precise exposure
o Margins:
6E Initial Margin: ≈ $2,600 per contract (subject to volatility)
M6E Initial Margin: ≈ $260 per contract
Whether trading full-size or micro contracts, Euro FX Futures offer capital-efficient access to one of the most liquid currency pairs globally. Traders benefit from leverage, scalability, and transparent pricing, with the ability to hedge or speculate on Euro FX trends across timeframes.
3. Daily Timeframe: Key Economic Indicators
For day traders, short-term price action in the euro often hinges on rapidly released data that affects market sentiment and intraday flow. According to machine learning results, the top 3 daily drivers are:
Housing Starts: Surging housing starts in the U.S. can signal economic strength and pressure the euro via stronger USD flows. Conversely, weaker construction activity may weaken the dollar and support the euro.
Consumer Sentiment Index: A sentiment-driven metric that reflects household confidence. Optimistic consumers suggest robust consumption and a firm dollar, while pessimism may favor EUR strength on defensive rotation.
Housing Price Index (HPI): Rising home prices can stoke inflation fears and central bank hawkishness, affecting yield differentials between the euro and the dollar. HPI moves often spark short-term FX volatility.
4. Weekly Timeframe: Key Economic Indicators
Swing traders looking for trends spanning several sessions often lean on energy prices and labor data. Weekly insights from our Random Forest model show these three indicators as top drivers:
WTI Crude Oil Prices: Oil prices affect global inflation and trade dynamics. Rising WTI can fuel EUR strength if it leads to USD weakness via inflation concerns or reduced real yields.
Continuing Jobless Claims: An uptick in claims may suggest softening labor conditions in the U.S., potentially bullish for EUR as it implies slower Fed tightening or economic strain.
Brent Crude Oil Prices: As the global benchmark, Brent’s influence on inflation and trade flows is significant. Sustained Brent rallies could create euro tailwinds through weakening dollar momentum.
5. Monthly Timeframe: Key Economic Indicators
Position traders and institutional participants often focus on macroeconomic indicators with structural weight—those that influence monetary policy direction, capital flow, and long-term sentiment. The following three monthly indicators emerged as dominant forces shaping Euro FX Futures:
Industrial Production: A cornerstone of economic output, rising industrial production reflects strong manufacturing activity. Strong U.S. numbers can support the dollar, while a slowdown may benefit the euro. Likewise, weaker European output could undermine EUR demand.
Velocity of Money (M2): This metric reveals how quickly money is circulating in the economy. A rising M2 velocity suggests increased spending and inflationary pressures—potentially positive for the dollar and negative for the euro. Falling velocity signals stagnation and may shift flows into the euro as a lower-yield alternative.
Initial Jobless Claims: While often viewed weekly, the monthly average could reveal structural labor market resilience. A rising trend may weaken the dollar, reinforcing EUR gains as expectations for interest rate cuts grow.
6. Strategy Alignment by Trading Style
Each indicator offers unique insights depending on your approach to market participation:
Day Traders: Focus on the immediacy of daily indicators like Housing Starts, Consumer Sentiment, and Housing Price Index.
Swing Traders: Leverage weekly indicators like Crude Oil Prices and Continuing Claims to ride mid-term moves.
Position Traders: Watch longer-term data such as Industrial Production and M2 Velocity.
7. Risk Management
Currency futures provide access to high leverage and broad macro exposure. With that comes responsibility. Traders must actively manage position sizing, volatility exposure, and stop placement.
Economic indicators inform price movement probabilities—not certainties—making risk protocols just as essential as trade entries.
8. Conclusion
Euro FX Futures are shaped by a deep web of macroeconomic forces. From Consumer Sentiment and Oil Prices to Industrial Production and Money Velocity, each indicator tells part of the story behind Euro FX movement.
Thanks to machine learning, we’ve spotlighted the most impactful data across timeframes, offering traders a framework to align their approach with the heartbeat of the market.
As we continue the "Behind the Curtain" series, stay tuned for future editions uncovering the hidden economic forces behind other major futures markets.
When charting futures, the data provided could be delayed. Traders working with the ticker symbols discussed in this idea may prefer to use CME Group real-time data plan on TradingView: www.tradingview.com - This consideration is particularly important for shorter-term traders, whereas it may be less critical for those focused on longer-term trading strategies.
General Disclaimer:
The trade ideas presented herein are solely for illustrative purposes forming a part of a case study intended to demonstrate key principles in risk management within the context of the specific market scenarios discussed. These ideas are not to be interpreted as investment recommendations or financial advice. They do not endorse or promote any specific trading strategies, financial products, or services. The information provided is based on data believed to be reliable; however, its accuracy or completeness cannot be guaranteed. Trading in financial markets involves risks, including the potential loss of principal. Each individual should conduct their own research and consult with professional financial advisors before making any investment decisions. The author or publisher of this content bears no responsibility for any actions taken based on the information provided or for any resultant financial or other losses.

TRANSPORTATION! CRACK!!The transportation average breaking the first time warned us that things were not right back in July 2024. Today we are getting yet another CRACK WARNING!
The TRUMP economy will be a disaster area if he doesn't change his ways quickly. Even then it may be too late. Trust in the government has eroded.
Democracy and markets rely on TRUST! Trust can not be bought, or taken, it may only be lost!
DANGER for bulls!
last month I started to warn about Airlines (JETS) since then the results speak for themselves.
Click like, follow subscribe for more!

Business CycleAll the credits to Ostium labs insights. Found here
Intuition behind different indicators
NFCI - NATIONAL FINANCIAL CONDITIONS INDEX
Note y axis is inverted.
Rising NFCI here suggests loosening of financial conditions. Btc outperform in loose conditions.
DRTSCILM - NET % OF BANKS TIGHTENING LENDING STANDARDS
Note y axis is inverted.
This tracks changes in the willingness of banks to lend, where tightening lending standards is indicative of caution, whereas looser lending standards suggest economic confidence.
Here the graph is inverted - a rise shows improving willingness to lend and a fall shows tighter lending standards.
HYG
Real time proxy for demand of junk bonds which is a good proxy for risk appetite in the market. Demand for junk bonds is correlated with the rest of the risk curve, with Bitcoin tending to outperform during periods of strength for HYG, and vice-versa.
BAMLH0A0HYM2 - HY ICE CREDIT SPREADS
Note y axis is inverted.
This measures the premium demanded by investors over government bonds. As one would imagine, wider credit spreads mean that more yield is being demanded to invest in junk bonds vs safe bonds, which itself is suggestive of risk in the economy. Narrow spreads, meanwhile, are indicative of confidence.
The graph is inverted such that the peaks are the tightest spread. If credit spreads are narrow, risk appetite is high, which means assets further out the risk curve benefit. This is also suggestive of expansion vs contraction in the business cycle, where widening spreads would be suggestive of downturn and narrowing spreads of continued growth.
USMNO/USNMNO - US MANUFACTURING ORDERS / NON-MANUFACTURING ORDERS
Manufacturing New Orders growing faster than Non-Manufacturing New Orders is generally indicative of early recovery in a business cycle, whereas late cycle dynamics are more heavily weighted towards services, largely driven by consumer spending and therefore this ratio would begin to contract, as Non-Manufacturing New Orders dominate.
USBC0I - US PMI
A composite of the Manufacturing and Services sectors in the US economy. Above 50 = expansion and below 50 = contraction.
T10YIE - 10-YEAR INFLATION BREAKEVENS
A market-based measure of average expected inflation over the next 10 years.
Bitcoin likes it very much when the average expected inflation rate has bottomed and is trending higher and it generally underperforms when 10-year inflation breakevens are declining.
Bitcoin also tends to front-run peaks in 10-year inflation breakevens by about 6-9 months, which in turn tend to peak after Global M2 YoY growth has peaked and is turning lower.
This measure also is useful for understanding what is likely to happen to financial conditions - tighter after peaks and looser after bottoms. The clearest correlation here is not to the downside but the upside: when breakevens have bottomed out and cycle higher, Bitcoin tends to do very well indeed.
DFII10 - 10-YEAR REAL YIELD
Note y axis is inverted
What is interesting here is that whilst there is not a strong correlation as real yields rise, there is a clearer correlation as real yields fall. Falling real yields tend to be supportive of Bitcoin, whilst rising real yields have occurred whilst BTC has outperformed and underperformed historically.
This one is not as key for mapping out the market cycle, but still worth keeping an eye on.

US Tariffs Drive Bitcoin & Crypto Markets DownwardsUsually, the problem with politicians is that they do not do what they were elected for. But every so often, a politician comes along who does what he (or she) says which can cause even greater problems. In the last newsletter we wrote: 'The impact of possible Trump tariffs on the economy and trading partners such as China, Mexico and the EU is a great unknown that spooks markets. In a worst case scenario, tariffs could hurt partner exports which would result in an overall economic backlash for everyone.' An estimated $10+ billion of liquidations in crypto markets as well as a major equities selloff later, this has now played out.
First things first though, lets take a step back. The first sign that not all is great in this bull market was the the DeepSeek panic on January 27th. DeepSeek, the Chinese AI company, released AI models that were trained using significantly less costly hardware than Western equivalents. Nvidia and other tech stocks led the sell-off. Cryptos, altcoins in particular, followed suit. Those AI crypto agent coins were probably not the future of AI technology after all.
The real bloodbath followed on Saturday February 1st. In a sweeping announcement, US President Trump imposed 25% tariffs on goods imported from Mexico and Canada. President Trump also imposed an additional 10% tax on imports from China and promised incoming tariffs on EU imports. Without going to deep into any economic analysis or game-theory interpretation of this move, markets did take the news badly. With equities not trading over the weekend, it was Crypto that took the brunt of the initial hit. Ethereum dropped from $3,3000 to briefly touch $2,000. Crypto total market cap dropped by around 10%.
While comparisons to the COVID crash are still far off, the blood in the streets is real. The USD notional amount of liquidations in crypto is higher than at any point, including during the FTX crash. Maybe mortgaging the house to go max-long Fartcoin was not a long-term investment strategy after all.
Only one asset has weathered the storm comparatively well: Bitcoin. Whilst BTC dropped below $100k, it did not dip much lower. But the average crypto trader today, chasing the 10-100x, is heavily underexposed to Bitcoin. The sentiment, already at a low point previously, has hit Bear market despair levels. The signs though were there for weeks. Ever faster capital rotations between 'market Metas' and ever wilder memecoin launches are usually a solid indicator of overexcitement.
Right now it is hard to feel much positivity. If one wished to look for it though, we still have not seen an ETH all-time-high this cycle. Solana has just barely crossed its previous ATH. A strongly pro-crypto US administration has barely had a full month in office. Trade wars, and even physical wars, eventually end. And as always, if the economy tanks in reaction to tariffs, Central Banks are more likely to flood markets with liquidity. These are not great things to have to hope for but it seems more likely than not that this episode will turn out to be a bull market flush, not the beginning of a bear market.

META: trend structure is approaching important resistance zoneMeta is approaching important resistance zone both in terms of macro (from 2022 lows) and mid-term (since Apr 2024 lows): 700-760 level.
Until price is bellow 760 level, my operative scenario is to prepare for at least mid-term topping action with following unfold of larger correction. Macro support levels for this potential correction are at 520-420.
From the long-term investing perspective it looks reasonable to consider hedging long-term holdings. From swing-trading perspective this resistance levels might present good risk-reward opportunity in coming weeks.
From macro-perspective, levels of 520-420 are important zone to watch for future supporting action if mid-term correction materializes.
Until price is holding above 420, macro uptrend since 2022 lows looks intact and assumes higher levels (at 1000-1300 macro resistance) in years to come.
As an alternative mid-term scenario, I might also consider price trying to reach higher resistance levels, around 800-810, before starting larger degree correction towards macro support zone.
If price moves beyond 810 level and will be able to sustain further advance afterwards, or in macro-perspective: fall below 420 level, suggested mid-term and macro structures needs to be revised.
Thank you for your attention and wishing the best to your investing and trading in 2025!

OKLO: mid-term topping potential in nuclear space The swing long set-up from Dec pullback is about to fully realize its potential
From my Dec chart archive:
pbs.twimg.com
And Jan update:
pbs.twimg.com
when I wrote: "It wouldn't not surprise me to see price pulling back bellow Oct's highs slightly and finding support on rising 8/21 emas before continuing its advance. Until price is above 21 ema, next important macro-resistance zone: 33-40"
As for now my operative scenario that price is preparing either to finish its upside momentum extending towards: 46-50 resistance zone or already have finished it and in the process of bouncing before a larger corrective way starts unfolding in the coming weeks.
If we have the mid-term top already in place, then 20-12 macro support zone might be a good place for the larger bottom to start forming before the new larger upside trend beginnes.
The same kind of pattern (bounce and new larger corrective way down) I expect to manifest itself in the coming weeks in other leading energy names (NNE, CLS, VST, GEV)
If price moves above the resistance zone mentioned, the proposed scenario needs to be re-assessed.
Thank you for your attention and wishing you the best trading and investing results in 2025!

Hyperliquid first decentralised exchange with no onramp via tradFirst Decentralised chain, feel like this consolidation will either break to the downside and do nothing or will go bananas. Looks like we can hit targets 40, 50 and beyond. This all depends on the QT and more liquidity but feel like it could happen. A strong wall of buyers at $20 level so have a feeling this will rocket after this consolidation.

Corporate earnings Versus SPXCorporate earnings and stock market getting balanced after 50 years weighted to M2 or money supply. We are entering a bubble territory.

Job Data later this week!You should be preparing for the 2 big macro events coming up this week!
On Tuesday at 10 am ET, the US JOLTS job openings data will be released.
Also, on Friday at 7:30 am ET, the US Non-Farm Payrolls data will be released.
These job data reports are crucial for deciding how the FED will cut interest rates in 2025.
If these data points are less than expected this is bullish for crypto because:
Fewer jobs = Weaker economy = Lower interest rates = CRYPTOCAP:BTC rally. (1)
Otherwise, CRYPTOCAP:BTC may be bearish in the short term until Trump's inauguration. (2)
Either way we are going higher after Jan 20th, so just prepare now!

250k Btc (with facts) Bitcoin growth across three Halving CyclesFirst Halving:
Market cap at halving: 146 million
Market cap during run-up: $18.75 billion
Run-up: 20 billion (approx.)
Second Halving:
Market cap at halving: $9.375 billion
Market cap during run-up: $300 billion
Run-up: $290.625 billion (approx., 15 times larger than the first halving)
Third Halving (hypothetical):
Market cap at halving: 150 billion
Possible market cap scenarios during run-up:
a. $1.2 trillion (already achieved)
b. $2.4 trillion (potential)
c. $4.8 trillion (potential)
Run-up (applying the 15x increase pattern): $4.35 trillion approx.
Hope you learned something :)
Follow for more

NASDAQ: Dancing on the Edge of a Techno-Financial TightropeMarket Overview
The NASDAQ-100 (NDX) has recently corrected by approximately 5.5% from its all-time high of 22,133 on December 16, 2024. This comes after a historic rally driven by resilient megacap technology stocks, robust earnings, and the continued dominance of AI-led innovation.
Despite the correction, the index remains up 18% year-to-date, outpacing broader indices like the S&P 500, fueled by optimism around productivity-enhancing technologies. However, macroeconomic and geopolitical headwinds could temper this growth into 2025.
Technical Analysis
Trendlines
Short-Term: The NDX remains in a rising trend channel since March 2023, with the lower boundary around 20,500 acting as critical support. A recent breach of its 21-day moving average suggests growing bearish momentum.
Long-Term: The index's long-term trendline, extending from the pandemic lows in 2020, remains intact, underscoring investor confidence in the broader tech narrative.
Key Levels
Support
Immediate support: 20,790 (50-day moving average).
Strong support: 20,500 (trendline and Fibonacci retracement zone).
Resistance
Near-term resistance: 21,900 (upper boundary of rising wedge).
Critical resistance: 22,133 (all-time high).
Momentum Indicators
RSI: Declining from overbought territory (currently at 64), signaling potential for further downside before resetting to neutral.
MACD: A bearish crossover suggests weakening momentum in the near term.
Macroeconomic Context
Interest Rates
The Federal Reserve has maintained its hawkish stance, with the terminal rate hovering around 5.75%. While inflation has moderated to 2.4%, core inflation remains sticky at 2.8%, keeping rate cuts off the table until mid-2025.
Elevated borrowing costs could weigh on tech valuations, particularly for growth companies reliant on cheap capital.
Economic Growth
U.S. GDP growth is forecasted to decelerate from 2.6% in 2024 to 1.8% in 2025, reflecting weaker consumer spending and tighter financial conditions. This slowdown could dampen earnings growth across the NASDAQ-100 constituents.
Corporate Earnings
Analysts expect NDX earnings growth of 8% in 2025, down from the blistering 14% in 2024, as cost pressures and a plateauing of AI-related tailwinds take hold.
Geopolitical Landscape
China-U.S. Relations
Increasing tensions over Taiwan and heightened scrutiny of U.S. tech exports to China remain a wildcard. Any escalation could disrupt semiconductor supply chains and impact heavyweights like Nvidia and AMD.
Europe
Persistent instability in Eastern Europe and ongoing energy challenges pose risks to multinational tech firms with significant operations or customers in the region.
Middle East
Geopolitical uncertainty stemming from conflicts in the Middle East has kept oil prices elevated (~$95/barrel). Higher energy costs could indirectly affect tech earnings by squeezing consumer and corporate budgets.
2025 Outlook
Base Case
The NASDAQ-100 ends 2025 up 8–12%, driven by resilient demand for cloud computing, generative AI, and green technology innovations. Support from stable core earnings growth and moderating inflation provides a favorable backdrop.
Bear Case
Prolonged high interest rates, coupled with weaker-than-expected global growth, lead to a flat or mildly negative year. Key risks include geopolitical flare-ups, regulatory actions on Big Tech, and waning investor enthusiasm for speculative assets.
Bull Case
A dovish pivot by the Federal Reserve in H2 2025, alongside breakthrough advancements in AI or biotechnology, propels the index to new highs (~24,000).
Conclusion
The NASDAQ-100 is entering 2025 with a cautiously optimistic outlook, balanced between robust technological trends and mounting macro/geopolitical risks. Investors should monitor key support at 20,500 and resistance at 21,900 as barometers of sentiment. While near-term volatility is likely, the index remains a cornerstone for long-term growth portfolios.
For 2025, the focus is on being smart: diligent monitoring, disciplined allocations, and adapting to shifting conditions.
"There are three ways to make a living in this business: be first, be smarter, or cheat." – John Tuld – Margin Call (2011)

S&P 500 Macro Outlook (2022-2024 Forecasted Targets/Tops/Bottom)3950-4K micro-target followed by the melt-up rally.
Linear top: 5325
Log top: (Separate post): 6000
Extension linear top: 6500
60-80% Bear Market follows;
Target 1: 2150
Target 2: 1555
End of Bear Market: Q3/Q4 2024 due to QE5/6, aka Infinite easing.
P.S. Disregard target 3 on the chart; Depression isn't expected this decade.

BTC Bullish pain scenarioI've been finding BTC has been following more traditional movements with the higher volumes currently being traded.
Would like to see something where we have a sustained amount of sideways accumulation allowing some more money to flow into altcoins causing mini cycles in sectors.
Would also then expect stops to be wiped out on both sides before BTC continues its move.
Hoping we make it to the 115k-120k region before cooling off.
Lets see whats to come...

Potential Macro Channel on Bitcoin to keep an eye onThis ascending channel on the monthly chart has both pi cycle tops from the last two bull runs as key touches on the top trendline. The bottom trendline has lots of important key touches too. If we break above my other big wall of channels which I have posted in a previous idea, thie top trendline of this channel would be the next price I would be looking for for a potential bull market top. By next month the top trendline of this channel wlll be around 240k. The other wall of channels I have posted in the past has a current top trendline around 120k so it would definitely ahve to find aay to break up from that one first to have a chance to retest the top trendline of this one. Gonna keep a close eye on it. *not financial advice*

Full Time Employment All Time HighsCongratulations to Trump supporters! you got what you deserve.
Americans yesterday voted for Trump because he convinced them that the "economy "feels" bad."
Nothing could be further than the truth. Never in the history of America have more people been employed. That's just a fact.
In the next four years, Americans will experience what a real "bad economy" feels like.
Don't shoot the messenger kids! I can only tell you what the charts say.

The Macro Picture Few Are Watching: Bitcoin Dominance in the FinAs we approach what could be the final leg of this bull market, Bitcoin Dominance ( CRYPTOCAP:BTC.D ) is set to become a critical indicator. Historically, a peak in BTC dominance has often preceded liquidity spillovers into the broader crypto market, igniting a wave of speculative fervor across altcoins. This time, as BTC dominance nears pivotal levels, we may be entering a similar phase, marked by heightened volatility and shifting market dynamics.
The chart suggests that BTC dominance could soon experience a reversal, signaling the start of widespread capital rotation within the crypto space. Observing BTC dominance during this period will provide early clues about market sentiment, helping investors to time entry and exit points with precision.
I’ll be closely monitoring this metric and will provide timely updates as we approach potential inflection points. This shift could begin within the next 1-6 weeks.

Charging Ahead: Tesla's Journey to Becoming the Next NVIDIA🚀 🚀 🚀 NASDAQ:TSLA Extremely bullish outlook.
The weekly chart just closed last week with a huge bullish range expansion and engulfing bar closing above previous weekly highs signaling BULLS ARE BACK. Price has now completely changed from bearish to bullish. We are now making higher lows and higher highs.
Do keep in mind that a retrace even towards $220’s is still possible, in case this happens this will be the IDEAL LONG ENTRY although it is very unlikely.
From a MACRO perspective, this is one stock that looks ready to finally pump to new all time highs so forget about short time frames trading and focus long term and build your positions by dollar cost averaging your way in.


SPY - Dissecting Option CyclesA wise man once said "follow the money"
We are not in a stock market.
We are in an option market.
In an option driven market we follow option cycles as a core driver in markets
If you want to understand where you're headed in the market you need to understand where you're coming from.

BTC Winter Outlook.It looks like bitcoin has just laid the foundations of a major trend reversal and potentially given itself the launchpad needed to push out of this 215 day consolidation structure.
Momentum appears to be shifting with the chart printing the first higher low, higher high and now a higher low with strong price action to support a continuation to the upside to AT LEAST test the upper bounds off the consolidation structure. We have also just broken into the bullish control zone on the RSI and ar working on printing the first bullish MACD histogram wick to boot.
An outcome where market makers push price down to quick-wick out late longs could still be on the cards but even in such a scenario I anticipate buyers to maintain their dominance through till the end of the year.
Happy trading!
