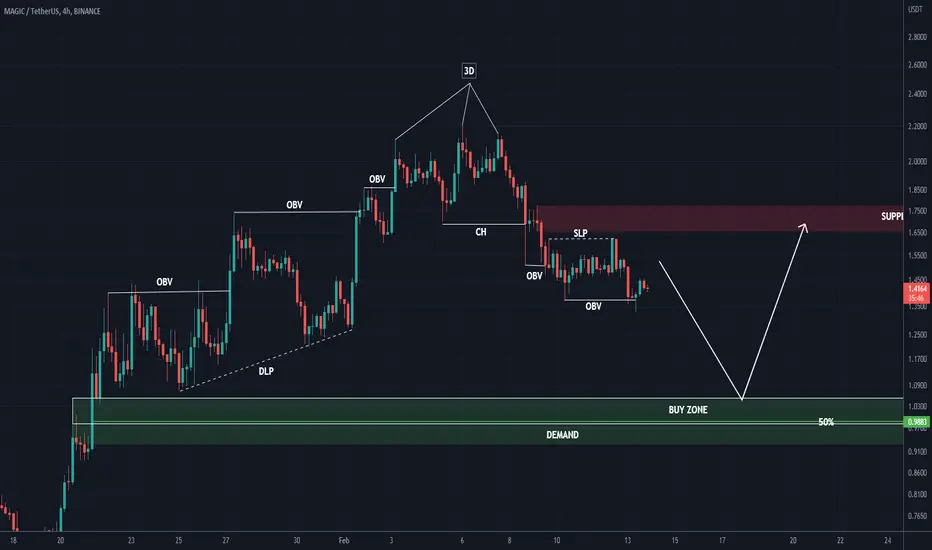
MAGIC CAN MAKE A CORRECTIONHi, dear traders. how are you ? Today we have a viewpoint to SELL/SHORT the MAGIC symbol.
For risk management, please don't forget stop loss and capital management
When we reach the first target, save some profit and then change the stop to entry
Comment if you have any questions
Thank You
Magic

MAGIC : UPCOMING TRENDThe upcoming trend for MAgic, the trend will show it this coin is able to gain the next levels as the chart shows the coming time.
For day traders it's always good to take TP in steps when the trade is into green
Some levels are for the long term.


Magic Ready for Lower LowI should have waited with my last entry. I'm happy with this swing trade as what I see as a high probability play.
There's a bearish market structure and a lower low is expected after also breaking the trend line.

MAGICUSDT setup for longIn general, Magic is in an upward trend. After a correction, the upward trend has started again and the rest of the story is clear in the chart. But this is not an Financial advice and it is only my personal opinion and it may be wrong. #DYOR

How to make money on Arbitrum?Arbitrum is one of the most anticipated and discussed projects of 2022 and 2023. The Arbitrum network is already fully launched and many users are waiting for the release of the network's native token. In addition, the Arbitrum ecosystem is actively growing and developing, with many projects appearing literally out of nowhere, capturing the market and attracting huge liquidity. But the main question for all traders is how can we make money on it?
How to make money?
All projects on Arbitrum, including Arbitrum itself, will have their own native tokens sooner or later. The more popular Arbitrum is, the higher the potential value of the Arbitrum native token and native tokens of projects that are built in the Arbitrum ecosystem is. This is the most important thing for us.
The main task of a trader is to find the most promising projects on Arbitrum, keep track of when the token appears and look for profitable trading opportunities.
Considering that our reader already has a trading strategy and knows how to trade, our goal is to tell you about the most interesting projects that you can make money on.
Prospective projects with a token
1. $GMX – a decentralized futures exchange
2. $GNS – margin trading
3. $DPX – on-chain options
4. $MAGIC – a gaming ecosystem
5. $VELA – a decentralized futures exchange
6. $RDNT – an omnichannel credit protocol
7. $MVX – margin trading
8. $GRAIL – a decentralized exchange
9. $PLS – a liquidity market
10. $VESTA – a loan protocol
11. $PREMIA – on-chain options
What to do next?
Search for good trading opportunities
Look for promising new projects on Arbitrum
Stay tuned for news on the launch of the Arbitrum native token
Check our ideas about ZK Narrative
and Asset tokenization trend
Tell us what do you think about Arbitrum in a comments section
Additionaly, write down in the comments section what narrative are you interested in the most: ZK, Asset tokenization or Arbitrum.
We will prepare more detailed info about it for you! Thanks

MAGICUSDT Resistance Breakout!MAGICUSDT (4h Chart) Technical analysis
MAGICUSDT (4h Chart) Currently trading at $2.17
Buy level: Above $2.16
Stop loss: Below $1.66
TP1: $2.6
TP2: $2.9
TP3: $3.2
TP4: $3.8
Max Leverage 2x
Always keep Stop loss
Follow Our Tradingview Account for More Technical Analysis Updates, | Like, Share and Comment Your thoughts

MAFIC Analysis (4H)Hi, dear traders. how are you ? Today we have a viewpoint to SHORT/LONG the MAGIC symbol.
For risk management, please don't forget stop loss and capital management
When we reach the first target, save some profit and then change the stop to entry
Comment if you have any questions
Thank You
Simple yet juicyAfter Magic formed a rising wedge pattern the next logical step would be to bid the area of daily support as that would complete the retracement of the rising wedge formation.
Invalidation below $1.20

MAGIC token formed bullish Gartley for upto 24.50% pumpHi dear friends, hope you are well and welcome to the new trade setup of MAGIC token with US Dollar pair.
Recently we caught more than 93% pump as below:
Now on a 4-hr time frame, MAGIC has formed a bullish Gartley move for another price reversal move.
Note: Above idea is for educational purpose only. It is advised to diversify and strictly follow the stop loss, and don't get stuck with trade

THIS IS MAGIC!Intraday setup for purchase and sale of the BINANCE:MAGICUSDT asset. The transaction must be accompanied by a short stop, or the purchase should be made in parts at each of the levels.
The goals are minimal, you can carry some higher.

MAGIC : TA VIEWMAGIC on small time frame trending idea.
Depending on the chart a view to $2 USD
If this coin is able to confirm building, then it's on the right way for the next target.

MAGICUSDT 4HMAGIC went through an accumulation period, ranging between 0.03714 and 0.04768 and soon started Elliot wave 1, formed 2 , 3 and is heading to finish wave 4 to explode to 5.
I'm watching MAGIC hold above the 200-day moving average. Which is $0.04310. This is a critical level, that is, a powerful support that we cannot leave unnoticed.
Here are the supports and resistances in the 4H:
Main support levels : 0.05379 /0.04768 / 0.04310
Main Resistance Levels :0.05884 / 0.06289
MM200: At the height of 0.04310
MAGIC is the currency of the Treasure ecosystem that serves as money between the metaverses within the common economic layer, it was designed to be increasingly scarce as it weaves an ever-growing web of narrative bridges within the Treasure metaverse ecosystem.

MAGICUSDT Ascending Channel!MAGICUSDT technical analysis update
Buy zone: Below $1.58
Stop loss: $1.37
Take Profit 1: $1.73
Take Profit 2: $1.88
Take Profit 3 : $2.10
Always keep stop loss
Thanks
Hexa

MAGIC token formed bullish Gartley for upto 26.50% pumpHi dear members , hope you are well and welcome to the new trade setup of MAGIC token with US Dollar pair.
On a 4-hr time frame, MAGIC has formed a bullish Gartley pattern for another pump soon.
Note: Above idea is for educational purpose only. It is advised to diversify and strictly follow the stop loss, and don't get stuck with trade

MAGIC ShortBINANCE:MAGICUSDT
If the price reaches or gets close to the indicated area, it is a good idea to make a short, I consider that it is a fairly safe and good trade.

$MAGIC - BREAKING THE CHANNELI would wish I could say I bought more in the channel.
I think this will be one of the biggest performers in Q1 & Q2 of 2023.
A potential 100x.
The 'Nintendo' of Crypto.
An #arbitrum-based coin with huge potential.

MAGICUSD Nearing August Resistance, may be last buy opportunityThe Magic token (MAGICUSD) is living up to its name and is rising aggressively within a Channel Up. That pattern was formed after it made a Double Bottom on November 09 2022. It has turned the 1D MA50 (blue trend-line) into Support, which was successfully tested but right now is approaching the first important Resistance of this uptrend, nearing the 1.6100 level (August 10 High).
A pull-back there to re-test the 1D MA50 could be the last buy opportunity before the 3.500 - 4.200 range, which is Resistance 2 (and April 02 High). We can determine price highs when the 1D RSI forms Lower Highs (Bearish Divergence), in contrast to the price's Higher Highs.
-------------------------------------------------------------------------------
** Please LIKE 👍, FOLLOW ✅, SHARE 🙌 and COMMENT ✍ if you enjoy this idea! Also share your ideas and charts in the comments section below! **
-------------------------------------------------------------------------------
💸💸💸💸💸💸
👇 👇 👇 👇 👇 👇


EURUSD buy to sellI do not no y but my previous idea was in private so u couldn’t see it but it’s fine I’m going to repost it now so u can see
Mystic Mac
Wizard

Magic Boom Crash: TradingView Indicator, Tested (100% Accurate)Hello, everyone. Hopefully you enjoy this our 2nd publication video.

BTC 1H TF Magic entry BTC 1H TF Magic entry for short projection
magic projection for a short entry using analysis of multiple strategy

New month, who dis? 1d/4h with +/- 10%, 25%, 50% vola filter 🌭The What:
1d chart on left shows +/- 10%, 25% and 50% levels based on the monthly atr (roughly 450 pts) and the 4h chart on right showing +/- 10% and 50% levels based on the wkly atr (roughly 186pts).
The Why:
+/- %’s levels serve as vola filters to map directional trend of a move within a given range, as well potential markers to gauge an extension in pa. Levels can also be used to identify pivots within wkly/mnthly range.
1d chart on left showing pa above hma sup, with next cycle on hma and dmi being bullish. DMI also shows no hh on di- since 1d close @ 4292, thus presenting a bull div. Break above 4188 (1d hma rt) and Indies will roll into bull x.
On right, 4h showing bull div on dmi, with next cycle on hma and dmi also pending bull x.
Stay above 1d sup @ 4110 and 4h sup 4094, and pa to push upside for marginal pump towards wkly rt @ 4280.
Algo pivs enroute to wkly rt: 4172, 4179, 4194, 4266, 4277 with 4299/4303 as feasible extensions on the wkly atr. Mind the 200 hma on 4h (currently @ 4227) for safety, and never be the last one out.
Current bias: Bullish on 1d, Wkly still bear unless it sustains 4301.
Live chart showing 1d/4h levels based on monthly and wkly atr, to be updated wkly after 1st 8h candle from Sunday open.
www.tradingview.com
Live chart showing major algo pivs upside to ath and down to pre covid rt (and lower for giga bears) on 4h (updated daily, i mean, hopefully, daily, yah alright, updated daily.)
www.tradingview.com
appreciate the risk. 🎲
