#MAGIC/USDT#MAGIC
The price is moving within a descending channel on the 1-hour frame and is expected to break and continue upward.
We have a trend to stabilize above the 100 moving average once again.
We have a downtrend on the RSI indicator, which supports the upward move by breaking it upward.
We have a support area at the lower limit of the channel at 0.1533, acting as strong support from which the price can rebound.
Entry price: 0.1560
First target: 0.1611
Second target: 0.1667
Third target: 0.1750
Magicusdtlong

MAGICUSDT Forming Falling WedgeMAGICUSDT is currently showing a highly promising technical setup with the formation of a falling wedge pattern, a historically reliable bullish reversal signal. This pattern, defined by converging trendlines sloping downward, typically signals a pause in a larger bullish trend and sets the stage for a significant upward breakout. MAGICUSDT appears to be nearing the breakout zone, and volume activity has started to increase, signaling growing accumulation and investor interest in this project.
The falling wedge is not just a visual pattern but a psychological reflection of reduced selling pressure and the potential for strong buyer interest once resistance levels are broken. With price compression occurring and the wedge tightening, MAGICUSDT could be poised for an explosive move. Historical breakouts from similar setups have often led to price increases ranging from 90% to 100%, making this a very attractive risk-reward trade for swing and position traders alike.
Beyond the technicals, market sentiment for MAGICUSDT is strengthening. The project continues to draw attention from retail traders and analysts across social media and trading platforms. This renewed focus could act as a catalyst for price momentum, especially as breakout traders and algorithmic systems begin to identify the wedge formation and position themselves accordingly.
In conclusion, MAGICUSDT offers a compelling opportunity for those watching for technically sound breakouts with strong upside potential. With volume confirming the pattern and price action pressing against the upper resistance, the setup suggests a breakout may be imminent. Keep this pair on your radar as it could be preparing for a major rally in the days ahead.
✅ Show your support by hitting the like button and
✅ Leaving a comment below! (What is You opinion about this Coin)
Your feedback and engagement keep me inspired to share more insightful market analysis with you!

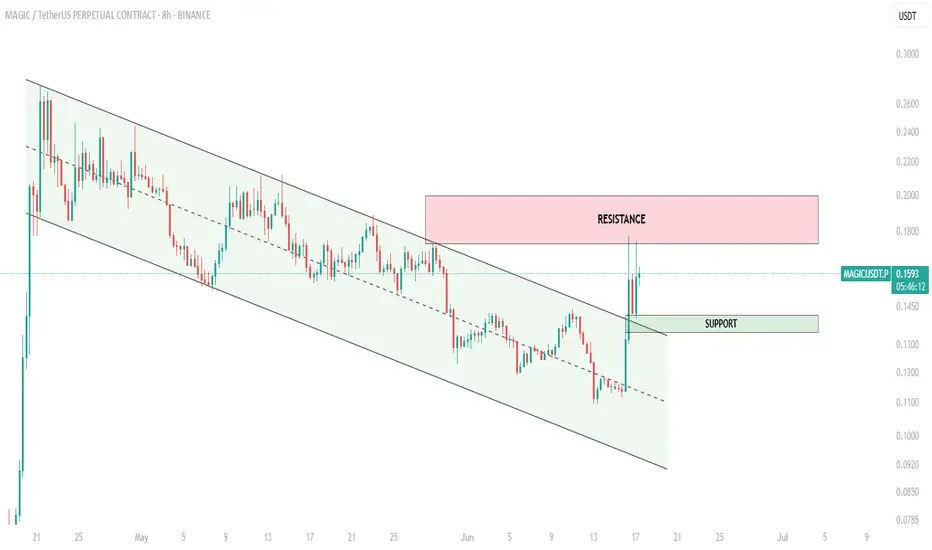
$MAGIC broke out!After weeks of grinding inside a falling channel, OMXTSE:MAGIC finally broke out with a sharp 20% move!
- Channel breakout confirmed
- Price reclaimed the support zone around $0.145
- Resistance zone ahead: $0.185–$0.20
Now it’s all about momentum. If bulls hold above the breakout area, we could see further continuation toward the upper resistance.
Trade smart — avoid FOMO. To ride the wave further, wait for a retest or clear strength above resistance.
This is how a clean technical structure plays out.
$MAGIC Trade Setup Alert!Bull flag breakout on OMXTSE:MAGIC — and we’re eyeing a beautiful move next! 👀📈
Price is testing breakout levels right now with solid bullish momentum.
🎯 Targets:
• TP1: $0.2037
• TP2: $0.2731
• TP3: $0.3996+
🛑 SL: $0.1547
📌 Entry Zone: Around $0.1710
Breakout traders, this is your cue!

MAGICUSDT 1D AnalysisMAGIC ~ 1D Analysis
#MAGIC Buy gradually after successfully breaking through the resistance line of this pattern with a short-term target of at least 10%++

Do you like to see some magic!? / (MAGIC long setup)BINANCE:MAGICUSDT
COINBASE:MAGICUSD ]
Hello Traders
💥Long position on MAGIC
SL1 ---> Low-risk status: 3x-4x Leverage
SL2 ---> Mid-risk status: 5x-8x Leverage
👾The setup is active but expect the uncertain phase as well.
➡️Entry Area:
Yellow zone
⚡️TP:
0.3587
0.3683
0.3789
0.3915
🔴SL:
0.32
🧐The Alternate scenario:
If the price stabilizes below the trigger zone, the setup will be cancelled.

MAGICUSDT 1WMAGIC ~ 1W
#MAGIC The decline occurred already -80% from the highest peak.
It's time to start accumulating again, with a short term target of at least 20%+ from here.

MAGICUSDT 1WMAGIC ~ 1W
#MAGIC The decline occurred already -80% from the highest peak.
It's time to start accumulating again, with a short term target of at least 20%+ from here.

🚨#MAGIC/USDT LONG#MAGIC
The price has been moving in a bearish flag since last March
That flag was broken higher and the Moving Average 100 was broken
Current price 0.9373
The first goal is 1.06
The second goal is 1.55

MAGICUSDT Good Buy!MAGICUSDT Technical analysis update
Buy zone : Below $1.285
MAGICUSDT price has formed an ascending triangle pattern. The price is nearing the resistance line, and a breakout could indicate potential upward movement in MAGIC.
Support : $1.175
Resistance 1: $1.38
Resistance 2: $1.60
Resistance 3: $2.00
Always keep Stop Loss

MAGIC/USDT AnalysisI'm excited to share an analysis on MAGICUSDT that appears quite promising. Currently on a bullish trend with consistent buy signals, Magic seems poised for an intriguing move. Taking into account recent Bitcoin movements, our projection places Magic in the highlighted zone captured in the attached photo, roughly ranging between $0.76 to $0.77.
Trade Plan:
Target Price: $0.76 - $0.77
Expected Gain: 30%+
Risk Management: 5%
The risk-reward ratio is meticulously set at 5% risk for a potential gain exceeding 30%, a risk deemed acceptable given the current market conditions. For a detailed look at the potential stop scenario, please refer to the attached photo.
It's important to clarify that this isn't financial advice but an analysis we believe deserves consideration. As always, your individual decision-making is crucial. Whether you choose to join the position or not, it should align with your own assessment of the market.
Wishing everyone a profitable trade!

MAGIC target 0.734h time frame
-
MAGIC just broke out the downtrend line. It is creating a bottom structure and retesting the support zone around 0.55. If MAGIC is doing the potential symmetrical, we can see it reach 0.73 soon, and there are higher targets.
TP: 0.73 / 0.8 /0.9
SL: 0.525

MAGICUSDT - Double Bottom Pattern!MAGICUSDT (1D Chart) Technical analysis
MAGICUSDT (1D Chart) Currently trading at $0.594
Buy level: Above $0.595
Stop loss: Below $0.5
TP1: $0.65
TP2: $0.75
TP3: $0.88
TP4: $1
Max Leverage 3x
Always keep Stop loss
Follow Our Tradingview Account for More Technical Analysis Updates, | Like, Share and Comment Your thoughts

MAGICUSDTTime to rebuy BINANCE:MAGICUSDT
"Daily crypto market analyses I provide are personal opinions & not financial advice. Trading carries risks, so do your own research & seek advisor's help."
Don't forget to like and comment

MAGIC pump target 2.21D time frame
-
MAGIC is retesting the wedge structure.
Once the support works and go over 0.873
The pump trend will continue go.
TP: 2.2~2.4
SL: 0.59

$MAGIC Falling WedgeOMXTSE:MAGIC Falling Wedge Breakout has Confirmed on the Daily timeframe Chart..!!

MAGICUSDT may head up for resistance around 0.8336-0.8520The price is trading in a zone where it experienced free fall on the recent drop a few day ago. The next resistance for the price is 4h resistance 4HR1 as marked on the chart. This resistance zone sits around 0.8336-0.8520. The probability of the price to aim for this 4h resistance is high. Therefore a long is favorable here. However, there is a reasonable probability of the price to revisit the support zone below specially 4h support 4HS1 and probably 4HS2. Therefore, a better entry for the long would be those levels.

MAGICUSDT.P Bullish 1H TFThis script shows high probability of bullishness at 1H TF. No divergence found.
