Buy MANA ⬆️Mana and other metavers currencies have corrected so well and now MANA has broken its trendline.
This is best time to buy
Mana

MANA could be headed to $3Anything could happen, and we could reverse at any time, but MANA seems to be breaking down from this symmetrical triangle, and could re-test the $3 range. "metaverse" coins are a hot play, but the chart is showing weakness to me.
This is not financial advice, do your own research

MANAUSDT - is going to pump?BYBIT:MANAUSDT
1H trend chart
-
MANA had gotten resistance at Fib 0.5, but already broke it out and being support level now.
Also, it got rid of the downtrend line, and we can take entry here(with tight SL),
Another entry scenario is that wait it to retest the key level
If we open position here, trading strategy as below.
-
Profit Targets:
a) 3.5681----Fib(0.5)
b) 3.89----Blue horizontal ray
Stop losses:
a) 3.310-----Red horizontal ray
-
If you like this analysis, smash the "like button" and leave a comment below to share your thoughts
or let me know what crypto you want to see!
Trading is a reflection of yourself. Learn more daily and be ready for every opportunity.
Have a nice trading!

$MANA finding supportMANA is currently using the 50 day MA as support.
It is oversold on the RSI. MACD’s histogram and lines are curling upward.
People are saying web 3 and all this meta verse stuff is overcooked but it is the future.

MANA testing supportMANA has been falling in price for a long time, this is due to the situation with BTC, the strong influence of BTC often changes the trend of other cryptocurrencies, so you need to use stop loss

Bull run only mid-way?Each colored 'X' represents a point before a significant increase that retraces to its original price. 2017, 2019, 2020, 2021, 2021 show that as the crypto space grows, the frequency of pumps does as well. I don't believe that crypto winter will always be the same. How would we know the length without data? More than that, time as a function is pretty ambiguous in a bull or bear market. What does matter is growth and interest. The chart shows the industry is growing fast, and the amount of money shows the interest. There are cooling-off periods, and from this chart, those cooling-off periods are becoming shorter and shorter. Furthermore, the impulses don't have to be proportionate. I want to know when the Bull run is coming to an end so I can prepare. I am definitely not the type to think that "hoping" will have any impact on the market...because that is how you miss the peak. If anything, I tend to trade conservatively, missing the top few percent of any major trade. Too much data points to BTC Bull run ending in Aprilish and Alt-season extending through August. You may have to scroll to 2017 and this is definitely not financial advice.

Bearish short term but Bullish long termWe saw from my last analysis when I said we may revisit the $3.2 range. However, during the dumping time with BTC downside, and all senate talk about future of crypto, there are many things people have let it slide away.
Decentraland just is the Patron of Blender Development Fund, the Blender is the major 3D model creator that is free for use by anyone under GNU. Meaning you can legally use the software to create any figures or anything and sell it without string attached to the Blender. If you saw the NFT hype, then you would need to understand the underlying violation of copyright and the right of usage of certain software to bale to make monetize out of it. It is basically a strong legal battle that surely uncle Sam/ big Coop will win if you accidentally use the crack software or non-commercial software to create the NFT for monetization. Blender is the one under GNU licencing which is free for most of the meaning of usage. So Decentraland is the supporter of Blender which facilitate the growth of NFT items in the metaverse.
Decentraland just pumps out the Golf course in the Vegas City within Decentraland. Here not only you can gamble but practice your golf skill with your VR set.
Decentraland can take any NFT to be put into their world. One of the main reasons for the Nov 30 run of MANA is because SAND items were ported into the Decentraland world and used for the festival event.
And here we are at the spot where MANA is going lower than $4 after an attempt to go higher. I would consider this is a long position where the MANA might try to break the trend downward, but as it gets lower, it is a better price to accumulate for the next bull run!
This is not financial advice, but my perspective of the current trend of Decentraland!

MANA (Decentraland): 10.DEC.2021 (HODL)Examining the #MANA , we see that the price has reached a strong support range and is one of the lowest risk cryptocurrencies on the market for investment. I suggest you have a personal review on it for buying and invest and if you already have it, I suggest you to keep it (HODL) .
MANA Price Live Data
The live Decentraland price today is $3.49 USD with a 24-hour trading volume of $985,615,790 USD. We update our MANA to USD price in real-time. Decentraland is down 4.51% in the last 24 hours. The current CoinMarketCap ranking is #27, with a live market cap of $6,375,120,502 USD. It has a circulating supply of 1,824,595,435 MANA coins and the max. supply is not available.
Follow our other analysis & Feel free to ask any questions you have, we are here to help.
⚠️ This Analysis will be updated ...
👤 Arman Shaban : @ArmanShabanTrading
📅 10.DEC.2021
⚠️(DYOR)
❤️ If you apperciate my work , Please like and comment , It Keeps me motivated to do better ❤️

SANDUSDT (SANDBOX) : 10.DEC.2021 (HODL)Examining the #SANDBOX , we see that the price has reached a strong support range and is one of the lowest risk cryptocurrencies on the market for investment. I suggest you have a personal review on it for buying and invest and if you already have it, I suggest you to keep it (HODL) .
SAND Price Live Data
The live The Sandbox price today is $5.25 USD with a 24-hour trading volume of $1,630,667,641 USD. We update our SAND to USD price in real-time. The Sandbox is down 2.99% in the last 24 hours. The current CoinMarketCap ranking is #38, with a live market cap of $4,793,018,383 USD. It has a circulating supply of 913,364,619 SAND coins and a max. supply of 3,000,000,000 SAND coins.
Follow our other analysis & Feel free to ask any questions you have, we are here to help.
⚠️ This Analysis will be updated ...
👤 Arman Shaban : @ArmanShabanTrading
📅 10.DEC.2021
⚠️(DYOR)
❤️ If you apperciate my work , Please like and comment , It Keeps me motivated to do better ❤️

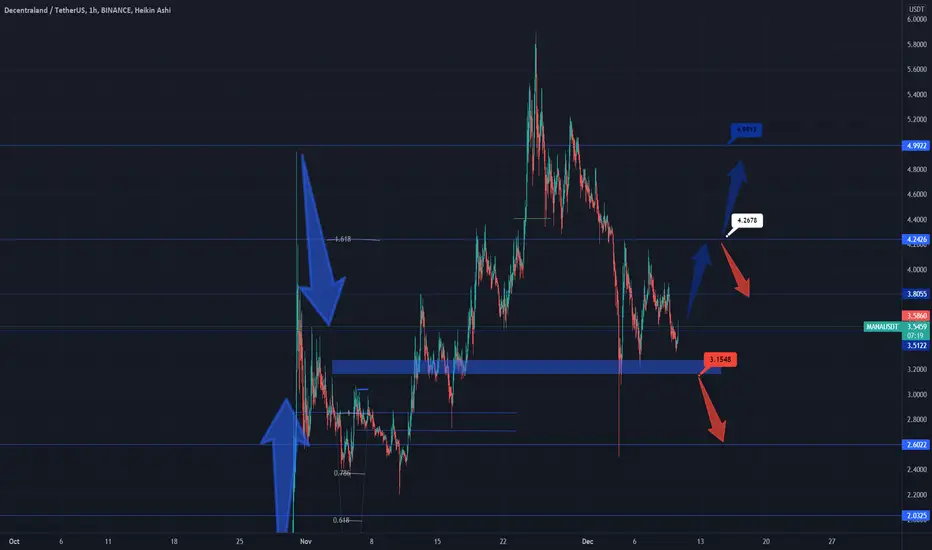
MANA- ⛔Got to Know These levels! ⏫MANA, Decentraland has been feasting on the Metaverse Hype/future but again, price is volatile so we got to knwo the levels.
Here is our updated chart with the levels you need to know.
Please also take a look at competition (Sand, Blok, Metahero and others) and do your math.
3 Reasons to Buy Decentraland if you are a fool :
Investors looking for exposure to the metaverse may want to consider Decentraland.
Key Points
Decentraland's status as a leading metaverse game could drive the adoption of MANA.
Institutional investors are attracted to Decentraland's offering, creating big price movements.
Decentraland's growth prospects may outweigh the risks for longer-term investors bullish on the metaverse.
One Love,
the FXPROFESSOR
(The professor prefers SAND and Metahero)
NICE #FRONT :)I expect it to be a surprise. I think its current price is too low because its supply is very low. I hope #front gets a good upswing soon. What I write and draw is not investment advice. :)

Bitcoin [BTC] - Decision Area! This will determine what's next..After dropping to this Support/Demand area... Bitcoin has hung around the past couple of days. If it was going to continue up, we would be out of this area by now. This is the time for Bitcoin to make a strong statement if we are going to continue up soon. If we keep hanging around this area... or worse... drop below the previous low on the dip, this could drag out for a couple of more weeks. Anyone who has been invested in crypto over the past year or longer understands how it goes.... HODL through the strorm.... diamond hands always prevail. Not financial advice.

Mana throwback then bounce$mana #Decentraland Looks like $sand. Retest in progress and close above 4.1 would signal move to the upside with 49% to ATH potential.
Possible path based on fib levels listed.
——————————————————————————————
Top 10 trading tips:
1. DO NOT FOMO into PUMPs.
2. Set a strategy and be consistent. The more you use the same strategy with the same $$$ amounts, you will be able to identify the winning set ups quicker and you will need to win less trades to be profitable over time.
3. Let your winners run and cut your losers short.
4. You will not win every trade, but if you are disciplined with great RM you don't need to be right all the time to win!
5. Before you enter a trade, make you know your target (or take profit target and let the rest ride) AND your exit strategy.
6. When you are up, you can use a trailing stop or trim off some profit at a logical resistance point with a stop loss at breakeven.
7. It is hard to deal with emotions when trading, set parameters up front so you keep your self accountable. (stop loss, take profit levels, etc)
8. Don't fight the trend. The trend is your friend.
9. Use multiple indicators to confirm your TA on price action.
10. Only trade what you are willing to lose. It will be hard to trade without emotions.
Please note:
- This is not financial advice.
- I do not take every trade I post.
- Never trade off of someone else's chart until you DYOR!

Long Mana In case BTC Stay above 49I00 and don't break down at 48980, wich will invalidate the LONG Mana.
Mana will go up with a strong similarity to what Gala did a couple hours ago.
Trade one : Mana 3,84 to 4,II.
Trade 2, wait for the rebound : Mana 3,88 to 4,4788

$BTC Started to Fall Excatly as i predicted ...As we expected, the price has started to fall exactly according to the previous analysis ... The bearish targets are $ 47,700 and $ 46,500, respectively.
Note that the two levels mentioned above are potential Reversal Zone (PRZ) , and if this support range is lost , the next targets will be $ 44,400 and $ 43,000 .
Follow our other analysis & Feel free to ask any questions you have, we are here to help.
⚠️ This Analysis will be updated ...
👤 Arman Shaban : @ArmanShabanTrading
📅 09.DEC.2021
⚠️(DYOR)
❤️ If you apperciate my work , Please like and comment , It Keeps me motivated to do better ❤️

MANA ANALYSISMana has made all time high and is facing correction right now. It is getting closer to EMA50 as its main support. If MANA stays up ~3.2 it can make more higher high but if it cannot settle down we look for short for now who did not sell when it had a train break (~4.5) hold till 3.2 .

as "gaming" and "play to earn" has gained massive interests in cas "gaming" and "play to earn" has gained massive interests in crypto industry & metaverse SLP has bright future & it's about to boom in a few days.

MANA consolidation phase in 1hAfter checking a couple of timeframes i found som key points in chart, even that we can see 2 rejection attemps in bullish moves so for now we can just wait for "zona de compra 1, 2" (buy zone 1,2) on order to have any earnings in a LONG but again we need to wait because consolidations can broke your LONG/SHORT position.

MANA 30% move incomingHello all. There is no major change in mana chart since my last update so i will keep this short.
Mana has formed a symmetrical triangle which is more vivd on the 4hr chart. This pattern has equal chances of breaking upside or downside. The apex of the triangle is very close, and will break on or around December 10th.
Depending on BTC's performance, Mana will either break up towards the fib golden pocket, or retest the previous low.
But what an over sold RSI we have on the daily. Makes me want to open more longs.
Mana also trades above the purple resistance line of the descending channel and above the 50 day EMA.
I see equal chances of breaking upside or downside so be cautious on this one.
Check out my other charts on mana if you missed my previous updates.
Thanks for reading, and stay tuned. Enjoy.

$Mana Daily LongHi
So on my previous chart, Mana moved to 3.6 area
Now if we manage to consolidate, we can see a really good pump, otherwise if we lose 3.5 we'd be looking at 2.4-2.6 zone
Still learning and trying things that's why I added the Eliot wave, don't really know if it should work that way
Trade Safe
DYOR

Decentraland Analysis [November 14, 2021]AB=CD pattern, Fibonacci retracement tool were greatly implemented in analyzing this one (1) day candlestick timeframe (TF) chart.
The picture explains it all.
AB = CD pattern & FIB are saying take profit around $6.6 zone.
At carefully observing the price action, an almost concluded symmetric triangle and a bullish flag pattern can be seen in formation.
Feel free to comment.
Kindly note this is not a financial advice. As we know, the cryptoverse is a highly volatile world. Do your due diligence.


