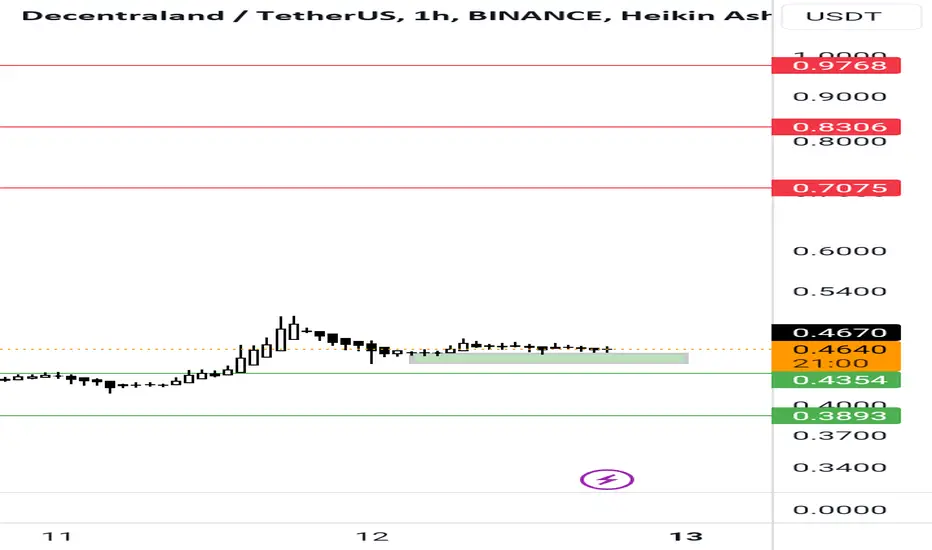
Be careful crossing the bridge!The probability of growth for this currency is higher, but it is possible to have a correction to the first support range.
If the first support range is lost, the most important support range is the price of 0.4646, the possibility of growth from this range can be higher, but if this range is broken, this pattern, i.e. the corner pattern, will be formed and we can see more fall.
Therefore, if it reaches the second support range, the analysis should be updated.
But what is possible for now is a rise to the first resistance area, which is the price of 0.5498
Mana

MANAThe first targets that can be considered, if the green lines are not broken, are the red numbers

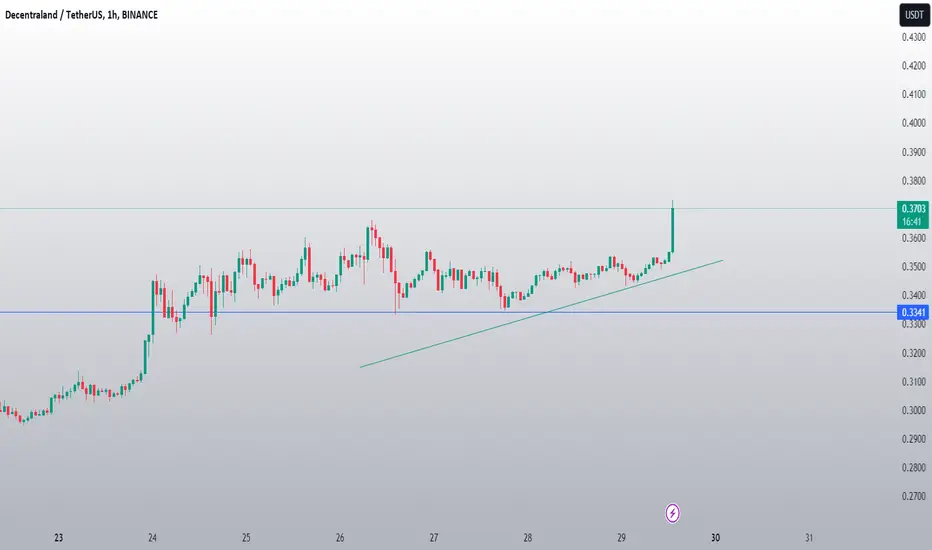
MANAUSDT Trend Line Breakout!MANAUSDT Technical analysis ypdate
MANA's price is approaching the trend resistance line, and volume has been gradually increasing over the past month. If the price breaks out above this resistance level, we can expect a significant upward move.
Regards
Hexa

MANA Suggests SAND will Push HigherComparing these charts suggests SAND will go higher to follow MANA. They both are following the exact price action, and MANA is currently retesting 200ema, whereas SAND is lagging behind.


🔥Bitcoin Is About to Make a HUGE Move:$47,000 or $23,000 first❓🔥My thought on Bitcoin and amazing opportunities for my followers. Watch the video till the very end!
like❤️ and follow

MANA/USDTEURONEXT:MANA really nice setup here for a breakout trade set alert on resistance, I have measured target of the falling wedge pattern!

MANA/USDT Anticipating Bullish Momentum?👀🚀MANA Today Analysis💎 Paradisers, direct your attention to MANAUSDT as it exhibits a notable pattern, suggesting a strong probability for a bullish move.
💎#MANA historical performance reveals a tendency to adhere to a descending channel pattern, with a break above leading to an upward trajectory. Presently, it is demonstrating a bullish stance. The critical level to watch is $.4244; maintaining momentum at or above this level could indicate a bullish continuation.
💎Should it fail to hold, the next focal zone is at $.3931, aligning with the observed pattern trajectory. #MANA sustained upward momentum is targeting a resistance level at $.4968, with the potential to rise further towards supply levels at $0.6932.
💎 Furthermore, prepare for a potential bullish resurgence from the support level of $.3581 if #MANA does not sustain its upward momentum. A drop below this level could raise concerns about the viability of the ongoing bullish trend.
💎 In the current dynamic and fluid market environment, strategic planning and discerning decision-making are critical. Developing a comprehensive trading strategy, incorporating effective money management, and a deep understanding of support and resistance levels, is essential for achieving sustained trading success. 🌴💰

manaBy keeping the green box, the above numbers are activated
If the green lines are broken, then it should be checked

MANAUSDT - Might PUMP today!MANA - I love this token I got it on the last Bull Run and topped up at $0.25 at the bottom again.
I feel the #metaverse will play a big part in the everyday life of humans soon!
Think it might rip a little today as well check my chart for more information!

Decentraland (MANA) setup for upto 18.50% pumpHi dear friends hope you are well and welcome to the new trade setup of Decentraland (MANA) with US Dollar pair
Previously we caught almost 17% pump of MANA as below:
Now on a 4-hr time frame, MANA has completed a bullish Gartley setup for the next price reversal.
Note: Above idea is for educational purpose only. It is advised to diversify and strictly follow the stop loss, and don't get stuck with trade.

ManaIn the down time, the green box is considered as support, and in case of failure, the green line is the best target and the resistance is the red line.
MANA elliot wave analysishello
Can you find as perfect as this wave count for MANAUSDT?
Tell me what in your mind is

MANA LONG SETUPMana is inside a large diametric that is now completing the ascending branch of F. the last falling wave that we expected did not form and was pumped.
We considered the final pattern to be diametric, but this pattern was triangular.
Now the resistance that has been broken is a strong demand. If the price returns to this demand, it is a good position for a buy/long position When the price returns to the green area, you can look for buy/long positions
This is an update of the analysis in the relevant section
Linked
For risk management, please don't forget stop loss and capital management
Comment if you have any questions
Thank You

MANA finds support!After almost hitting $0.39, MANA found support at $0.355, a trend line that began in August 2022! MANA has since rebounded, pushing $0.42 and may retrace to $0.38 area before heading to $0.52 zone, and then $0.70. These ideas are my own and you should do your own research. MANA is not simply responding to the overall crypto market. They have recently partnered with Mastercard for transactions, and a bridge network with Sandbox.

MANAUSD above the 1D MA200 after 6 months. Bullish confirmed.Decentraland crossed today over the 1D MA200 and if it closes the day there, it will be the first time since April 22nd 2023 to do so. It may remain inside the 10 month Channel Down but crossing over the 1D MA200 where it had the last major rejection (June 5th) is strong enough to cause a breakout. Especially since this rally originated on a 1D RSI Bullish Divergence.
The overbought 1D technical outlook (RSI = 73.919, MACD = 0.023, ADX = 49.040) may cause a minor rejection near the R1 level but we expect to hit R2 (TP = 0.53450) before the end of the year. The only condition is for the 1D MA50 to hold.
## If you like our free content follow our profile to get more daily ideas. ##
## Comments and likes are greatly appreciated. ##

$SAND vs $MANANYSE:SAND vs EURONEXT:MANA
Boy was I wrong on #Sandbox. But that's why you cover trades at support, good move, as it ended up going much lower.
Both have been crushed during the bear market but @decentraland has outperformed @TheSandboxGame.
Compare the highs of NYSE:SAND vs EURONEXT:MANA & they're at a similar in price now!
Diluted mkt cap is better on NYSE:SAND 70% vs what it was before, last unlock was brutal, but not as good as EURONEXT:MANA 82%.
Still like both projects, final comparison:
MANA put in LOWER 2021 LOW
SAND HELD 2021 LOW
#P2E #P2EGame #crypto

MANA/USDT Had a Good Bull Rally | What's the Next Move? 💎Yello, Paradisers zoom in on MANAUSDT! It's currently tracing an ascending channel, suggesting a potential adjustment due to the looming supply zone.
💎Lately, Decentraland has maintained a steady climb within this upward channel. Yet, a shift or correction might be on the horizon. It's essential to highlight that MANA is navigating towards a crucial support mark at 0.3445.
💎Beyond this point, there's a distinct supply zone marked by an untouched OB. If MANA descends past the support, it's poised to gravitate towards the demand zone indicated on our chart.
💎Enhance your trading decisions for Decentraland with ParadiseFamilyVIP. Dive deeper into our expert insights on MANA and other promising coins, refining your crypto approach.

MANA INCREASE VOLUME FOR DAYMANA SEEMS TO HAVE NEW increases for the day trade.
it's at this moment the running one.
The last running one for day trading.
MANAUSDTMana range high liquidity taken now aiming for range low liquidity,
Target marked in Blue boxs lets see how far we can get
DXY looking bullish and back into range..

MANA Accumulation phase. BINANCE:MANAUSDT
Last time Mana spent more than 150 days in accumulation zone before uptrend move. Probably if we find out resistance at sellers zone (marked red block) locally, we can drop once again to buyers area (marked green box)
Mana lost 86% since ATH so its good time to accumulate Mana now step by step. If you worry about your investments you can fix 50% of your investments in Mana at sellers zone and leave free coins.
Now we only 80 days in accumulation period, so probably by end of October/November we can formed final bottom and start climbing up.
On chart we can see now so low volume on both sides.
We retested 0.618 Level by FIB on D1 Timeframe and going out of downtrend line, so yes, hypothetically we can trade 80 days more in sideway.
Hope you enjoyed the content I created, You can support with your likes and comments this idea so more people can watch!
✅Disclaimer: Please be aware of the risks involved in trading. This idea was made for educational purposes only not for financial Investment Purposes.
* Look at my ideas about interesting altcoins in the related section down below ↓
* For more ideas please hit "Like" and "Follow"!

$Mana : Advanced Analysis of Potential Trend Reversal!
"Unlocking Cryptocurrency Insights:"
In the realm of sophisticated technical analysis, Mana, a cryptocurrency of interest, is currently in the throes of a breakout from a meticulously observed weekly triangle pattern. This pattern signifies a pivotal juncture in price dynamics.
Moreover, the formation of an Inverse Head and Shoulders pattern, consisting of left, head, and right shoulders, is now on the radar. This pattern is renowned for its potential as a market reversal indicator. However, the fulcrum of the analysis pivots upon the forthcoming Bitcoin halving event, a seminal occurrence in the cryptocurrency domain that profoundly influences market sentiment and trajectory. s3.tradingview.com s3.tradingview.com BINANCE:MANAUSDT

MANA is about to explodeYou are with MANA review
MANA has been in a price-time correction phase for a very long time. By examining MANA waves, I came to an interesting structure
We have a large diametric, which is now the analysis image for branch E of this diametric. Branch E itself has become a diametric. Looks like we are now in wave g from E. The g wave of E also appears diametric.
If the price reaches the green box, it is a great buy position.
For risk management, please don't forget stop loss and capital management
Comment if you have any questions
Thank You
