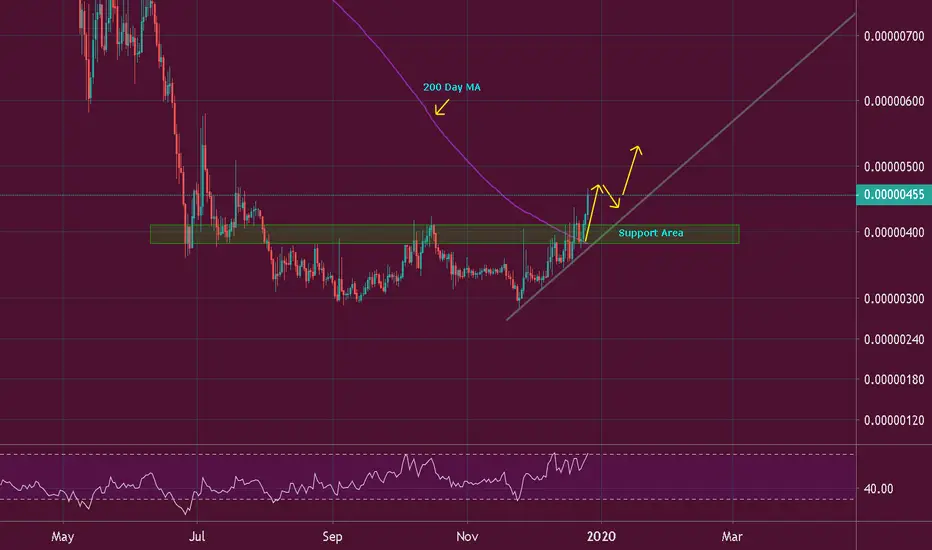
MANA/BTC Bullish Breakout Chart #MANA/BTC Chart Update:
Current Price of MANA/BTC is 411 Satoshi.
#MANA Now Looks good For fresh Setup.
already Breakout Confirmed and Candle closed above Trendline Resistance.
Entry: 400-412 Sat
Targets: 464/537 Sat
SL: if any candle close bellow 384 then exit.
Please like and follow me for Latest Crypto updates.
Thank you
Manausd

DECENTRALAND - long term viewWe are possibly looking at reversed H&S here. Let's see how this one plays out.


MANABTC: Public Launch and Likely PumpBought a little, first target 790 satoshi. Stop is wide but I'm watching the trade closely.
Decentraland, the first ever blockchain-based virtual world, is going live to the public, on 20.02.2020. So, this news can be a catalyst for further growth or protection from falling. 'Buy the rumor'
Information is just for educational purposes, never financial advice. Always do your own research.

MANA | Swing longMana looks very strong in 2020 and going to play it as a swing play.
- Recent breakout has been successfully re-tested and price should hit 600 sats in Q1 2020.
- Price also crossing 100, 200 DMAs for the first time since the long downtrend.
As you can see, the price has been consolidating from August - December 2018. Right now there should be a distribution so I have outlined three main levels where the price should reach (3rd is less possible).
- Remember one thing, all alts can look promising but once Bitcoin will get bigger pump +8-15% then altcoins will start immediately bleeding. So always protect your capital and put your stop into safe zone as soon as possible.

MANABTC Technical AnalysisMANA Looking good Now For Long Entry.
Bullish Looking and now bounce back from Support level.
strong support at 370 Satoshi.
if we break this support then we can see 313 satoshi in short term.
But we overall bullish at this time.
Exit when support break 370 Satoshi.
Buy above Support area.
Targets: Target 500 Satoshi.
And also keep an eye on btc dominance.
If btc dominance will increase then we can see some down price of MANA and we can buy under 380 Satoshi.
Like follow and Share guys.

MANA/BTC TA Update (Retest 200 Day MA?)MANA/BTC
MANA broket key ascending trend-line of support at 430 sats area and the price fell to key support 380 sats.
The price could still drop further to 370 sats are to retest the 200MA or the golden Fib levels.
I'm not yet interested in opening a position since the downward momentum is still strong.
I'll wait for the price to cool down or reached my target buy zone before looking for an entry.

MANA/BTC Chart Analysis Golden CrossedMANA/BTC Now Looking good for fresh setup.
Now current price of MANA/BTC is 418 Satoshi.
Entry :400-420 Satoshi
Stop Loss: 390 SAtoshi
1day time frame Bullish golden Crossed happened .
Targets : 30%-50%-100%

MANA/BTC TA Update (New Uptrend Started?)MANA/BTC
MANA bounces off right at the 200 Day MA and currently, the price is skyrocketing new High. The RSI level is about to enter the overbought condition. We may see some pullback retest of old resistance turning into new support at around 410 sats area. Initial target resistance is between 500 - 580 sats regions in case of an over-shot pump. For me, I would love to see another healthy pullback to establish stronger support during its growth in the future.
MANA / BTC Formed figure Bowl (Saucer) First target + 110%Perhaps a Bowl figure will be formed (Saucer, Rounded Bottom). Target of the figure + 110% Price at historical minimum. 4 months in lateral movement. Price begins to rise slowly. It seems that we are at the beginning of the 3rd phase of the formation of the "Bowl" figure.
The first Sales Goals are the “Bowls” resistance level zone. 600-670 satosh.
Further on the situation, how the price will fix. Other target levels are the levels of the previous horizontal channel that existed for more than a year. 900, 1200, 1500, 1800 satosh.
Stop Loss - the level of support of the "Bowl". (red level) - about 300 satoshi
___________________________________
I will describe this figure a bit:
The Saucer shape, or as it is often called the Chalice, the Rounded bottom is a long-term figure that predicts long-term growth that looks like a concave arc. The figure is found on large timeframes. In most cases, on weeks, but on instruments that quickly go through their cycle (cryptocurrency), they can occur on a daily timeframe.
The rounded bottom is quite rare, but very reliable bullish pattern. Typically, a pattern is formed at the end of a long-term “bearish trend” and usually gives a signal of a market reversal.
It should be noted that the ideal symmetry of the figure is not a prerequisite. The main thing is the presence of its key components: the descent of the price, the bottom, the rise in price and the breaking of resistance.
Ideally, the formation of the “Saucer” pattern usually occurs in a narrow price range, in a calm market with the least volatility, when a trend reversal occurs smoothly, without strong price spikes. If, however, price spikes occur, then very soon the price will return to its usual range. The figure signals the long-term nature of the formation of a trend movement. The longer the figure forms in time, the stronger the signal is considered. The most reliable are the figures formed on weekly charts for at least several months. The older the time frame, the more reliable the signal. The rounded bottom is a long-term figure, and can stretch on the chart for a long period.
_____________________________
Stages of the formation of the figure.
The Saucer figure consists of the following steps:
1) The descent of the price is the first phase of the figure . Price decline trend with a gradual slowdown. In the classical case, it should be a smooth arc, but in practice its shape can be flat or contain, on the contrary, correction minima and maxima. The main condition in this case is the gradually decelerating pace of price reduction.
2) The bottom is the lowest point of prices . It is the geometric center of the figure. It should be located on a gentle bottom (smooth bottom, without peaks). Although sometimes such a formation as the "Thorn" down or closed squeezes comes across at the bottom. The main thing is that these local formations do not violate the overall picture of the figure and movement in the global. If the lower point of the price forms the so-called platform on the chart, then the trading volumes gradually decrease, and at the moment of the price jump up sharply increase. Another surge in prices may be a signal to buy if the maximum of current prices is higher than the previous maximum.
3) Ascent of the price - after the minimum follows the ascent, which should ideally be symmetrical to the descent, and should last as long as the first phase (the descent of the price). There is a tendency to increase prices with a gradual acceleration.
4) The intersection of the resistance formed by the upper boundary of the whole figure (passes through the maximum point of the figure at the beginning of the period of its formation) is an additional confirmation of the rounded bottom and the final phase of the formation of the figure. After breaking through and fixing the price, the resistance level turns into ur
_______________________________
Setting sales targets when working with a figure.
At the expense of selling goals, there is no exact opinion among traders. You need to understand that this is a long-playing figure and has a pronounced bullish character. In most cases, phase 3 (price rise) ends with phase 4 breaking through resistance and fixing the price above it. Thus fully confirming this figure of technical analysis . But you need to understand that this does not always happen! There are exceptions.
It is also important if the price is being traded in your favor, and according to the plan you should already fix the profit, then it is advisable to stay in position while you get additional profit instead of the planned one.
There should be a strategy and plan. At the same time, your strategy and plan should be plastic from market situations.
I trade such formations like that. As a rule, I enter the 2nd phase on the “Day”, but then when the trading volume starts to increase (the beginning of the 3rd phase is the ascent). It is very important not to "stay at the bottom" for a long time. Time is money.
I leave the position in 2 stages according to the situation:
a) I sell a large part of the position at about 70% just before the resistance (before the start of phase 4).
b) if the price failed to break through or gain a foothold, I will sell the remaining 30% of the market.
c) if the price was able to break through the resistance and consolidate. Resistance has become support. I buy back at the pullback prices the same 70% that I sold in advance before the resistance. Very often the price differs by a couple%. The confirmed new support gives great potential for further growth. It is very important that there is not a big gap between the sale and the purchase. If the price after confirmation of support has gone high - I trade the remaining 30% of the position.


MANAUSD has completed gartley pattern | Upto 78% profit expectedOn week chart the MANAUSD has completed the formation of gartley pattern.
25 MA support is already withing PRZ area.
50SMA and 25SMA are moving towards each other to make a golden cross which will start a massive bull rally insha Allah.
The targets are:
Buy between: 0.05196501 to 0.04290529
Sell between: 0.05920685 to 0.07644723
Regards,
Atif Akbar (moon333)

MANA Long PositionGood day traders.
I can't stay away from the darn alt coins and MANA is a fav to trade. This is a simple method that I use to buy and sell alt coins (some). I only use daily charts and trade with long term plan but its highly effective when carried out properly.
Simple MA strategy adapted for fast moving and volatile as hell crypto.
Use 15 MA and 30 MA along with Momentum.
When 15 MA crosses 30 MA from below with rising momentum, I buy (green arrows on chart)
When 15 MA crosses 30 MA from above with dropping momentum, I sell (red arrows on chart)
I don't use signals that come after massive spikes
I scale in and out on all trades so I have normally sold most of position before sell signal
Momentum setting (25,close)
Long trades often stay near buy in zone for several days so patience is key
Stop Loss a must with ALL trades and I use a blanket 20% from my lowest buy in
No single trade with more than 2% of available capital
Current trade began buying today in 0.053 range and will continue to buy from 0.0485 - 0.057. Expecting a long 15/30 MA cross and momentum rising. May take days but I am patient.

Great expectations on MANAI think MANA is ready to fly....
Look closer this days and wait for the confirmations!
Remember not a financial advise, DYOR.


MANAUSD Buy SignalPattern: Channel Down on 1W.
Signals: Bullish if the inner Lower High line breaks.
Target: 0.07000 (outer Lower High).

Risky trade...isn´t all are? But this one worth the risk!I see that big candle coming...!! If that happens 150-184% profits. Worth the risk.
Remember, not a financial advise. DYOR.
Happy holidays andd happy tradings!

[MANA/BTC] DECENTRALAND IS READY FOR NEXT MOVE [ 25-40% PROFIT]#MANA / BTC ( Bittrex , Binance )
Buy Range : 1400-1430
Stop loss : Daily Close below 1256 sats ( Optional )
Target 1 : 1756
Target 2 : 1979
DAILY CHART :
- Well supported by all moving averages
- STOCH RSI ready to go up
- CCI about to cross into green
- MACD about to cross into positive
- Nice well supported day candle
- Green three about green two and one candle
HOURLY CHART :
- Well supported by MA200
- CCI extending positive moment
- Ichimoku cloud about to be broken right now
This coins remains on uptrend and another wave up is very possible on the next days. Good luck !

MANA continues its uptrend Q4 ANOTHER LEND SALEOur group bought at previous breakout, considering that, you will need MANA to participate in another LEND auction, this shouldnt be the end of the run, I would wait for small correction or break resistance with volume.

New Bullish Pattern in Trading History SICKLE PATTERN !!Many Patterns You have watch and see but first time I see and Create new Pattern SICKLE Patterns as Like SCYTHE Patterns.
Completely Follow the MANA Coin With Proper make a Handle and Blade with Succusfully Breakout ..
What do You Think about this i am very Exicted after create this Beautifull Pattern.
Share Your Opinions What do You think about this Beautifull Bullish Pattern.
f You Satisfied With My idea and Pattern Then Do not Forgot To Hit Like .
Warning- I m Not a Financial Advisore this idea and patterns Only For Educational Purpose Only.

MANABTC correction is not over yatMANABTC is falling to 0.00000500BTC following FIB retracement 127.20% level. If MANA able to break 0.00001070BTC then MANA can retest the 0.00001230 as resistance after that 0.00001420 and 0.00001604BTC

MANA can bounce in the 200 EMAMain Scenario: Despite having lost -4.53% in the last 24-H MANA has been held by the 200-EMA in this 4-H chart and if it manages to bounce back we could have a long entry to look for profits of at least 3% trying to find the Fib Retracement of 50% of the last descent; The indicators are oversold and pointing up, we could possibly see a pullback in the pair and the start of a short uptrend.
Alternative Scenario: The price could cross the Pivot S1 and continue looking for the next support at 0.00001511.
Entry/Stop Loss/ Take Profit: We can go long if the price manages to cross 0.00001580 with 2 targets
T1 = 0.00001631 (3.2 %)
T2 = 0.00001675 (6.0 %)
The Stop Loss can be placed at 0.00001517 (-4.3%)
Duration: 1-2 Days
Consolidation/Ratification level: If the price crosses the first target, you can drag the stop loss to the entry point.
Warning Level: A further drop below the Pivot S1 will invalidate this setup.
Risk Management: Risk/Reward Ratio: 1.48.
