#MANA (SPOT) entry range( 0.2510- 0.3110) T.(0.5990) SL(0.2388)BINANCE:MANAUSDT
entry range ( 0.2510- 0.3110)
Target1 (0.3819) - Target2 (0.4660)- Target3 (0.5990)
1 Extra Targets(optional) in chart, if you like to continue in the trade with making stoploss very high.
SL .1D close below (0.2388)
*** collect the coin slowly in the entry range ***
*** No FOMO - No Rush , it is a long journey ***
**** #Manta ,#OMNI, #DYM, #AI, #IO, #XAI , #ACE #NFP #RAD #WLD #ORDI #BLUR #SUI #Voxel #AEVO #VITE #APE #RDNT #FLUX #NMR #VANRY #TRB #HBAR #DGB #XEC #ERN #ALT #IO #ACA #HIVE #ASTR #ARDR #PIXEL #LTO #AERGO #SCRT #ATA #HOOK #FLOW #KSM #HFT #MINA #DATA #SC #JOE #RDNT #IQ #CFX #BICO #CTSI #KMD #FXS #DEGO #FORTH # AST #PORTAL #CYBER #CLV #RIF ENJ #ZIL #APT #MAV #ZRX #ID #AXS #MANA ****
MANAUSDT

MANA is gearing up for a major breakthrough!I'm a big fan of meta universes and couldn't just not make a plan for MANA, the leading project in this area!
We are technically above 50 EMA and preparing for a breakout from the parallel channel. The project has a capitalization of almost 1 billion and I would expect a hike to the $3 per coin area and reach a capitalization of 6 billion, which corresponds to the 0.5 fibonacci level.
This is a huge prospect considering that the next coronavirus analog as well as potential VR development will attract new investors to the project and send it into the space!
Horban Brothers.

MANA/USDT Trading ScenarioDespite the rapid growth of BTC and many popular assets in the crypto market, some altcoins from promising projects remain heavily oversold and undervalued. One example is the native token of the Decentraland metaverse — MANA. It is currently trading 95% below its all-time high and is near a local minimum.
From a volume profile perspective, the asset is attracting market participants in the current price range, and the accumulation phase has been ongoing for almost two years. If liquidity starts to shift from BTC into altcoins during an altseason, this token could experience significant growth and provide investors with a solid profit.

MANAUSDT 1WMANA ~ 1W
#MANA This chart is very interesting,. It is very bullish if this resistance line is successfully broken. if you still have Conviction on this coin. Buy in stages starting from here. minimum target 20%++
#MANA/USDT#MANA
The price is moving in a descending channel on the 1-hour frame and is sticking to it well
We have a bounce from the lower limit of the descending channel and we are now touching this support at 0.2980
We have a downtrend on the RSI indicator that is about to be broken, which supports the rise
We have a trend to stabilize above the 100 moving average
Entry price 0.2988
First target 0.3045
Second target 0.3121
Third target 0.3200

The medium term of MANA is super bearishMedium term MANA is super bearish
According to the waves that formed in these last two months, the scenario of MANA has become clearer.
It looks like we have a big ABC, and wave B is a triangle.
The last triangle wave of wave B could end in the red range and then we could see another bearish trend for MANA in the medium term.
This is the vision we now have for MANA.
Closing a weekly candle above the invalidation level will violate the analysis
For risk management, please don't forget stop loss and capital management
Comment if you have any questions
Thank You

[MANAUSDT] - Keep ur eye on it!as u see ... clearly wyckoff accumulation on weekly chart
price now is at a rock bottom
i recommend it for long term investment.
best regards Ceciliones🎯

Long, target 0.359Following weekly chart.
Got a long signal, finally.
TP 0.359
SL close under 0.21
Around 16% gain.

MANA(based on NEo wave) structure of wave Ethere is two ways of the triangle to finish this wave E one of them is 0.26 and the other is 0.253.

MANA(based on NEo wave)this diametric is at the end of wave E and the structure of wave E is a triangle that I wil show you in next chart.

MANA (Decentraland): Approaching SupportTrade setup : Price is in a Downtrend. It had a failed breakout from Falling Wedge pattern but price did make a Higher High (above prior swing high), which is also a positive sign (see chart). Now we'll wait for price to pull back and watch if it makes a Higher Low (above prior downswing low of $0.27). Series of Higher Highs and Higher Lows are indicative of an Uptrend.
Pattern : Price is Approaching Support , which is a level where it could pause or reverse its recent decline, at least temporarily. Support is often a level where price has bounced up in the past, or potentially prior Resistance level that was broken. (concept known as polarity). Once price breaks below support, it can move lower to the next support level. Learn to trade key levels in Lesson 7.
Trend : Short-term trend is Strong Down, Medium-term trend is Down and Long-term trend is Strong Down.
Momentum : Price is neither overbought nor oversold currently, based on RSI-14 levels (RSI > 30 and RSI < 70).
Support and Resistance : Nearest Support Zone is $0.27. Nearest Resistance Zone is $0.32, then $0.40.

MANAUSDT Comprehensive Technical Analysis✨ Welcome to my channel. Here, we analyze a new crypto project or Forex pair every day.
📅 Let's dive into today's analysis, focusing on the MANAUSDT pair in the crypto market.
🗂 About the Project:
Decentraland (MANA) is a decentralized virtual reality platform powered by the Ethereum blockchain. Users can create, experience, and monetize content and applications within this virtual world. MANA serves as the cryptocurrency used within the platform for transactions such as purchasing land and goods.
📅 Weekly Timeframe Analysis
In this timeframe, MANA has experienced significant movements. Recently, it saw a downward trend, reflecting a broader market decline. MANA is currently testing a crucial support level around $0.1716 after a prolonged correction phase.
📈 If MANA stabilizes above $0.4133, we can anticipate bullish momentum potentially pushing the price towards the next resistance at $0.7816. Confirmation of a new upward trend will depend on candle stability above this level.
📉 Conversely, if MANA falls back into the range between $0.1716 and $0.4133 and stabilizes below $0.1716, it indicates a bearish trend continuation. The next critical support level would be around $0.1300.
In both scenarios, volume analysis is crucial. A healthy trend should be supported by corresponding volume without any divergence.
📅 Daily Timeframe Analysis
On the daily chart, MANA ranged around the $0.4133 level before initiating another downward wave. Currently, there is noticeable bearish momentum, and the price has found temporary support at $0.2890.
🧲 Given the current setup, stabilization below $0.2890 could signal another bearish wave.
On the flip side, if the price moves above $0.3932, it could indicate the start of a bullish trend, targeting higher resistance levels.
📅 4-Hour Timeframe Analysis
In the 4-hour timeframe, MANA has pulled back and reached the support at $0.2890. Volume analysis shows a decrease, indicating potential exhaustion of the recent downward movement.
📈 For short positions, the key levels to watch are $0.3158 and $0.3932, where price reactions could provide better entry points.
📉 For long positions, critical levels are $0.2890 and $0.2616.
📊 RSI Oscillator
The RSI is currently ranging between 20.73 and 37.93 on different timeframes. Breaking these levels could provide confirmation for opening positions. However, always use these levels in conjunction with candle patterns and volume analysis to find the best entry and exit points.
📉 Given the current bearish signals in the daily and 4-hour timeframes, alongside the potential trend change in the weekly timeframe, I am inclined to open a short position. However, this is based on my trading strategy. Each trader should base their decisions on their strategies and risk management plans.
⚠️ Please note that this is not financial advice. I'm simply introducing this project to you, and remember always to do your own research.
🫶 If you found this analysis helpful and want to support me, please boost this analysis. Feel free to leave a comment or suggest a coin you'd like me to analyze next.

MANA looks bullishIt looks like we have an ABC on the chart that wave C is ending.
By maintaining the green range, it can move towards the target.
The short-term target can be the red box
Closing a daily candle below the invalidation level will violate the analysis
For risk management, please don't forget stop loss and capital management
Comment if you have any questions
Thank You

MANAUSDT Long Position Analysis✉️ Pair: MANAUSDT
📈 Direction: Long
💯 Leverage: Cross 5x - 10x - 20x
📊 Entry: $0.3000
✅ Target 1: $0.3705
✅ Target 2: $0.4823
✅ Target 3: $0.5739
✅ Target 4: $0.6959
✅ Target 5: 🚀🚀🚀
⛔️ Stop Loss: $0.2555
MANA has formed a falling wedge and has been rejected from both the descending resistance of the wedge and a horizontal resistance. It is currently trending towards the support line of the chart. If #MANA loses the next support, there is a high chance it drops to $0.30, presenting a good dip buy opportunity. 📊
🔔 For more updates, follow me and don`t forget to hit the BOOST :D

MANA USDTMANA/USDT Setup. After a confirmed breakout from the marked zone in green, we could take an entry at 0.3533
Remember stop loss is your friend. Everything is on the chart.
Entry 0.3533
S.L 0.3419
T.P 1 0.3633
T.P 2 0.3748
T.P 3 0.3293

Shitcoin Summer is HereIt's hot outside right now. Real hot. Clocks in at 120 where I live. But I'm cool as a cucumber right now because I know my Christmas is gonna be a good one. Why? My shitcoins are about to move. Check out my chart of eight of my favorite $hitcoins - they've all retested bottom and the bottom rejected them all. So - whether you love em or hate 'em, back up we go. That's how it works. Don't fight it, you'll lose. Just buy someone else's bags for cheap now before this rocket blasts off.

MANA Technical Analysis: Potential for a 200%+ Rally!Hello everyone, I’m Cryptorphic.
For the past seven years, I’ve been sharing insightful charts and analysis.
Follow me for:
~ Unbiased analyses on trending altcoins.
~ Identifying altcoins with 10x-50x potential.
~ Futures trade setups.
~ Daily updates on Bitcoin and Ethereum.
~ High time frame (HTF) market bottom and top calls.
~ Short-term market movements.
~ Charts supported by critical fundamentals.
Now, let’s dive into this chart analysis:
After a heavy 68% drop, MANA has finally reached the lower support level and is currently showing a rebound.
The lower support line has remained strong for MANA since December 2022, and so far, it has respected the support trendline. If MANA follows the uptrend and breaks above the 21 EMA, then a bullish rally is likely possible.
- Lower Support: $0.243 to $0.29
- Primary Resistance: $0.401
- Target: $0.766
- RSI: Oversold
- Invalidation Point: A breakdown below the supporting trendline.
DYOR, NFA.
Please hit the like button to support my content and share your thoughts in the comment section. Feel free to request any chart analysis you’d like to see!
Thank you!
#PEACE

Bitcoin's Parabolic Potential & MANA's Key Levels Revealed📅 Let's dive into today's analysis. We are focusing on the crypto market, where we've seen an upward move, and Bitcoin is at a critical and exciting position. The coin I'll be analyzing today is MANA.
👑 Bitcoin Analysis
🔍 Bitcoin Technical Analysis
In the 1-hour timeframe, Bitcoin has started to correct after reaching the 59323 support level and has now created a bullish structure in this timeframe, reaching the 63700 resistance level. A correction to 0.382 of this upward wave has been made, creating a box between 36700 and 62634.
🧲 Trend Line Analysis
Additionally, there is a curved trend line supporting the price. Since this line is curved, it could trigger a parabolic movement in the market. Conversely, if this trend line breaks, we might witness another sharp drop in the market.
📊 Volume Analysis
The market volume is ranging and is neither converging with buyers nor sellers. The direction will likely depend on which side increases its volume.
📈 Long Position Strategy
Long Position: We can enter a long position with a break above 63700, targeting 64530 as the first target. A riskier trigger is at 63122. RSI stabilization above the 55.87 resistance can act as confirmation for these positions.
📉 Short Position Strategy
Short Position: For a short position, first wait for a candle to stabilize below the curved trend line and activate the 62634 trigger. The second trigger is breaking the trend line at 62168. The RSI confirmation trigger is at 40.72.
🔍 MANA Analysis
🗂 Project Overview
Decentraland is a crypto and metaverse project where everyone can buy land and introduce their projects to others. The native token of this platform is MANA, and all transactions on this platform are conducted using this token.
🧲 Trend Line Analysis
In the 4-hour timeframe, this coin has started a downward trend from 0.4832 and dropped to the 0.3170 support level. After reaching this support, it corrected up to 0.236 and created a range box. This coin also has an upward curved trend line that could trigger a parabolic movement in the coin.
📈 Long Position Strategy
Long Position: Stabilizing the candle above the 0.236 area could push the price upward, creating bullish momentum to move towards the 0.5 Fibonacci area, which coincides with 0.3896. For this position, buying volume must enter the market, and the RSI trigger is at 59.26.
📉 Short Position Strategy
Short Position: For a short position, first wait for the curved trend line to break. For additional confirmation, we have two triggers: the first is at 0.3287, and the second is at 0.3170. If these levels break, we can expect the price to move down to 0.2792 based on Fibonacci Extension. Personally, I would open a position with a break below 0.3170 only if the selling volume increases and the RSI is below 50. Otherwise, I will wait for a break below 0.2792.
📝 Conclusion
In conclusion, both Bitcoin and MANA are showing critical levels that could determine their next major moves. Bitcoin's parabolic potential hinges on its curved trend line support, while MANA's future depends on its range and trend line dynamics. Keep an eye on the volume and RSI confirmations for better entry points.
🧠💼 Always remember the inherent risks in futures trading, with the potential for margin calls if risk management is neglected. Stick to strict capital management principles and use stop-loss orders, ensuring an initial target with a risk-to-reward ratio of 2.
🫶 If you found this analysis helpful and want to support me, please boost this analysis. Feel free to leave a comment or suggest a coin you'd like me to analyze next.

MANA USDTMANA Trade Setup.
After a confirmed breakout from the green zone, we could take entry at $0.3525.
Remember stop loss is your friend. Everything is on the chart.
Entry $0.3525
S.L $0.3433
T.P 1 $0.3633
T.P 2 $0.3748
T.P 3 $0.3893

MANA/USDTTarget is the wave c of B after that the price will continue to drop so as to the cycle ends (wave 4=somewhere between 0.16-0.08$) then the price will rise to the peak of the final cycle at a target minimum 6$

MANA(based on NEo wave)mana has a good bullish cycle and it is in the E wave in monthly time frame but for now on this chart it has a side triangle that shows the E wave is at the end,
I would like to but some with C wave of stop loss.

MANA Technical AnalysisMANA is in a bearish trend with the price trading below the EMA 200, after rejecting from it the price declined to the $0.3231 support level and holding above it.
If the price manages to hold above at $0.3231 level we could expect a bounce back to the next levels.
If the price fails to hold the $ 0.3231 level it will move towards the next support zone Yellow at $0.2638 - $0.2845.Which is the best buying zone.
While the price is holding above at $0.3380 we can take some entries here and do some entry at the next Yellow zone.
The volume will also be a key factor to watch as it can provide insights into the strength of any potential moves.

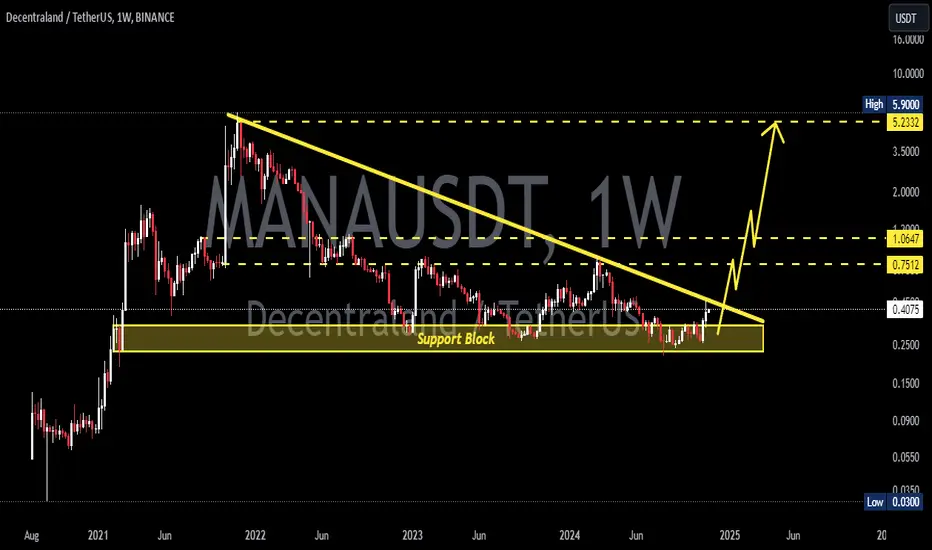
Will MANA Support hold ? Get ready for both scenariosBINANCE:MANAUSDT (1W CHART) Technical Analysis Update
MANA is currently trading at $0.331 and price is trading around its support zone, we are not sure if this support will hold and price bounce back from this support zone. We need to consider both scenario for entering the trade here, for long trade we will enter only after a green weekly candle above the support zone. For short trade we will enter if the candle closes below the support zone.
-- LONG Trade --
Entry level: Green Weekly candle above support zone
Stop Loss Level: $ 0.2526
TakeProfit 1: $ 0.4561
TakeProfit 2: $ 0.5931
TakeProfit 3: $ 0.7804
-- SHORT Trade --
Entry level: Candle close below support zone
Stop Loss Level: $ 0.3487
TakeProfit 1: $ 0.2038
TakeProfit 2: $ 0.1644
TakeProfit 3: $ 0.1198
Max Leverage: 2x
Position Size: 1% of capital
Remember to set your stop loss.
Follow our TradingView account for more technical analysis updates. | Like, share, and comment your thoughts.
Cheers
GreenCrypto
