Mana To $5$mana #decentraland bounced off of support and now looking to go after $5 at top of channel and ATH.
Support was found at bottom of Channel which had confluence with super trend, 50 MA, and bottom band.
Mana is stuck at golden pocket and 20 MA but once H4 closes above, it should be ready to make a big move.
DYOR and GL !
---------------------------------------------------------
Top 10 trading tips:
1. DO NOT FOMO into PUMPs.
2. Set a strategy and be consistent. The more you use the same strategy with the same $$$ amounts, you will be able to identify the winning set ups quicker and you will need to win less trades to be profitable over time.
3. Let your winners run and cut your losers short.
4. You will not win every trade, but if you are disciplined with great RM you don't need to be right all the time to win!
5. Before you enter a trade, make you know your target (or take profit target and let the rest ride) AND your exit strategy.
6. When you are up, you can use a trailing stop or trim off some profit at a logical resistance point with a stop loss at breakeven.
7. It is hard to deal with emotions when trading, set parameters up front so you keep your self accountable. (stop loss, take profit levels, etc)
8. Don't fight the trend. The trend is your friend.
9. Use multiple indicators to confirm your TA on price action.
10. Only trade what you are willing to lose. It will be hard to trade without emotions.
Disclosure:
This is not financial advice.
I do not take every trade I post.
Never trade off of someone else's chart until you DYOR!
MANAUSDT

My Christmas gift to you dear ones :)1)This is a suggestion
2)Do not be emotional at all
3)There is a possibility of delay up to 3 months
"Do not be satisfied with low profit my friend"

MANA ⏫- The Battle of the METAVERSE (No breakout unlike SAND ⏫⏫)Decentraland finally offered me a good experience: Banksy art sold at Sotheby's for Ethereum . Watched it live from Decentraland. 👓
Mana has failed to break it's resistance and the flight is paused until that happens. Our chart will help you understand this better. Also look at our previous SANDBOX ideas for comparison.
Our estimate and analysis is that Mana will be outperformed by Sandbox. That is a personal opinion based on our research, do your own and feel free to comment.
Needless to say that Decentraland has a great future ahead. The Metaverse is HOT and it will remain that way for months and years... but prices can correct at any time so mind the resistances.
Good to know:
events.decentraland.org
Decentraland events is something I follow! You should do the same...
One Love,
the FXPROFESSOR

PLA: What comes next - Gaming/Meta- close to a breakout?PLAUSD - Playdapp - Gaming coin making big strides in multiple areas of the gaming/meta industry and subsector. Recent partnerships and apparently a very active management/Dev team. Korea and Japan, as well as US/global developments and activities.
So, It's hit almost $5 ATH not too long ago. Recent developments put it at around $2.50, low marketcap - sub- $1B, low float, thinly available. Greater demand > supply, has put upward, consistent price pressure and it has been rising from the mid-$1 level into the $2's with a smaller local breakout occurring 5 days ago to let off some pressure. Well, it didn't let off enough, this is trending higher and RSI is building on 4h. We will be getting that BREAKOUT very soon IMO.
We will see this tightening triangle and ascending trendline lead to a breakout shortly. My targets are in the $5 vicinity ST, and more if other gaming/metaverse coins are any indication. (Think SAND, GALA, MANA, etc.).
Always keep an eye on BTC, ETH , though this trades independently with hardly any negative movements, and only positive correlation. How awesome is that?
Time will tell. GLTA, do your due diligence and enjoy the ride up.

MANAUSDT H1the uptrend will likely continue today based on the price and the increasing trading volume of up to 62% according to coinmarketcap.com

You didn't miss out......you never do. Sure, we've all missed a sell or buy that can make you sick to your stomach. But as we learned within a couple of hours or days, it always goes back. Remarkably, more like dumb luck, my last post contained orange dashes to show potential movement. It followed it to a tee. I'm not patting myself on the back, in fact, I'm going to erase them because it's dangerous to think that is even practical. I'm not sure when, because MANA just found huge support at $4.08, but there is a strong case to be made for the price coming back to the $3.88 area. There's a great case for it to also visit $3.55. The "M" shape would happen to play out exactly with the short-term .5fib around $3.88. I chickened out earlier, sold at a nice round $4.20 even though my plan was $4.24. With the bullish momentum increasing, I will happily settle for getting back in at $3.88. $3.55 would be cool, but I'm also happy MANA didn't blast through $4.25 and keep flying higher. Volume is picking up and it is getting super volatile. Even though I erased the dumb dashes from the last post, the pink circles are logical spots for one last touch of the lower trend line before blasting out of the triangle pattern. Should we breach the upper trend line in a meaningful way, then we will not be hitting the pink circles.
Be very careful. Although there are no indications of a major dump, the volatility is screaming and it could just as well crash down to the $3.30 level should support not be made. MANA could also just go off like a rocket. If you miss out, don't sweat it, just do your research and enter a new position. Check out ATR's and how to use them when setting Stop Losses. If you're new to this, make sure you are on a reasonable time frame when checking the ATR. Again, be very careful right now. A lot of things are coming to a head the next couple days. Keep your fingers crossed because it's completely out of our hands. MANA has a mind of its own.

MANA first target? Done ✅ The first target that we expected to touch and immediately jumped up,
Let's see what will happen to target 2?
Stay tuned

Maybe this is betterThe head and shoulder pattern can be shaped with a little change, which is great and creates a neckline around the ATH.

MANA sideway before uptrendAs predicted from my previous chart, MANA would follow the upper trend without breaking the resistance. The question is when MANA would break the resistance to go above its previous ATH? SAND has surpassed $4.9/SAND, at first SAND would seem to be a good investment option. However, the top 20 holders of SAND own more than 82% of SAND, which is very insecure; while the top 20 holders of MANA total own no more than 56% MANA. In terms of investment with less whale manipulation and future for long-term investment, MANA is a good boat to choose with yearly >20% profit.
Back to the graph, the next 72 hours will be critical to see how the holder of MANA responds to the others competitor such as SAND.
This is not financial advice! DYOR!

MANA continues to "defi" the overall short term crypto trend......see what I did there?
I'm going to quit while I'm ahead with the crystal ball from a couple of days ago. I was 1/2 joking when I put the red? where I thought we'd find that support because we can have a good idea of supports and resistances, but "when" that happens is, in my case too, luck. I do think it is going to want to bounce off of the lower support line at some point, and that may have to be when it climbs into range, above yesterday's low, probably in the low $3.60 area. MACD, Volume Oscillator, RSI are all looking bullish.
Today's chart has Thick Green from the other day and is our skeleton. The Short-term for the next couple of days is in purple, thicker lines are stronger than thin, and the dashed blue/orange lines are just the type of path (not close to exact) I think MANA will follow as it finds support, meets resistance, gets rejected, etc...until a breakout happens. This is all invalidated should we slip below $3.30. The pink circles are just places above yesterday's support where I think MANA will have to hit to make the big push up. Do your own research because this is not financial advice. Be safe and set your SL's.


MANAUSDT H4The General up trend will likely continue... I enter at 3.71000, expecting a 10% increase to take profits at 4.08100..

MANAUSDT Long Looking Great Right NowA MANAUSDT Long position is looking good here with a mixture of TA and Indicator signals like a long on my VWAPRSI and momentum (based on the TTM Squeeze) looking to go positive.

Bullish continuation pattern in DOT* DOT in 1D time frame forms a bullish pennant pattern.
* Bullish pennant appears when the price consolidates for a period of time between two trendlines before it continues the trend.
* To continue the rally DOT needs to break the upper trendline of the pattern.

MANA 2H BUYMANA 2H support is at ~$3.60
Enter 50% here
and try to set some buy orders near the support zone
If MANA holds above the trendline,
the Take-Profit target would be $3.96, $4.32, and $5.04
Cheers

MANA Still Bullish Channel 4HMANA Still Bullish Channel 4H Very soon new all time high. Strong support around 3.3094

Mana Entry Mana is going to test trendline, there is a possibility of breakout again, NFA, DYOR
3.5-3.6 sl 3.4

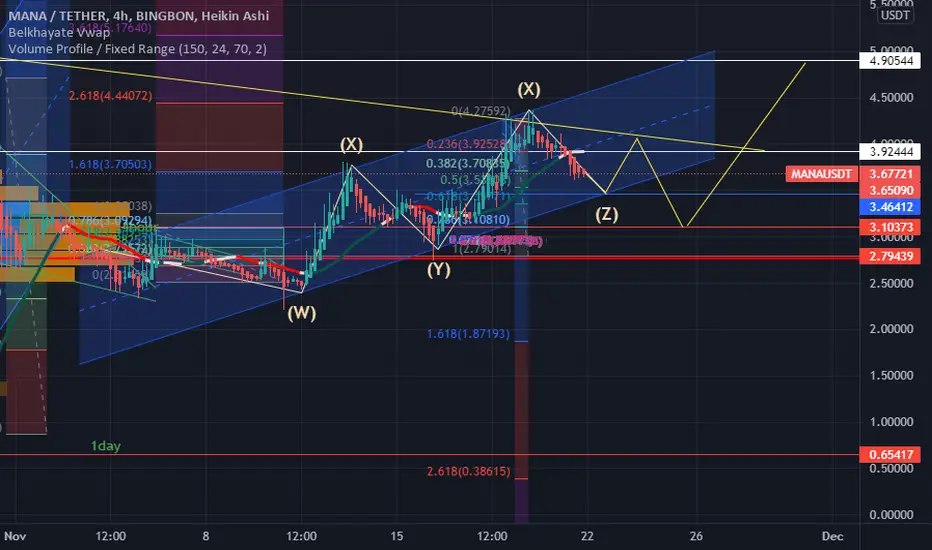
MANA 4HOURS CHART ANALYSISHello friends .
i prospect the MANA will see a downward to 3.464 and then the price will see a huge bullish to 4.905 .
DISCLAIMER: This is not an financial advice (its my own opinion) Please only invest what you can afford to lose, and do your own research before investing and don't forget stop loss is part of profit .
Please support my work by clicking the like button and follow me on TRADINGView, if you don't want to miss my next analysis.
If you have any criticism put it in a comment we are here to learn more from each other and thanks .
$MANA with the bullish continuation$MANA is bouncing perfectly from the horizontal resistance turned support, which also coincides with the support of the bullish trend line.
This is a good risk/reward of over 3, and I'm taking it with a conservative target of the previous highest close.

MANAUSDT TF 1H Short IdeaThis is my prediction of MANAUSDT in timeframe 1H
You can place a SHORT position
Entry Long : 4.05 ~ 4.1
Take Profit 1 : 3.6
Take Profit 2 : 3.1
Stop Loss : 4.4
Note : Use MM all of your open trade. Because no one now can predict the market
The best for you all
" DrafterCrypto"

MANA consolidation before BullishMANA might not be able to go above $4.8 passing its previous ATH this time. However, it has a very good run and the trend is very good! I suspect it will sideway around the $3.8 for 1-2 weeks before running straight to $6.
This is not financial advice!


Confluence is everythingThe greater number of indicators lining up, the more a theory is supported. Given the lack of a crystal ball, it is easier to have an idea of where a trend change will occur (meta)versus when. For fun, not financial advice, I made a guess with a red question mark. In other posts, I've noted that although highly volatile, MANA has been behaving with relative predictability. It maps out the resistance on the way up for us to trade them as support on the way back down.
My non-financial advice is looking at a number of indicators around the $1.57-$1.62 range for our next meaningful leg up. I like to have at least 2 strong confluent indicators and another weaker one before making a trade. The Macro fib .5, the Micro fib .618 (going up from $3.15 on Nov. 17), the shoulder of our textbook inverse H&S all line up with our lower trend line's approach to this area...that's 4 big ones. We've hit this trend line twice. Most major moves happen just above the 3rd touch, not quite making it all the way down because people start buying early as to not miss out. The volume oscillator is also about to touch the bottom for a reversal. Lastly, if you take the $5 high and then subtract the $2.20 low, divide that number by 2 and then add it to $2.20, you get $3.60...just messing with you, that's how the .5 Fib is calculated. If I had a crystal ball, I would put our next major move up on the 21st at about $3.60. My rationale for the timing is a stretch...but if you start on Nov. 3 when it took a small deuce, it dumped every 6 days, touching/creating the lower trend line, marked with red 'X.' The red '?' is where the crystal ball adds time as a function...but yeah, don't trust crystal balls, bad stuff happens when they crack. Regardless of where and when, find comfort in that MANA is clearly in an upward channel, breaking away from BTC and the overall greater crypto trend, and investing now puts you at the lower end of this token's potential value. I'm not going to predict $50 or even $25 dollars because that would need extreme market cap. and public sentiment can crush a commodity in a couple of days for no good reason. That being said, currently, sentiment is great, and barring a collapse there is no reason MANA couldn't reach $5, $9, or even $15 before the end of this bull run.
That's all I have. These are just my ideas and not financial advice. Do your own research and don't listen to knuckleheads on the internet. It's been a fun and lucrative couple of weeks. Thanks for all the likes and follows...but what I would really like is some feedback besides "lambo and moon." Tell me what I'm missing. Tell me a joke? Tell me, "You da mana?" Good luck, spend time with your family, and trade responsibly.
