MANA/USDT Rebounding from Key Weekly Demand Zone – Path to $1?🔶 Strong Support Zone (Demand Zone):
MANA/USDT is currently testing a major weekly support area between $0.20 – $0.30, a zone that has historically acted as a strong demand level since 2021. Price has bounced off this region multiple times, indicating strong buyer interest and potential for a bullish reversal.
🔶 Chart Pattern:
There is no classic pattern like a double bottom or head & shoulders, but price structure shows signs of horizontal accumulation, which resembles a Wyckoff re-accumulation phase—a typical base formation before a strong upside breakout.
🚀 Bullish Scenario:
If the price holds above the $0.25 support and forms a higher low, a bullish continuation is likely. The following resistance levels could serve as potential upside targets:
1. $0.3610 – Initial resistance and confirmation level.
2. $0.5475 – Intermediate psychological level.
3. $0.8109 – Former supply zone.
4. $1.0661 – Major resistance from 2022.
5. $2.7291 – $5.0666 – Long-term targets if macro bull trend resumes.
> Bullish Confirmation: A strong weekly candle close above $0.36 with high volume could spark a major rally.
🔻 Bearish Scenario:
If price breaks down below $0.25 and closes below it on the weekly timeframe, it would invalidate the bullish structure and may trigger further downside towards:
$0.13 – $0.07, the historical lows seen in early 2021.
> Bearish Confirmation: A weekly close below $0.25 with increasing volume would suggest sellers are back in control.
🧠 Conclusion:
MANA/USDT is at a pivotal point within a long-standing support zone. Holding this level could result in a strong upward move, but a breakdown would indicate further bearish pressure. Traders should watch this zone closely for confirmation in either direction.
#MANAUSDT #Decentraland #CryptoTrading #TechnicalAnalysis #AltcoinAnalysis #BullishSetup #SupportZone #TradingView #MetaverseCrypto #CryptoBreakout
Manausdtbuy

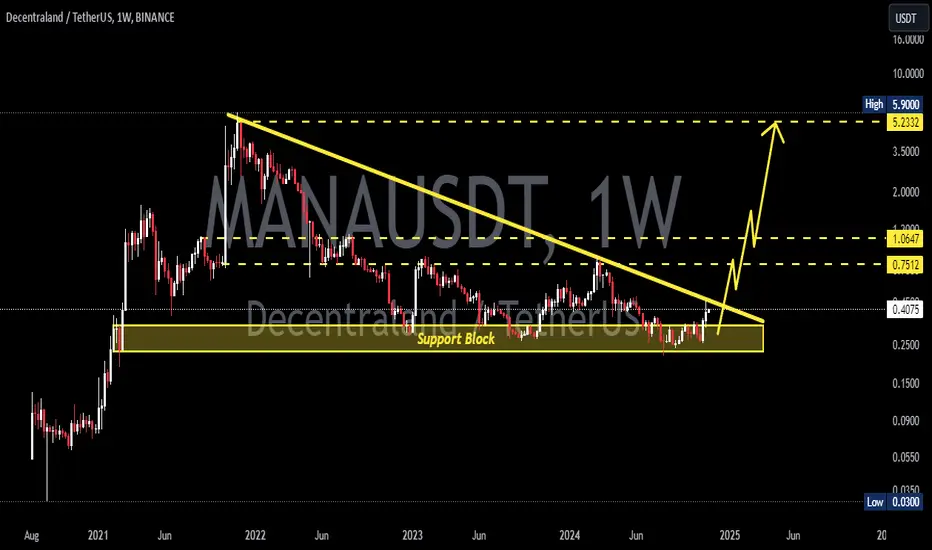
MANAUSDT 1W AnalysisMANA ~ 1W Analysis
#MANA Buy back gradually from this support block with a short term target of at least 20%+ from this support.

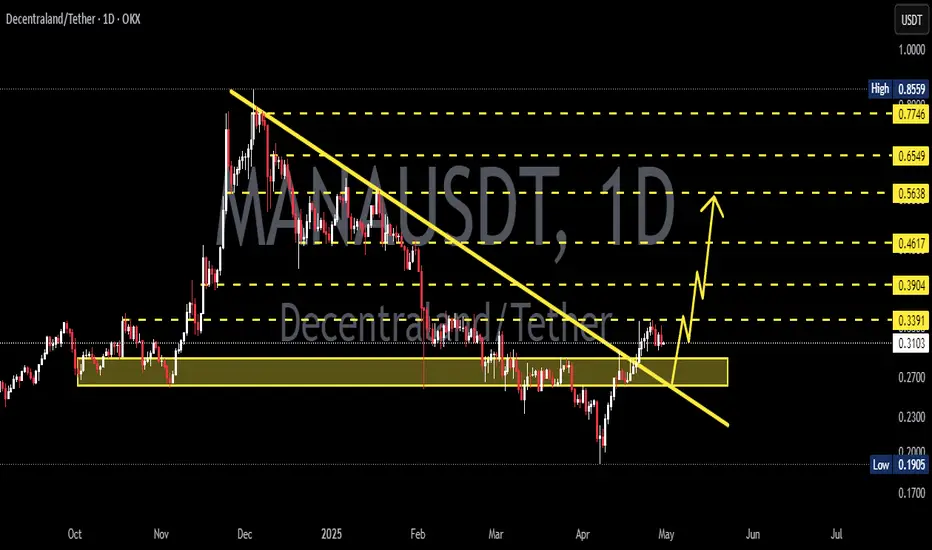
MANAUSDT 1D AnalysisMANA ~ 1D Analysis
#MANA Buy gradually from here if you still have confidence in this coin with a short term target of at least 15%++ from here.

MANAUSDT 1D AnalysisMANA ~ 1D Analysis
#MANA Buy gradually when re -testing this support with a short -term target of at least 15%+ from here.
MANAUSDT 1WMANA ~ 1W Analysis
#MANA Buy gradually from here if you still have a Conviction on this coin with a short -term target of at least 20%+.

MANAUSDT 1WMANA ~ 1W Analysis
#MANA If you still have a Conviction on this coin,. This is a very good support for now. buy gradually with a minimum target of 20%+

MANAUSDT 1WMANA Update ~ 1W
#MANA At Time frame 1W,. EURONEXT:MANA rejected by this local resistance. The best way for now. You can buy back when this resistance line is retested or you can place another purchase on this support block.
these two scenarios with a target of 20%++

MANAUSDT Set for Channel Breakout!MANAUSDt Technical analysis update
BINANCE:MANAUSDT price has formed a descending channel on the weekly chart, which has been developing over the past 930 days. The price is now approaching the channel's resistance line, with rising volume observed in recent weeks. Additionally, the price is trading above the 100 EMA. Once the breakout is confirmed on the weekly chart, a strong bullish move can be anticipated.

MANAUSDT 1WMANA ~ 1W
#MANA This chart is very interesting,. It is very bullish if this resistance line is successfully broken. if you still have Conviction on this coin. Buy in stages starting from here. minimum target 20%++
MANAUSDT Trend Line Breakout!MANAUSDT Technical analysis ypdate
MANA's price is approaching the trend resistance line, and volume has been gradually increasing over the past month. If the price breaks out above this resistance level, we can expect a significant upward move.
Regards
Hexa

MANA Big move coming! (Long entry setup)Mana has strongly changed character from a key point, I expect a minor pullback validating the change of character and a move up from here!
NFA

MANAUSDT analysis buy signal 11/7/2022Market in the way way to our orange (WCL) buying area after formation of III sequence also the market break the correction LVL for the bullish move RR 3:1

MANAUSDT analysis buying signal crypto market is on the way to our WCL blue buying area after formation of III impulsive blue sequence

MANAUSDT Due to the completion of the correction and the price reaching the downtrend line and the 61.8 Fibonacci level, as well as the negative divergence in the lower time, I expect the price to start falling at least to the previous floor. Be profitable.

MANA BREAKOUT! READY TO PUMP 700%Hi guys, This is CryptoMojo, One of the most active trading view authors and fastest-growing communities.
Do consider following me for the latest updates and Long /Short calls on almost every exchange.
I post short mid and long-term trade setups too.
Let’s get to the chart!
I have tried my best to bring the best possible outcome in this chart, Do not consider it as financial advice.
LONG
#MANA breakout this bullish flag pattern currently it is retesting.
ENTRY: CMP and add more in dip up to $2.44
SELL- 700%
LEVERAGE: 3X
STOP LOSS: $2
This chart is likely to help you in making better trade decisions, if it did do consider upvoting this chart.
Would also love to know your charts and views in the comment section.
Thank you

MANA/USDT Don't miss the great buy opportunity Hi guys, This is CryptoMojo, One of the most active trading view authors and fastest-growing communities.
Do consider following me for the latest updates and Long /Short calls on almost every exchange.
I post short mid and long-term trade setups too.
Let’s get to the chart!
I have tried my best to bring the best possible outcome in this chart, Do not consider it as an
According to this 2days chart, MANA is making this huge bull flag .
Entry range:- $1.58-$1.7
Target:- 500%
SL:- If any 2days candle close below $1.58
This chart is likely to help you in making better trade decisions, if it did do consider upvoting this chart.
Would also love to know your charts and views in the comment section.
Thank you

WAIT FOR NEXT SUPPORT FOR MANA LOVERSThe end of 2021 is coming. MANA/USDT needs to inhale by touching the next support area. The end of the year becomes an important point for traders where there will be surprises, of course, it can be good or bad news. but for crypto like MANA/USDT, there are still pretty good hopes for the next years. so I share a suggestion to BUY/LONG if the price hits the green area (take a look at the chart).
The crucial buy point of this coin is $2.66 - $2.53, you can buy MANA/USDT in this area. WHY? Because MANA/USDT needs to reclaim Fibonacci 0.618. then, you can sell it from $4.02 - $4.27, with or without leverage, PLEASE REMEMBER do not use leverage above X3.., every trade action required financial management skills. wise in trading and take your profit.
Thanks. any donation/support with ETH
0x94bD70a85147A9f2588994854617987D980acED2

Will MANAUSDT strike again ??MANAUSDT is now reaching a support area around 4.20. We can see it is also forming a falling wedge , and if we look at the chart we can see bullish harami appearing at the bottom of a down trend. So, we are waiting for the bull's move. If they cross 4.40 - 4.50 than they can push the price towards 4.80 and 5.10. Good Luck!
Follow me on TRADINGView, if you don't want to miss my next analysis or signals.
Thanks

#MANA is ready to pump more than 80%#MANA in it's #USDT pair made a triangle and there is 2 possible scenarios for this chart in 4h time frame
1 : Break out the triangle and reach to 5.3 and 5.8 as next resistance levels
2: break down supporting level in the area of 4.2 and retest next support in 3.93 and 3.5
IN both scenarios #MANA is following targets : 6.5 - 7.8 - 9 - 10 - 15
Best approach is buy step buy step in the supporting levels and rebuy in Rebuy Zone if stoploss (3.93)

Will MANAUSDT cross $5 ?As we can see from the chart
Entry point -> 3.8 to 4
Stop Loss -> 3.4
Take Profit -> 5.0 - 5.35 - 5.70
If u take my suggestion,going by the trend I believe it will cross $5 and potentially reach closer to $6
Good luck everyone!
Follow me on TRADINGView, if you don't want to miss my next analysis or signals.

MANAMANA (USDT)
sell your profit at target number 1 (28%)
dont set stop lose but sell it if it close under the green line .
Good luck ......

💡Don't miss the great buy opportunity in MANAUSDTrading suggestion:
". There is a possibility of temporary retracement to the suggested support line (2.7034).
. if so, traders can set orders based on Price Action and expect to reach short-term targets."
Technical analysis:
. MANAUSD is in an uptrend, and the continuation of the uptrend is expected.
. The price is above the 21-Day WEMA, which acts as a dynamic support.
. The RSI is at 52.
Take Profits:
TP1= @ 3.0775
TP2= @ 3.4566
TP3= @ 3.8489
TP4= @ 4.2019
TP5= @ 4.9394
SL= Break below S2
❤️ If you find this helpful and want more FREE forecasts in TradingView
. . . . . Please show your support back,
. . . . . . . . Hit the 👍 LIKE button,
. . . . . . . . . . Drop some feedback below in the comment!
❤️ Your support is very much 🙏 appreciated!❤️
💎 Want us to help you become a better Forex / Crypto trader?
Now, It's your turn!
Be sure to leave a comment; let us know how you see this opportunity and forecast.
Trade well, ❤️
ForecastCity English Support Team ❤️

💡Don't miss the great buy opportunity in MANAUSDTrading suggestion:
". There is a possibility of temporary retracement to the suggested support line (2.7034).
. if so, traders can set orders based on Price Action and expect to reach short-term targets."
Technical analysis:
. MANAUSD is in an uptrend, and the continuation of the uptrend is expected.
. The price is above the 21-Day WEMA, which acts as a dynamic support.
. The RSI is at 53.
Take Profits:
TP1= @ 3.0775
TP2= @ 3.4566
TP3= @ 3.8489
TP4= @ 4.2019
TP5= @ 4.9394
SL= Break below S2
❤️ If you find this helpful and want more FREE forecasts in TradingView
. . . . . Please show your support back,
. . . . . . . . Hit the 👍 LIKE button,
. . . . . . . . . . Drop some feedback below in the comment!
❤️ Your support is very much 🙏 appreciated!❤️
💎 Want us to help you become a better Forex / Crypto trader?
Now, It's your turn!
Be sure to leave a comment; let us know how you see this opportunity and forecast.
Trade well, ❤️
ForecastCity English Support Team ❤️
