BITCOIN (BTC) !!!SMC!!! BASED SHORT TERM SCENARIOIf you look at the bitcoin chart from the institution's viewpoint, there are some imbalances left behind by the manipulation, some already got closed but the two most recent ones are the ones you can see on the chart.
Bitcoin will therefore surely go back to the 44k-45k range
-------------------------------------------------------------------------------------------------------------------------------------------------------------------------------------------
If you enjoyed this post and agree with me, a like and a sub would be very nice : )
If you have any other ideas or simply disagree, manifest yourself in the comments ⬇️⬇️⬇️
Stay updated for more content
Have a nice Day : ) Bye!
-------------------------------------------------------------------------------------------------------------------------------------------------------------------------------------------
Manipulation

BTC BIG DROP TO COME !! PERFECT SMC SETUP AND YOU FELL FOR IT...I wanted to publish this info earlier but it doesn't atter anymore, BTC is ready for another crash
↓↓↓Bitcoin followed exactly the setup I posted previously, you can check it below ↓↓↓
Have a nice day : )


Hourly Dance Off!Just an update since Asian Session open.
STILL ON ALERT FOR FAILURES TO BREAK HIGHER (1847.5+) THEN ITS SHORT AGAIN!
The additional 100+ pips that we are waiting for on the second of the 2 longs from yesterday have already been mad in a short and a long scalp (both 50+ pips)
This means whether the long plays out or not we are Gucci!
But seeing the last Green hourly Vector candle, We cannot help but think they are holding out for Consumer confidence news at 15:00 UTC
We can see this news being used to help us hit our Long target. (1854.9)
Our short and long scalp prices still stand from the previous ideas!
Short scalps short and sweet until it becomes "The Short" and Longs from good prices to be held until we hit a good sell price! With how long it has been loading the break out can be vicious. Just remember guys, price only gets manipulated up to crash it down and visa versa.
Good luck guys!
This is not financial advice and should be taken with a pinch of salt.

WHAT HAPPEND WITH ETH? - SM CONCEPT - LIQUIDATED POSITIONSAs you already know, or should definitely know, Ethereum is not in a bull market, nor a bear market but a crab market, that means that it's currently being manipulated and you can only predict its moves applying the rules of the SMC.
Millions of positions got liquidated by the voluntary crash of bitcoin down to 2.3 k.
Ethereum is probably going to crash below 2k and then has to go back up to fill unbalance gaps and negative orders let behind by the manipulation.
------------------------------------------------------------------------------------------------------------------------------------------------------------------------------------------------
If you enjoyed this post and agree with me, a like and a sub would be very nice : )
If you have any other ideas or simply disagree, manifest yourself in the comments ⬇️⬇️⬇️
Stay updated for more content
Have a nice Day : ) Bye!
----------------------------------------------------------------------------------------------------------------------------------------------------------------------------------------------

Since the shorts scalpsSo its been an interesting week in Gold and it's great to see the Vector candles doing their job in the hourly and 4 hourly.
We were done with the short scalps at 1810 and caught a sniper long entry at 1805.88 where a Green Vector candle was to be recovered by red which flipped and turned green. We pulled out majority at 1823 but re-entered more longs for the rest of the journey to 1837. It blasted past 1830-1835. Due to Green Vector recovering Red Vector from 221121 (top 1838.8) on 190122 and approaching the top of the box and some of our short entry prices (1845/1848) on 200122, we started on the short scalps again. As well as potentially a meaningful short to the bottom of the box as there is more Green Vectors below. We are experienced enough on Gold to know it can carry on long also at anytime as there are Red Vectors above too. But we are more leaning bearish at the moment and are looking to cut any long scalps at 1841-43 where the nearest and most recent Red Vector candle is. Unless of course we see Blue in the recovery of Reds at these most recent highs.
If the short plays out from here, apart from the most recent Green Vector candles that manipulated us up to these levels down at 1822, 1810, 1805, the juicy Green Vector candle down at 1765 (Wick bottom 1753) looks like a nice place to aim for. The next levels where Green Vector candles exist are down at 1740, 1730, 1720 and of course our ultimate short target to fill the Rogue wick from last August (1668-1680) will be our super extended short targets.
The next Red above is as follows:
First contact 1850, body top 1860 wick top 1866. Thereafter we're looking at a Candle at 1870 and 1874 from 161121. Always be prepared for a potential 200-300 pip override to the upside before the actual drop but that whole area is a mega short waiting to happen. But until we have meaningful Bullish confirmation we will long scalp and hold the short from 1847.5.
Progress check!
22 trades since 11th Jan
13 shorts 10 50-90 pip scalps (3 x 100+ pips)
9 longs 7 50-90 scalps (2 x 150+ pips)
21 wins
1 loss
1 Short running
1 long scalp running
Good luck guys!
This is not financial advice and should be taken with a pinch of salt.

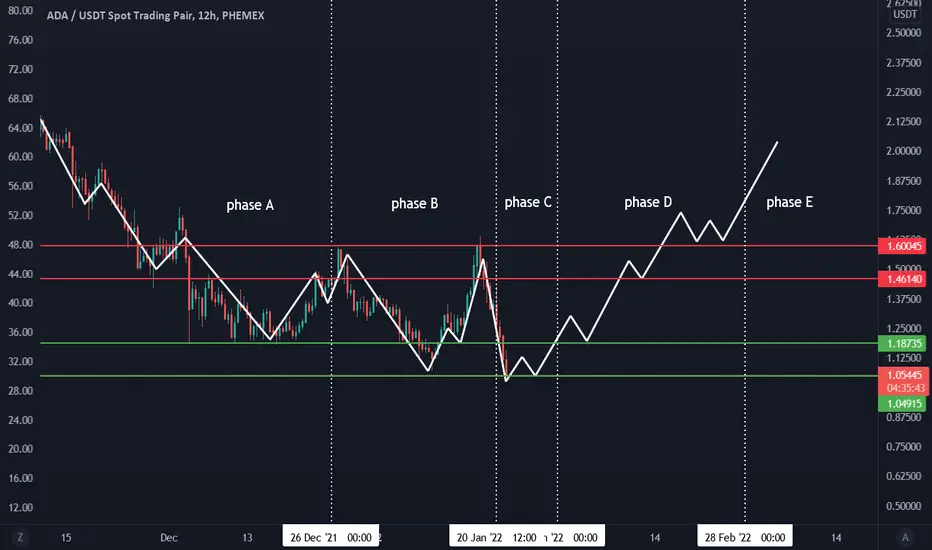
ADA Wyckoff Accumulation SetupThis dip could be setting up a wyckoff accumulation schematic. If this confirms, there will be opportunities for trades in both directions. The same accumulation schematic that I was previously following fell apart between phase D and E, but that was on the 1hr chart. Zooming out to the daily chart, ADA is also running into extremely heavy support between 1.02 and .92 If this support fails and the schematic falls apart, things could get ugly fast.
Wyckoff Accumulation Schematic for reference: forexop.com
SMC !!! BASED BITCOIN (BTCUSDT) TA SCENARIO I am going to explain the revolutionary SM concept in a later educative post.
------------------------------------------------------------------------------------------------------------------------------------------------------------------------------------------------
If you enjoyed this post and agree with me, a like and a sub would be very nice : )
If you have any other ideas or simply disagree, manifest yourself in the comments ⬇️⬇️⬇️
Stay updated for more content
Have a nice Day : ) Bye!
----------------------------------------------------------------------------------------------------------------------------------------------------------------------------------------------

BITCOIN (BTCUSDT) QUICK TA SCENARIO...Let the image speak for yourself...
------------------------------------------------------------------------------------------------------------------------------------------------------------------------------------------------
If you enjoyed this post and agree with me, a like and a sub would be very nice : )
If you have any other ideas or simply disagree, manifest yourself in the comments ⬇️⬇️⬇️
Stay updated for more content
Have a nice Day : ) Bye!
-----------------------------------------------------------------------------------------------------------------------------------------------------------------------------------------------

MARKET MAKER MANIPULATIONHello everyone!
Today I want to discuss with you a very interesting topic - the traps of market makers.
Let's get started.
Traps…
How often did you encounter this - you opened a position, and why did the price go sharply against you, knocking out your stop loss, and as soon as your position was closed with a loss, the price turned around again and went where you expected?
You analyzed your trades and did not understand what you did wrong.
Actually, it's not your fault. You just fell into the trap of a market maker.
These traps are created by large players in order to collect the stops of small market participants, thereby creating liquidity for opening or closing their large positions.
What do traps look like?
As a rule, traps are false level breakouts.
It is in these places that small players place their stop orders and this will be the main goal of a large player.
The first trap pattern is the classic Double Top pattern.
Everyone knows from books that the second peak should be slightly lower than the first. So the market tells us that the price no longer has the strength to make new highs and it's time to fall.
In fact, above the first peak, most traders place their stop losses, and large players push the price to them in order to activate orders and gain liquidity, after which the market reverses.
The second trap situation is the trend.
The trend is our friend! Everyone remembers and knows this.
In addition, everyone remembers that the trend changes when the price, in a bear market, renews the previous high.
After the new high, we believe that the trend has changed, but the price suddenly falls even lower and the downtrend resumes again, what happened?
The big player knows that traders put their stop losses above the last high and that is why the price pushes higher, so liquidity gathers, after which the bear market continues.
How to trade?
We cannot find out the thoughts and desires of major players.
The average trader should analyze the chart and try to act in the direction the market maker is pushing the price.
Pay attention to false breakouts - these are strong signals.
Seeing that the price has updated the maximum, and then turned around sharply, go short, so you will trade in the same direction with a major player.
Also, remember that traps are usually characterized by candles with long tails.
A long shadow will be a false breakout.
Conclusions
Trading traps is very difficult and at the beginning of the path you will fail.
Study the market, try to understand how a big player thinks.
When you learn, this strategy will bring you big profits.
Good luck!
Traders, if you liked this idea or if you have your own opinion about it, write in the comments. I will be glad 👩

The Beast!Last week was a very interesting week when it comes to oil. Friday 14th weirdly stalled for ages before finally breaking into the next box above. It did this with a 1 hour candle 4pm. (UTC) This candle was then rejected back out of it only for the 5pm (UTC) candle to explode through. The first signs of Blue candles in the hourly timeframe were the 13th 13:00 (UTC) and the 14th 09:00 (UTC) giving us indications that the Bull was going to get their way.
This close in the box above, as mentioned in the previous post would signal a journey to the end of the box. We had to wait another hour for the 4 hour candle to close and make sure of the continuation. All of Monday and Tuesday so far have taken us to the top of the box at 85.7.
Where do we go from here? We are definitely holding some longs from 83.5 but have equally enjoyed some short scalps from 85.7 ($0.70 and $0.40) and will see if this gives us a meaningful short from here.
We are also looking out for a kind of behaviour where the highs that we are at get broken, we see a new high and then it plummets.
The main thing we are looking to see is if we get yet another 4 hour close in the next box as if this happens we have a very strong chance of going to $88
but at the level we are at price can go whenever! |There has been a Blue Vector candle at the top in the hourly timeframe. Recovering the Red Vectors from 25102021 this is a bullish indicator. But the main thing that will mean Oil is still Bullish is if the daily timeframe is embedded on the RSI. Once the embedded is lost in the daily timeframe that will be a good indicator that we have a meaningful short coming.
Keep the short scalps short and sweet, hold longs from good buy prices and always be ready to switch to plan B or C at anytime when trading Oil!
Good luck Guys!
This is not financial advice and should be taken with a pinch of salt

Short scalps Done?So it's been a couple of days (4) and we had to wait a while for the 170 pip move from 1828 but added a beautiful short scalp yesterday from 1822. Our target from our last idea we was holding out for was 1810 and woke up to some good news.
The idea of capitalising on scalps while we wait for the big move - whatever direction it will be in -has definitely done us some good. We cannot help but notice however that something big is coming and they will try and use some news this week to be the catalyst. Keep a close eye from Wednesday onwards when Dollar news comes out (all manipulation)
Progress check:
8 short scalps
3 long scalps
With one of them being 170 pips and one being 110 pips I guess they were slightly more than scalps but 930 pips in total in scalps since Jan 11th isn't too bad is it. We would definitely say it beats just waiting around.
Now what are we looking out for? There is a Green Vector (Bottom 1805) candle below to be recovered in the hourly timeframe and we can expect at least a bounce from there if not a meaningful long but we are pretty much done for now until Wednesday when there is news that they can use to manipulate the market.
Keep Short scalps short and sweet until they become "the" short and hold longs from the best prices back to your short entries.
Good luck guys!
This is not financial advice and should be taken with a pinch of salt.

How Short - For How Long - How Long - For How ShortWe wanted to do some 4 hour analysis on the current situation as there has undoubtedly been a lot of pumping through the use of big Vector candles in both directions.
After the $2.60 Short it has definitely been long
So The Green Vector Recovered the Reds at (80) in the hourly tf then gave that $1/$1.20 short just before it printed Blues.
Even though this is a 4 hour analysis that cannot be ignored as 4 one hour candles essentially for a four hour one. The particular 4 hour candle that did the most recent move up on 11012022 consisted of:
1. A 2pm candle which opened at 79.4,cannoned up to 80.08 as a very angry Green Vector candle only to be sent packing back down 78.87 as a now even angrier Red Vector candle to recover the whole of the only slightly annoyed Green Vector candle it printed at 8am that morning
2. A blue candle that opened at 79.05 with no bottom wick and ended up at 79.88
3. Another Blue that opened at 79.8 and hit highs of 81.25
4. And lastly a retail Dark Green candle that did 81.00-81.5
After that it has pretty much been vertical.
The next things that we cannot ignore is that the fact that a massive Green Vector is what did the touching of the Red Vector from 10112021 because we normally get a short soon after. We had first contact labelled at 82.25 and the top of the candle at 84.45 putting 83 slap bang in the middle. It is very scary that it decided to stop exactly around 83. We have observed that the midpoint, 33% and 66% 75% etc points in a Vector are good reversal points even if a trend continues. Due to this we have enjoyed some short scalps and are looking for a bigger short if it wants to continue down.
But if we know anything by now it is that when certain colours retrieve others, certain things happen and at the point of making this analysis a Green was being recovered in the 4HR tf, therefore even if it is to go down there would be a little move up and could even be the continuation. But we have more Green vectors below so you just have to be on point.
But we are looking to short hard if it fails to get back over 83. However the long that is possibly on can go to the top of the top box and way beyond as there are Red Vectors up there from 2014. We are looking below at some of that juicy Green Vector candle as our targets, but are constantly conscious that it has no obligation to recover the whole candle before going up again and it can recover it in multiple visits with vicious pumps in between.For that reason we look for confluences at key levels when a certain amount or all of the Green candle has been recovered to go long again for the resumption of the trend.
We want 4 hour closes in boxes to signal the journey to the ends of them.
Good luck guys!
This is not financial advice and should be taken with a pinch of salt

BTC Fakeout or Breakout Bitcoin whales and institutions love to push the price past resistance, where this movement will trigger short stoploss market orders (aka stop buy limit orders) and also buy stop limit orders.
Both of these in tandem creates a low-grade short squeeze used as liquidity to sell into.

Dangerous times WTIWe are at a funny little junction right now!
In one of our recent 1HR TF ideas ("Like clockwork tight $1.....") we spoke of a characteristic of Oil that is important to know when trying to catch shorts.
That is, when Oil gives $2.60 in shorts it means one of 2 things, either it is showing the beginning of a big drop or it would be a bear trap like the many before it and it would probably rise double the distance of the fall to make a new high.
At the time of posting that, we were already on the Bull Bus and had $1 in the bag, then caught a juicy $1 dollar short from $80-$79 while letting the longs run. but eventually closed the last of those longs (77.8) at $80.8, while allowing partial buy stop longs from 79 (straight after $1 short scalp) where Red Vector recovered Green Vectors at 2pm. (110122)
We got out as of Asian session at 81.3 because where we are is too dangerous for a time of no volume. A $3.80 journey from the low is not bad, even if we didn't get to be in for all of it. However We cannot see it doing $3.80 up and calling it a day, It probably wants to do a bit more but where the hourly is concerned,it may do some dipping before resuming (hopefully activate some sell stops) so we have to be very careful.
Stay disciplined on the short scalps and always be ready to stay long from good buy prices but close shorts quickly when the Bull is in the room.
One of these short scalps will end up turning into "the" short
We will see what we wake up to
This is not financial advice and should be taken with a pinch of salt

Like Clockwork - Tight another $2.30 the other way so farSo the hourly has just done a bunch of the stuff we were observing it may do.
It went for more Green Vector candles below and when it took off from 77.8, it has gone and recovered the Red Vector candles above.
So far it recovered the Red with Green so we entered swift shorts.
All together, the long we allowed to run from 100122 NY session close Ran for $2.30 and we have enjoyed $0.50 and $0.70 on short scalps from 09:00-13:00 and in the current hourly candle. We are holding shorts until we get stopped out on minimum profit and looking to enter next longs when we see Blue or if it shows it is not going down for the other Greens that it failed to reach yesterday.
Let's see what happens at the highs!
This is not financial advice and should be taken with a pinch of salt

Like Clockwork - Tight $1 the other way so farYesterday's Idea was a celebration of getting to the $2 mark or the short we were waiting a week and a half for.
Despite it not making contact with the next Green Vector candle below in the hourly (something that we reaaally wanted) We did get another $0.60 out of the short. (making it a $2.60 short for the partials we left open from over the weekend)
Furthermore we managed to short it twice more for $0.80 each time and catch a very good entry price for a long at 78.8 which we have already closed 50% off for $1. All before Asian session is even done.
When Oil gives you a $2.60 short it means one of 2 things. Either the big short we have all been waiting for has peaked it's head out of the closet and there is more to come when it gets to an Optimum trading zone above that has a Red Vector there.
Or it's a Bear trap like the many before it and Oil is going to probably do at least double the fall or more to get to yet another high.
Whichever one it is, don't be the guy/girl sitting on your hands married to an idea while getting liquidated. Instead be swiftly out of the wrong idea and into the correct one and only hedge if you are close to the end of a move and can actually afford to as there will always be another trade as long as you have a balance still
We will leave some longs (77.8) running to see if resistances are broken and have sell limits at Red Vector candles in the smaller tfs
But have already entered new short scalps at 78.9.Let's see what we wake up to
This is not financial advice and should be taken with a pinch of salt

Bullish view of GoldThis chart looks at Gold's Bullish prospects!
From our other Ideas on Gold anyone will know we are overall Bearish on Gold have been Selling hard since November after the artificial pump up to recover Red vectors at 1860. However we can never ignore the Bullish part as in order to get to the prices we want to sell from it has to go up to get there doesn't it?
But how do you catch the launch pad? We use Red recoveries of Green at lows on 4HR+ tf or the appearance of Blue at the lows. This we have seen and is reason we can hold partial longs from 1785 while attempting to catch great shorts along the way at key levels.
And where do you aim for to come out of the longs and go short? Where you see Red Vector candles to be recovered.
The top of the nearest Red vector in the 4hr being 1823 and the top of the highest one beyond $2000(coincidence?) Key Resistance?
It should be starting to make sense by now the market maker exists very much.
Even when you're long on Gold always be ready to switch it up and visa versa .
This is not financial advice and should be taken with a pinch of salt

Better on GoldGold Started cooking up a long from the point that the 4hr Manipulation (Red) from 060122 Recovered Green from 291221.
Precisely when we closed a large part of the short we entered on 050122 and opened longs to hold through non farm employment of 070122.
The crazy thing sometimes is if you set your trade and walkaway you genuinely sometimes are better off.
Although the bottom wick came very close to shaking us out we achieved our 1802 target yesterday morning and we closed pretty much 80% of our position. (100122)
Today, our very first attempts to re short at 1804 hit our 20 pip stops so we are currently just holding the last 20% of longs from 060122 ($1785)
with stops at 1790 looking at the following areas for possible re-shorts depending on what happens when we are at these respective levels:
1812, 1823, 1833-35 and of course 1846 -1860
Even if it keeps rallying these points will have some kind of reaction as well as good shorting opportunities and one of them is going to initiate a reversal/Continuation depending on how you look at Gold. Downtrend vs Uptrend
There are Red Manipulation candles at all of these levels in various time frames.
We are still pretty short on Gold but are conscious that the same way they can Dump gold, they can pump it too.
This is exactly how we caught the November 16th 2021 Sell. On the 10th Nov a Giant Green candle recovered The big Red candle from the 16th June. This was our cue to look for the short and it took 6 days of faking, shaking, stop outs and TPs, but on the day of 16th Nov 2021 2 angelic candles, one Green manipulation up and one reality check for the "at the top buyers" appeared.
This was the beginning of a 2 week short that gave us an amazing 1200 pips but we closed positions all the way down.
We have since used the same Vector recovery system to go long and short (with other confluences)
This is not financial advice and should be taken with a pinch of salt

Make more sense now?Not too much to say on this one.
not sure if we'll get the whole target but we are happy with what we have so far and are always ready for when it goes Bullish again.
It has grabbed liquidity from these Green Vectors down there but there are still more. This is a lovely place for them to catch Sellers that got to the party late and send price up.
This wouldn't matter much to us as we got in at the top and have pretty much secured the bulk of our positions
This is not financial advice and should be taken with a pinch of salt

Finally at the $2 mark of this short! BoomLoading, Loading and loading and then it happens but they wont let you see it coming.
We have enjoyed a $2, $0.70, $0.50 and $1.10 from 1 PM f US on Friday 7th Jan through to now
This is why you have to stay long while waiting for the big short because they will manipulate price upwards until the point where you think the guys calling "a short is coming" are crazy.
There is again still Red Vector candles to recover above so we are always ready to go long every time a Green vector candle is recovered. Especially when a Red Manipulation candle recovers it or when there is Blue in sight.
If we see this soon, especially as a Green Vector is being recovered right now, we we be long again until at least the red Vector at the top is recovered. Depending on what colour the candle that recovers it is we will act accordingly
Patience is key when trading Oil. But you can never for get about the Bull either.
This is not financial advice and should be taken with a pinch of salt

Naughty Market Maker - Beware Wkly turns greenThe Weekly candle has just turned green with 5 hours to go. Manipulation going on. If you're not already in its a straight 50/50.
When Green Recovers red or even makes contact in cases, we get a short not long after, even if it is to rise again. Well LINK is definitely to rise again regardless. Therefore you have 2 short entries at red vectors provided green recovers them. But more importantly, you know where to take profit from longs, to get back in after retracements.
But if you are semi hoddling $40 (Red Vector candle) is somewhere it can reach pretty soon Weekly in the TF (a month is just 4 candles)
We are in from an average $14 so everything above $17 is a massive gain for us already.
This is not financial advice and should be taken with a pinch of salt

How to Short a Bull market - Next week set up Bull Vs Bear WTIThis is basically the same idea but in the hourly time frame.
78.1-15
77.45-5
76.4
75.9-95
74.7
74.5
74.2
73.7
73.4
72.7
Are all the levels that have a Green vector candle in the hourly chart and will be used to play games when we are down there and if we will bounce and do a crazy Bull rally again, it will be from one of these levels if we see some blue or those Greens at key zones being recovered by Red Manipulation candles
