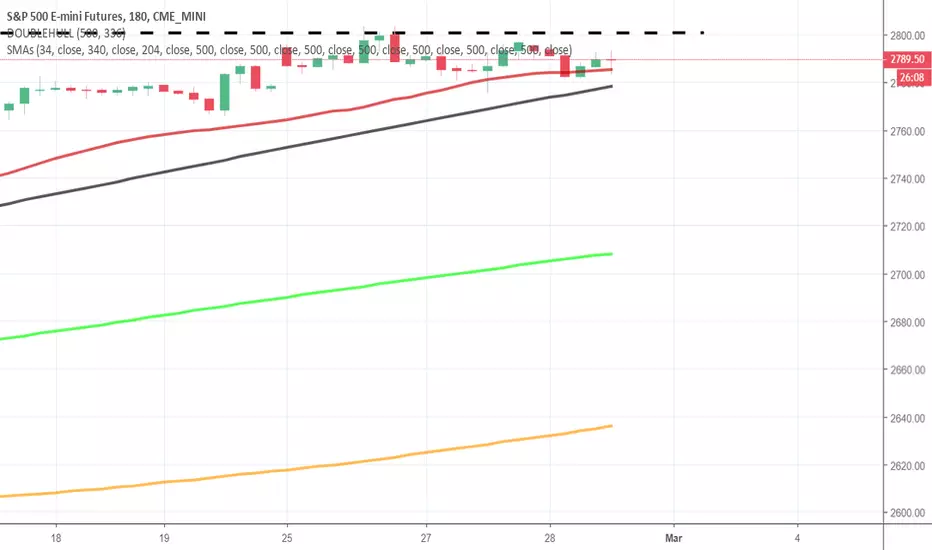
Don't get fooled!!!Guys, I far as I can see, all the hype with the trend reverse is occurring too soon, according to all top-reviewers analyses. The big whales are accumulating and trying to cut the last strongest holders. This stupid manipulation is so obvious that it can't be taken seriously by anyone who has been into trading for some time.
I still believe that the price is going to get to the 1200-1600 level, to get the whales interest into reversing the trend.
*Be careful, trade safe, don't get fooled.
** I am not a professional trader. Just a guy who made 35k$ from scrap and almost lost everything. I have some experience I want to share.
*** This analysis is done only for educational scope and doesn't intend to advise you how to invest your money.
Manipulation

A Nice Momentum Play before Bear Trap Still expecting NZD to be bullish end of next week. This week its short term bearish.
Take advantage of this head and shoulders bear trap in the meantime before we go back up. Expecting a reversal bounce of monthly pivot S3.

CLEAR SIGNS OF MANIPULATION ON BTC!?Today I go over some advanced mass readings and define some excellent ways BTC has been faking us out these past few weeks.
The readings I'm getting make for some choppy trading, I am more inclined to take smaller position sizes until trend clearly defines itself.

Exceptional speculation from mid April '18 onwardsUsing an updated chart of earlier posted opportunity around AUDUSD (AU) I like to highlight and illustrate the exceptional speculation that has been going on since mid April onwards. The first and many incidence of the same speculation has often seen coming in very sudden which indicates a single source instead of graduate forming of buying/selling pressure you see normally when larger long term trends are forming.
Only news events cause such sudden incoming interest in the buying or selling of an asset when it's coming from a group, but then there have to be a profound reason for it been in the news and it always dies out within a few hours. Quite often we have seen USD buying surges since mid April not complying with any of these rules on top of that these volumes were sometimes hidden from public pools and planned very timely to exactly block a USD bearish cycle from bringing down the value of USD or a potential opposite interest such as London open.
The latter is just too silly to observe, suddenly on Tuesday morning Asia timezone when there are normally low volumes until one hour before London open, there would be a ridiculous sudden surge of GU and EU selling at a time it was never seen before. There is simply also no reasonable explanation for anybody selling GU and EU at that time other to stopping GBP and EUR from being appreciated.
Nobody says a word and nobody writes about it since that I have noticed these out of place events. There are some economists speaking in youtube videos but searching for manipulation of USD returns litle results on Google and first few entries are about China manipulating their currency and Google's very nice suggestion list doesn't show a single entry when typing it out into the search field. Well, everybody knows that every single central bank is doing it, all of them. They call it market operations and it published on their websites. Look at the implementation notes published by the FED May this year or read on about RBA market operations published clear in public, just to name two examples but all central banks list it as normal operational tasks as part of their portfolio of services.
Yet search seems to return limited results, making everyone believe very few people are interested in this business. Something so important as a ring-network of almighty controllers manipulating the financial market on a daily basis and nobody would be interested. That doesn't glue very well with me, censored it is, big time, for only one reason, this network of market operators have a lot to hide. More than they trying to let the everyone believe with their website publications.
The dangers are that like this year the speculators are all making to believe the sudden interest is genuine, just to grow a large group of supporters because the FED know it can't beat macroeconomic cycles. At one the these will overpower the built up speculative forces against the macros over 6 months and that contr force will be stronger than ever seen on the market and speculators will realise that at one point in time and start selling on top of the macro selling pressure. That combined could give us the strongest ever seen sling back down from high up reaching far below it normally would go, the so called overshoot could reach the opposite side of the market at USDJPY 67...


Silver Hitting Strong SupportIndicators point to a bounce off of low risk entry.
Look at all that sell volume that hits like a hammer - smells like opportunity. Hitting the strong support of 15.00 on dying volume. CCI, RSI and strong support are on favorable terms for a low risk long at this position. Banks love dumping those futures to acquire physical at the cheap.

THE TRUTH ABOUT TRADING! YOU ARE BEING LIED TOO! (MUST WATCH)Are you tired of FURUS lying to you about the "proper way" to trade? Are you tired of screaming manipulation in your trading when you lose a trade that seemed like it could not go wrong? Are you ready to truly understand market direction and psychology?
Then this video is for you.
Many are fed the ideology that retail minded strategies will make them money in the market. They claim trading is easy... that it is designed for YOU to SUCCEED. This is the greatest lie that was ever told in the history of financial markets.
The truth is, you are designed to lose in the market. You are designed to provide liquidity to the institutional market makers. Nothing else. The market is not designed for you to make money. In reality, its quite the opposite.
My favorite slogan is... The News was the reason for market movement..... "Bitcoin fell 1200$ today because Goldman Sachs is canceling their crypto trading desk". These phrases are what feeds the consistent spiral of retail loses and improper strategy. Once you recognize that the market is manipulated, but that you can trade with the manipulation to fill up your own pockets... is the moment you become a profitable trader.
I look forward to sharing more ideas with you in the future,
Trader_Tristan

CHFJPY Espejo bajista +500 PIPSEspejo bajista emezando en 112.00 topando a la alza con una linea de tendencia y una resistencia muy fuerte, 110.500 como TP1, 500 PIPS de Proffit 106.628 como TP Final.

Bart Incoming for BitcoinSo since we have this continual cycle of pump, consolidate, pump, consolidate; then dump, consolidate: I am expecting a Bart down. It could however go up instead. I am 100% sure though that we WILL see a massive candle very soon. If you want to short/long then flip a coin and put a tight stop loss.
The reason I am expecting a Bart down is because this (according to my previous TA) could be the final leg down to the support at the low 3000s before we see good upwards movement. If we look at the 2014 bull run then we see that there is a possibility of a bart up before continual barting to the support. We see what happens soon I guess.
Neutral position: waiting for btc to hit support before I buy more.


TradingView Continues Garbage Data 3 HR timeframe for ES1!TradingView Continues Garbage Data 3 HR timeframe for ES1!

ES1! Feb 25th 3 Hour Candle Sticks Don't Load - Garbage DataWhat is going on - the 15 Minute chart shows Feb 25th data but the 3 Hr view does not load the 3 hour candlesticks?!?!

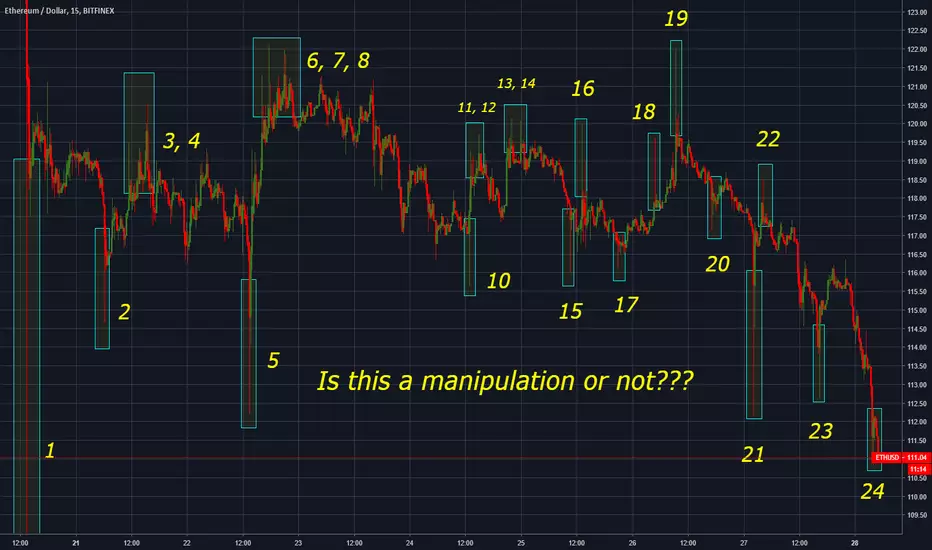
SHOCKING! What a manipulated move on Ethereum and Bitcoin!Dear traders.
In this analysis we appositely left in the chart the previous trendlines and targets.
We identified as the last resistance the red rectangle in the 160$ area: it was really clear to see that was a key level for Ethereum.
And the manipulators did an amazing job this time, here is why:
a) They destroyed with incredible power all the resistances, and it seemed like also the biggest resistance at 160$ was left behind. This means that every breakout trader bought over 160$, giving them good liquidity to close their orders.
b) Once the manipulators sold successfully their position, what is better than an illiquid Sunday night to make the market dump and buyback?
In short words, they made you believe this was time for a reversal and then smashed it 15% down.
PREDICTION
But let's focus on the future: what's next?
This leg down has two possible scenarios
1) Bullish:
the reversal could be near, and they crashed the market to create more incertainty and fill their bags more. The market seemed quite confident in the previous week (look at LTC, NEO or ETH), and if we rally up 10$ dollars we could have the same power as before.
2) Bearish:
Unfortunately 70% of the times I saw this pattern, a second leg down (and sometimes also the third one) is likely to happen. If we can't manage to keep the price over the support line, then another 10/15$ leg down is very likely.
Please, let us know your thoughts on this idea!
Trade safely
BFCM

Bitcoin Short to Test Monthly 50 Moving Average- For educational purposes only -
The latest move imo was to clear the shorts that 'had it right' expecting a move to the Weekly 200 Moving Average, we just missed that.
I believe we are going to do a headfake 'breakout' to trap retail longs and reject off of the 250 Band (Daily).
Short -- 3734 - 3841
Take Profit -- 3101
Stop Loss -- 3955

BTC BartThe pump we just had looks to be fizzled out, with volume returning to normal as well. We may actually see it bart back down again. The past 2 months have been riddled with barts (implying low-volume price manipulation).
Unless we see some type of Chad staircase form then I suspect us barting down.

BTC Obvious BartThis is the most obvious bart in all of bitcoin history. Dead volume, sudden spike in volume and price, then dead volume and slowly bleeding price with a curving down RSI. Really if you don't understand how this space is manipulated by whales and exchanges to liquidate both shorts and then longs, then you should move over to forex or something.

This is wild wild west! Ethereum and Bitcoin manipulation!Sure, except those pump and dump coins, but even so, Bitcoin and Ethereum are almost the same P&D coins, but at a lower level and more frequently.
A lot of spikes, tons of Bart heads, rarely respects any technical analysis, there are no rules, system overloaded, no reglementation...
This is wild wild west!
Bitmex Price Manipulation Detection Using XBT/BXBT ratio divergence with price movement set ups and sentiment.

When Lambo? Bitcoin (BTC)Market manipulation
What is Manipulation
Manipulation is the act of artificially inflating or deflating the price of a security or otherwise influencing the behavior of the market for personal gain. Manipulation is illegal in most cases, but it can be difficult for regulators and other authorities to detect. Manipulation is also difficult for the manipulator as the size and number of participants in a market increases. It is much easier to manipulate the share price of smaller companies, such as penny stocks, because they are not as closely watched by analysts and other market participants as the medium and large cap firms. Manipulation is variously called price manipulation, stock manipulation and market manipulation.
BREAKING DOWN Manipulation
Manipulation takes many forms in the markets. One way people can deflate the price of a security is by placing hundreds of small orders at a significantly lower price than the one at which it has been trading. This gives investors the impression that there is something wrong with the company, so they sell, pushing the prices even lower. Another example of manipulation would be to place simultaneous buy and sell orders through different brokers that cancel each other out but give the perception, because of the higher volume, that there is increased interest in the security.
Two Types of Stock Manipulation
These false order techniques are often combined with the spreading of false information through online channels and message boards that other investors may frequent. The outside barrage of bad information combines with seemingly legitimate market signals to encourage traders to pile on or off a trade. The pump and dump is the most frequently used manipulation to artificially inflate a micro cap stock and then sell out leaving later followers to hold the bag. The opposite of the pump and dump is the less common poop and scoop. The poop and scoop seems to be used less because it is harder to make a legitimately good company look bad than it is to make an unknown company look amazing.
One Type of Legal Manipulation
Currency manipulation is a slightly different class of market manipulation, as only central banks and national governments can engage in it and they are legal authorities in and of themselves. Being the owner of a currency legitimizes many of the actions these governments take to suppress or inflate their currency's value compared to its peers. Even though currency manipulation is not illegal, a country that is manipulating its currency may be challenged by other nations or punished through sanctions passed by its trading partners. Moreover, international bodies like the the World Trade Organization (WTO) have been encouraged to play a stronger role in addressing accusations of currency manipulation.
www.investopedia.com

Does the "News manipulation" really work?Here are some famous BEAR calls that have been qualified as "news manipulation".
The only thing that appears clearly to me is that all these predictions were made when the market was **already** falling.


