BTC- Sudden pump WHY? DON'T FALL FOR ITHey everyone, today I will bring you guys my perspective on this rally.
Here we can see an analysis in the 15min chart :
This analysis is based on symmetry, as we can see , this pattern was already made by the smart money, check 28 Dec 2018, similar strong volume , even before the big jump, the price movement is really similar.
If we look at the RSI, in 28 Dec 2018 it was around 89 , and now it is around 90-91 , the patterns are so similar, typical play of smart money, also know as "bart pattern" .
The blue rectangles are the range it will probably stay in before breaking downwards.
Most probable scenario
-Consolidation for 1 day or 2 and then dump to around 3850.
Smart money accumulated and is now selling into the pump, that's what most people don't understand, while the retail investor is buying, they are selling!
Always be on the side of smart money, that's how you make money.
I will keep updating!
If you want to share your ideas , comment down below and like if you enjoyed this analysis.
Manipulation

Sideway Movements With Lots of SpikesThe past few days have seen again bitcoin doing some interesting patterns.
It is basically performing a move called "Sideway Movements With A Lot Of Spikes"
Usually A spike will occur and it will demonstrate a trend continuation or a trend reversal.
But today, yes, today on the 4 hour chart. It is the 4 hour chart. We are literally seeing
"Sideway Movements With A Lot Of Spikes"
***This is just information sharing

Strange Movement for BTC/USD over the past few days. Something strange just happen for BTC/USD for the past few days.
The RSI has increased close to 40 over point but BTC/USD has raised to the highest less than 200 point.
***This is just information sharing.

Evidence of Price Manipulation In BTC/USDThis is what happen to me recently.
So on the day, which everyone should notice, there is a sudden outbreak on the chart as shown which later straight after the 2 min 200 odd points rise, there is no more bullish movement.
A few days later, the same thing happen. But this time round, the exchange that I am on temporary halts all trading. The reason when I ask the support was to protect everyone interests.
I did not made an official complain to the exchange. But obviously someone else or a lot of other people did. So seasoned traders must have found something suspicious with that outbreaks and they made official complains to the exchange which then implement measures.
Unless a regulatory framework is in place, bitcoin is still very prone to price manipulations by whales whose actions do not really justify much technical analysis as they seems to be running on very deep pockets of billions of dollars.
Their real motivations are unknown. But I would like to ask everyone to exercise caution when trading bitcoin.

Manipulations !!Manipulations
bitmex whales did good move by liquidating all high leverage longs .. which i warned about it before .. in this kind of markets you cant use high leverage..
this dump just hit the support channel as we see on chart ..
50 EMA already crossed over the 200 EMA and retesting it again ..
btc still in the uptrend channel and breaking it at 3730ish will cost btc a big move down to the next fib points between 0.5 and 0.618 fibs as shown on chart .. 3650/3542 areas
so longing scenario would be fine if u start laddering it from the uptrend channel which pointed on chart to the way down to 0.618 and stop your loss under 3500ish
shorting now dangerous ,. im still waiting a pullback and im fully bullish on btc .. just don't use high leverage 5x maximum
good luck guys

How I see the BTC market developing First -- I think TA is possible with longs/shorts charts there are active support and resistance points that may lead the btc price
second -- The top right chart is the ratio between longs and shorts... Today I've noticed increasing longs and decreasing shorts through this sideways period, today in-particular, there have been large moves in these charts and little corresponding moves in price. I'm not exactly sure how price can be reacting so little to sharply decreasing shorts and increasing longs but it is Bitfinex so I'm sure there's some shady shit going on in the background.
I don't see bitcoin having another major bull run for a couple years but I do think price has found a bottom. I don't see predictions for 1500 or 2000 as being viable levels that btc spends a prolonged amount of time. Hashrate is increasing again so this is a good sign that the mining purge is over.
Only way I see it possible that there is no move in price despite changing leveraged longs and shorts is a whale has an insane btc wall that he's buying into (convinces others to sell their coins so he ends up with net profit with price increase)

Last CME Futures Dump-PumpToday CME BTC Futures expire
Last time (30-11-18) there was a Dump-Pump of 5% x 24h @10:00
At current Vol any manipulation can have an huge impact
I'm not an expert of CME, so any idea/comment is welcome

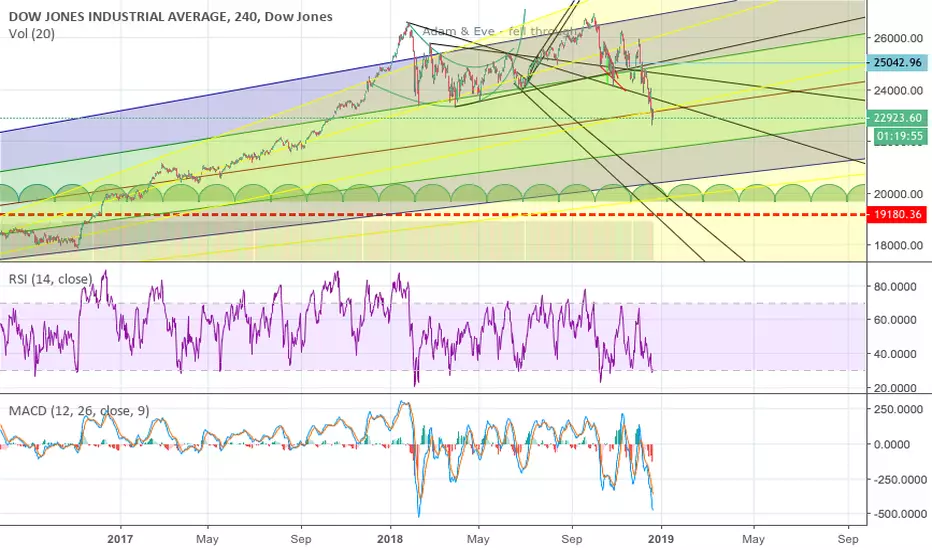
When will the Plunge Protection Team strike?That the Plunge Protection Team has been called in means there is big trouble! The PPT is a real lawful entity designed to manipulate the US Stock Markets. It is officially known as the Working Group on Financial Markets (WGFM). It was created by by President Reagan’s Executive Order 12631 in 1988 following the 1987 crash. Its purpose is to lawfully prevent catastrophic market crashes. All the above factual knowledge is available from reputable sources findable via your fav search engine.
This is both good and bad news. Those short in the market could protect their positions - and if they have enough guts take long positions for a limited period. It's not my business to say when to do this, as I have no advance knowledge of the future or when the PPT will strike!
Note carefully that my language above is speculative, except that Dow and Wall Street are in big trouble. This is now common knowledge as the fall in the market has well exceeded the respected figure of 16%. If/when the PPT weighs in it'll have to be with billions and billions of US-Dollars, as loads of people are likely to set up sell orders for the next opening of the markets.
That the PPT has been called in does not mean that they have a 100% chance of moving the US markets north.
It all depends on whether they have enough to push back the deluge of selling they're likely to meet. Nobody I know, knows exactly how the PPT works. Perhaps they will get first orders, beating back all regular investors from selling or shorting . That would make sense. If they are successful, Forex pairs especially those with Yen and AUD could be affected by indirect effect. What it would mean for US-Dollar strength, is another problem.
Note also that other countries have variants of the PPT, some operating covertly.

Hope you caught that wick.....Hope you got luck and caught that wick at the bottom... Def some type of manipulation...


BTC manipulation. Big boys game vs Bakkt delays. What's next?
Hi everyone, I am looking to Bitcoin from another perspektive.
Why this drop happens in this strong months?
Why Bakkt delays Bitcoin futures launch?
Why is drop start one day before Bakkt info public?
Big players play with us and with hodlers, they want to BTC cheap, Institutions buy bitcoin cheap for your futures interest.
Is Bitcoin for 3-4000usd cheap enough?
I think that this players after 20. November just accumulate Bitcoins, new wallets with big transactions open after drop, this can be last chance catch this price.
Wallets: bitinfocharts.com
Look at second wallets or another.
If you have some idea about this or futures for price BTC or another perspective please leave in comment.
Dont forget likes or follow :)
Thank you

BTCUSD - Local Swing Fib ShortPremise:
1. The 4hr Hidden Bearish Divergence will cross at a possible sign of weakness (some sort of distribution/reversal pattern on lower timeframes) on the SRSI. The RSI beardiv is confirmed.
2. The OTE will be where this Bearish Divergence crosses
3. The former support during the trade will get cut through - if the 4hr recrosses backward into positive territory, the divergence is invalidated
Execution:
1. 1:2:3 entry at 4020, 4100, 4175, hedge + 2x cross short
2. Stop at 4371
3. Target 1 : 3607
4. Target 2 : 3000
Result:
1. A 6:1 RR trade is completed.


Small Accumulation on the bottom of SpringIt looks like we have small accumulation on 1H on the bottom of Spring from my first analysis. I don't think it will be spring on this interval.
DXY one final liquidity push and we going downTVC:DXY going back up for you know to fuck the shorts and stop losses. Welcome to the $$ manipulation simulation.

XMR/BTC could be small dip (OKEX dirty play)RSI shows that there is still a chance of a small dip. And i've got very weird suggestion to sell Monero from OKEX in LiveChat cause of their "XMR wallet update", that advices could cause a small dip and affect XMR/BTC price a little.

Bitcoin referenced with historical data.(A lost cause)people dont care for the technology really./ - "fact"
A wild goose chase. Nothing more.
This almost most accurate representation of previous Historical Pump&Dump
take the levels with a salt of grain. nobody really knows shit.But we cant even tell whats going to happen in this moment in time how the fuk are we supposed to predict the future.
TA only works cause people see this happened last thus this will happen this time.(this is also just a 50% probability.)
At this moment in time sitting in my room I dont even know when Im gonna sleep its already 2:14 AM.
I just wanna end with this note from "The office":
"bears beets battlestar galactica.


BTC further may be subject to manipulation#BTC
An alternative market development scenario might look like this: if the price is lowered to 4000, then the majority will believe in further draining to the supports of 3600 and 3200, maybe we will see an increasing number of shorts. But as a rule, the market often knocks out stops or does not reach the expected levels, so in this situation the price may turn around just below 4000, without going down strongly. Since lowering the price below is too expensive, we can again fluctuate sideways for a long time, but already around 4,000, and after (when the market chooses the direction of the trend and the majority starts to gain position), you need to be ready for market maneuvers to remove stops. Do not forget that some maneuvers help the market to make. As before, we are dealing with a large number of manipulations, remember this, open transactions only having considered all possible options.

Bottom of Spring.We have local selling climax, which should be bottom od Spring from my previous analysis. We can slightly deepen actual low due to SL hunt. But it's probably here

