Mantle Eyes Explosive 22% Rally Toward Key $1.29 TargetHello✌️
Let’s analyze Mantle’s price action both technically and fundamentally 📈.
🔍Fundamental analysis:
Mantle is launching a crypto bank and a $400M MI4 fund with BTC, ETH, SOL, and stablecoins in Q3 2025. If it takes off, MNT could see more use and interest from big investors.💹
📊Technical analysis:
BYBIT:MNTUSDT has held its value and respected key Fibonacci support levels during the latest market pullback 📉. Backed by solid fundamentals and strong bullish volume, I maintain a positive outlook, projecting a potential 22% move toward the 1.29 target 🚀.
✨We put love into every post!
Your support inspires us 💛 Drop a comment we’d love to hear from you! Thanks, Mad Whale
Mantle

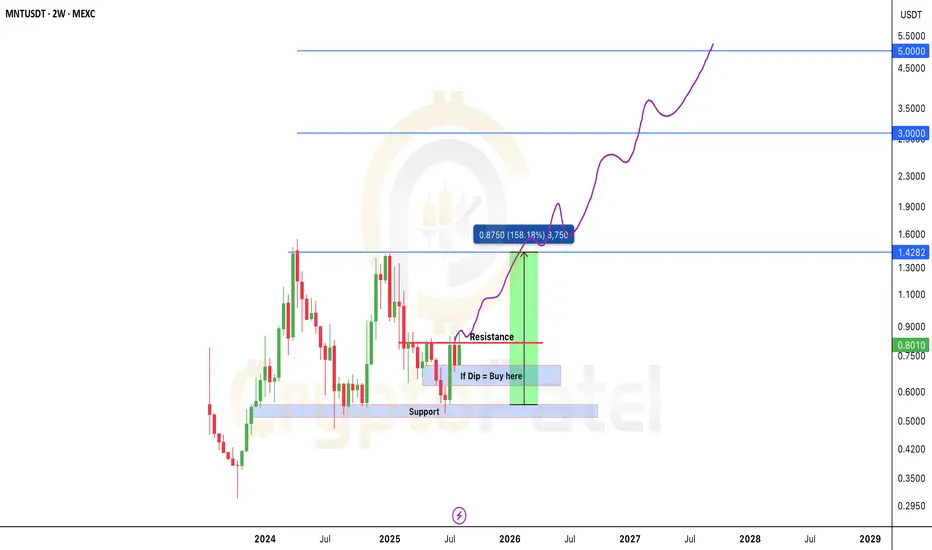
Will MNT/USDT 5x to 10x Potential Post BreakoutTSX:MNT Forming Bullish Structure – 5x to 10x Potential Post Breakout
#MNT is currently trading very close to a major resistance level at $0.82.
We’re waiting for a clean breakout above this zone. Once confirmed, price can potentially deliver a 5x–10x move in the coming days.
If price retraces, the best long-term entry zone would be around $0.70–$0.60 — right inside the accumulation box.
This bull run has strong structural support around $0.55–$0.50. As long as we stay above this zone, we remain highly confident in the upside move toward $5.
Key levels to watch:
Accumulation Zone: $0.60 – $0.70
Resistance: $0.82
Support: $0.50 – $0.55
Bull Run Targets: $1.42 / $3 / $5
NFA & DYOR
$COOK+$MNT: Low risk buy + airdrop + yieldNYSE:COOK and TSX:MNT are DeFi gems with strong upside. NYSE:COOK governs mETH Protocol (TVL: $2.19B, 4th-largest ETH staking platform), TSX:MNT fuels Mantle L2 ( SEED_TVCODER77_ETHBTCDATA:3B TVL, 29% address growth, 44% new users).
With Methamorphosis Season 3 (until Sep 22, 2025) airdropping 250M COOK via Powder points and the Cook feast rewarding holders, you should not miss out on these.
Ways to farm farm S3 :
*Stake mETH/cmETH (0.02 ETH min, 10 Powder/day per mETH)
* Lock TSX:MNT , or engage with dApps (e.g., Karak, Pendle).
Best of luck!
Cheers,
Ivan Labrie.

TradeCityPro | MNTUSDT Effects of the Bybit Hack👋 Welcome to TradeCityPro Channel!
Let’s dive into the analysis of the popular DeFi coin that’s active on the Mantle chain—where they’re running multiple airdrops and utilizing it for fees. Let’s break it down and analyze it together!
🌐 Overview Bitcoin
Before starting the analysis, I want to remind you again that we moved the Bitcoin analysis section from the analysis section to a separate analysis at your request, so that we can discuss the status of Bitcoin in more detail every day and analyze its charts and dominances together.
This is the general analysis of Bitcoin dominance, which we promised you in the analysis to analyze separately and analyze it for you in longer time frames.
📊 Weekly Timeframe
After hitting 1.4077, which was our previous ATH, there were practically no buyers present here, preventing us from breaking this key ceiling and moving upward.
Additionally, after the rejection from this high and an engulfing of the previous two candles, it’s safe to say our upward movement has concluded, and we’re now heading into at least a period of correction. This has already started as we’ve entered a resting phase from the prior trend.
However, after breaking 0.9030—coinciding with the news of the Bybit hack and the theft of Ethereum and its coins by North Korean hackers—we experienced a sharp drop. Given that Bybit held a large volume of this token, the decline was even more pronounced.
📉 Daily Time Frame
In the daily timeframe, after the rejection from 1.4077 and a deep drop, we moved upward again. This time, we hit resistance at 1.2353 multiple times, but nothing happened—buyers couldn’t push above this level.
With this lack of buying pressure, sellers stepped into the market. We then formed a support at 1.0102, but after breaking it—along with the hack news—we saw a sharp drop down to 0.06552! This level is highly significant!
It’s important because this was previously a key resistance, and after breaking it earlier, we kicked off our main uptrend. So, it’s a critical support now, and it won’t break easily! However, if this support does fail, we’ll likely see a drop to 0.5340.
For buying, it’s not a good time yet. But if we get support at 0.6552 with a strong daily candle, we could consider a buy. Alternatively, wait for a box formation and structure. Our current entry trigger would be a break above 0.8464. For selling, my stop loss would be below 0.5340.
✍️ Final Thoughts
Stay level-headed, trade with precision, and let’s capitalize on the market’s top opportunities!
This is our analysis, not financial advice always do your own research.
What do you think? Share your ideas below and pass this along to friends! ❤️

Trading opportunity for MNTUSDTBased on technical factors there is a Sell position in :
📊 MNTUSDT
🔴 Sell Now
🪫Stop loss 0.8860
🔋Target 0.7000
📏 R/R 1,8
💸RISK : 1%
We hope it is profitable for you ❤️
Please support our activity with your likes👍 and comments📝

TradeCityPro | MNTUSDT Effects of Bybit Hack👋 Welcome to the TradeCityPro channel!
Let's analyze and examine the main chain mantle coin and examine the effects of the Bybit hack last month
🌐 Overview Bitcoin
Before starting the analysis, I want to remind you again that we moved the Bitcoin analysis section from the analysis section to a separate analysis at your request, so that we can discuss the status of Bitcoin in more detail every day and analyze its charts and dominances together.
This is the general analysis of Bitcoin dominance, which we promised you in the analysis to analyze separately and analyze it for you in longer time frames.
📊 Weekly Timeframe
On the weekly time frame, this coin was in good condition and was near its new high and could even break this resistance level well!
But the continuous events of the crypto market caused a deep correction of 50% of this chart, from Trump's tariffs to the Bybit hack, and since the MNT coin was one of the main Bybit holding coins, it caused its recent fall.
In this timeframe, we made our purchase for DeFi at the level of 0.6577 and now it is only a little in profit, although we took out some with the weekly engulfing candle, but I will continue to hold and if we lose 0.5457, I will exit completely.
📈 Daily Timeframe
In the daily timeframe, after the daily box between 0.5457 and 0.6622 broke and momentum entered, we started our move and reached a very important resistance level of 1.3947 and after that we recorded a lower ceiling.
After breaking the important bottom of 0.9311, the exit trigger It was our spot that became active and after pulling back to it, we experienced a continued decline and now we are back to important support which was previously the ceiling of our ascending box and is an important level for us!
It is not a good time to buy again right now and we need to form a new structure, but the fact that we have a weak downtrend can be a good sign in itself, but we still need to create new space for now. For selling, I will wait and cash out my coins below 0.5457 and say goodbye to this coin without bias :))
📝 Final Thoughts
Stay calm, trade wisely, and let's capture the market's best opportunities!
This analysis reflects our opinions and is not financial advice.
Share your thoughts in the comments, and don’t forget to share this analysis with your friends! ❤️

TradeCityPro | MNT: Deep Dive into Mantle's Market Dynamics👋 Welcome to TradeCityPro!
In this analysis, I want to examine the coin MNT for you, which was requested in the comments. So, if you want a particular coin analyzed, feel free to mention it in the comments, and I will review and analyze it for you.
👀 Mantle project is one of the Ethereum Layer-2 projects, and its official coin is MNT. Like other Ethereum Layer-2s, its aim is to provide greater scalability, faster transactions, and lower fees. Let's proceed to technically analyze this coin.
📅 Weekly Timeframe
In the weekly timeframe, as you can see, there aren't many candles in the chart since the project is set for 2024, and it hasn’t been long since the coin was listed. As you can observe, the price is in a large range box from $0.5443 to $1.4049, hitting the bottom and top of this box several times in this timeframe.
📊 The market volume is ranging, and it seems that there hasn't been much difference in the inflows and outflows of money in this range box. The most critical trigger for buying spot right now is the breakout of $1.4049, which is the ATH resistance of this coin. If this resistance is broken, the price could move towards higher targets. If this resistance is breached, I will update the analysis for you and review the upcoming resistances and potential targets together.
✨ Besides these two important areas, there is also the $0.8946 area, which seems very important, and as you can see, the price has had many contacts with this area in the shadow in this timeframe. The main support, as mentioned, is at $0.5443, and if this area is broken, we could say that the trend of this coin will be bearish.
📉 The last support, which is also the main price floor and ATL, is $0.3197, which could be the first bearish target if this coin becomes bearish. Given the small number of weekly candles, I don't see any other specific data in this chart, so it's better to move on to the daily timeframe to see the market with more detail.
📅 Daily Timeframe
As you can see in the daily timeframe, we can examine the price movements with much more detail, and as you see, there was a box between the area of $0.5453 to $0.6533, where the ascending trend of this coin started after breaking the top of this area and continued up to the area of $1.3961.
🔍 After the price reached this area and completed its ascending leg, a new box was formed, with the bottom of this box at $0.9490 and the top, as mentioned, at $1.3961.
🔽 The price has tested the floor and ceiling of this box several times and is currently near the box's floor. Therefore, if the floor of the box breaks, we can expect further corrections, which might reach the 0.618 and 0.786 Fibonacci areas, where the 0.618 area corresponds to $0.7736, and the 0.786 area roughly overlaps with the $0.6533 support.
⚡️ In RSI, as you see, we have a very good area where the floor is 41.97, and the ceiling is 55.86. Breaking either of these areas could indicate the entry of momentum in that direction in the market.
💥 The market volume is decreasing after reaching the box's ceiling, indicating that a market movement is approaching. Therefore, you can enter a position if the ceiling or floor of the box breaks. I suggest you keep an eye on it to do so. An earlier trigger for a long would be 1.2341.
⏳ 4-Hour Timeframe
In this timeframe, I want to specify only the futures triggers for you because we have already performed the analysis in higher timeframes, and there is no need to repeat the same discussions.
🔑 For a short position, you can enter if 1.0062 breaks. I don't see a good area in RSI for a break and the entry of bearish momentum. However, the main short position, which would be if 0.9490 breaks, could overlap with a break of 30 in RSI.
📈For a long position, you can enter if 1.0685 breaks, but this position is very risky, and the main long positions would be if 1.2341 and 1.3961 break. A break of 55.86 in RSI could be a suitable confirmation for a risky long position and might overlap with the area of 1.0685.
💫 Market volume has decreased significantly in recent days. As I mentioned in the Bitcoin analyses, so be aware that, as I said, when the volume decreases and reaches its possible minimum, the market movement will be much easier, sharper, and faster.
📝 Final Thoughts
This analysis reflects our opinions and is not financial advice.
Share your thoughts in the comments, and don’t forget to share this analysis with your friends! ❤️

$MNT - One of the Most Promising Layer-2s
Mantle Network's (MNT) token is truly distinguishing itself among Layer-2 blockchains. Notably, it's the only Layer-2 to show positive performance over the last seven days while also boasting the highest mindshare, securing a spot within the Top 35 coins by market capitalization.
Mantle is carving out a significant niche in the DeFi ecosystem, recognized as one of the most promising Layer-2 solutions due to its unique modular architecture. This design separates transaction execution, data availability, and finality into distinct layers, enabling each to be upgraded independently and to incorporate the latest technological advancements.
MNT has emerged as one of the best-performing large-cap altcoins in the current market cycle. The vision of integrating blockchain with banking has been a long-standing goal, and Mantle is on track to make this a reality through its core innovation pillars in 2025:
- A shift towards leveraging artificial intelligence.
- A dynamic rebranding alongside organizational restructuring.
- Launch of an Enhanced Index Fund.
- Introduction of Mantle Banking, aiming to provide a Revolut-style on-chain banking service.
This indicates a strong potential for further growth, with MNT appearing more resilient compared to many other altcoins in the market.
Technical Outlook:
We got a strong bounce at 0.90s, and if we continue to hold $1, we can see it going to $1.80 to $2.50 (short-term)

TradeCityPro | MNT: Momentum in Mantle's Layer 2 Network👋 Welcome to TradeCityPro!
In this analysis, I’ll review MNT, the token for the Mantle Network, which is a Layer 2 solution on Ethereum. Over the past few weeks, this token has shown significant bullish activity. If you’ve been following our YouTube channel, you’ve likely participated in the Cook airdrop on Mantle and bought MNT at lower prices.
🔍 After the price reached the $1.2701 zone and made a false breakout, it failed to reach the $1.4386 resistance level and began a correction, retracing to the 0.236 Fibonacci level.
📊 Despite the ongoing correction, selling volume has decreased, and green candles exhibit higher volumes, indicating the strength of MNT’s bullish trend.
📈 If the price breaks through $1.2701, it can easily register a new all-time high. However, to determine the precise targets, we need to wait for the breakout confirmation and utilize Fibonacci extension levels.
🧩 If the price fails to hold the 0.236 Fibonacci level, it could drop further toward the 0.382 level, which overlaps with the $0.9248 support zone.
🔽 Further support zones include the 0.5 Fibonacci level at $0.83 and the range between 0.707 and 0.786 Fibonacci levels, which intersects with the $0.655 support zone.
A breach of the $0.655 support would indicate the end of the uptrend, with the final major support resting at $0.5373.
✨ Additionally, breaking the 50 RSI support would increase the likelihood of a bearish continuation scenario.
📝 Final Thoughts
This analysis reflects our opinions and is not financial advice.
Share your thoughts in the comments, and don’t forget to share this analysis with your friends! ❤️ above.

Mantle (MNT)Mantle (MNT) is a Layer 2 scaling solution for Ethereum, built on top of the Ethereum blockchain. It leverages Optimistic Rollup technology to securely log transactions off-chain before settling them on-chain, offering lower transaction fees and higher throughput compared to Ethereum.
Anyway, MNT chart is straightforward; an upward wave followed by a correction which went down to 0.618 Fib retracement level. Then MNT broke the correction downtrend line and is going up. Let's see how high MNT can go.

MNT - Is it a Perfect Buy Opportunity?The current support level presents a tempting opportunity.
Currently trading at $1.10, finding support on the 4-hour timeframe chart. If bulls can hold the price at or above this support level, it could signal a potential reversal and an upward trend.
If the bulls can maintain control, $1.1452 is a possible target price. This represents a potential upside of approximately 4% from the current price.
Caution is always advisable, conduct your own research and employ proper risk management strategies before making any investment decisions.

MANTLE (MNT)Mantle (MNT) is an emerging cryptocurrency that focuses on creating a robust layer-1 blockchain platform aimed at delivering high scalability, security, and interoperability. Mantle aims to streamline blockchain adoption across various industries by offering a flexible and efficient framework that supports a wide array of decentralized applications.
The current price of Mantle (MNT) is $0.97 with a 24-hour trading volume of $10 million. MNT has seen a rise of 15% in the last 24 hours, reflecting increasing market confidence and investor interest in its foundational technology.
Given Mantle's commitment to advancing blockchain utility and its recent positive market trends, the next price targets for MNT might be set at $1.2, $1.40, and $2.45. Investors could consider taking a position at the current price. This trading idea takes advantage of the ongoing enthusiasm for innovative blockchain platforms that promise to facilitate broader adoption and enhance technological capabilities.

$MNT macro analysis ⏰ BITDAO / mantle Anything below $1.5 is good BUY ( #DYOR )
Below red box 📍 analysis get invalid 📌 🛑 stop
Expecting target 🎯 $20 ( +1500% / 15x from here )
Important resistance levels $5 & $10
Follow article for future updates 📌 and boosting 🚀 helps me ,
I was quite busy, so i will submit rest of details in future, so save article / analysis

MNT/USDT Gearing up for an Explosive Rally? 👀🚀MNT Analysis💎Paradisers, turn your gaze to #MNTUSDT, currently in a demand zone, hinting at a potential bullish breakout.
💎At the moment, #Mantle is on a rising path, indicating a bullish phase around the $0.741 support zone. This pattern aligns with an ascending channel, consistently finding support within the channel across several instances. If the momentum is maintained, we're poised for a dynamic bullish push towards the $1.30 supply zone.
💎However, if #MNT encounters difficulty in keeping up its bullish posture at the $0.741 mark, it might prompt us to reassess our strategy. This could lead us to look for a bullish response from a slightly lower demand area at $0.582.
💎Keeping alert to these market movements is critical, as a drop below this crucial point may call for a recalibrated approach, especially amidst challenges to continue the bullish momentum in the #MNT market.

Mantle in a Tug-of-War with Monthly Pivot, But Bullish Signs EmeIn the ongoing battle between buyers and sellers, Mantle is currently locked in a tug-of-war with the monthly pivot point. The price has found support around ~0.7873, a level that previously acted as resistance. This potential reversal of roles suggests a bullish bias could be emerging.
Adding credence to this possibility is the RSI indicator. If the price can decisively break above the monthly pivot, the RSI would likely follow suit, confirming a potential bullish breakout.
Key technical points:
Price finding support at previous resistance level (~0.7873)
Monthly pivot point acting as a potential hurdle
Confirmation signal:
RSI breaking above its current level alongside a price breakout above the monthly pivot
This is just a potential trade idea based on technical indicators. Always conduct your own research and analysis before making any trading decisions.

MNT Weak coinMantle is showing weakness while lot of alts are pumping. 0.63 is a strong resistance, and i think we will a reversal bearish pattern when we will get there. First target to start closing the short trade will be around 0.555, a great support zone

MNT/USDT upward momentum? ?👀🚀MNT Today Analysis💎 Paradisers, let's focus on #MNTUSDT, which is currently displaying a noteworthy trend. After breaking above a key resistance, it's showing a strong likelihood of a bullish move following a retest.
💎 Recently, #Mantle has demonstrated an upward move from the support level of $0.5691. As the price now attempts to breach the resistance at $0.6587, we can anticipate a bullish shift at the BOS level of $0.6256, provided the price maintains its momentum above this level.
💎 However, as always in the ever-changing crypto market, #MNT traders should be prepared for a range of outcomes. If the price struggles to hold its ground at the BOS, a prudent approach would involve preparing for a bullish comeback from a lower support level, specifically at $0.5338.
💎 It's crucial to note that a fall below this support level could call for a significant strategic shift. Such a development might indicate potential hurdles in sustaining a bullish trajectory in the market.

MNTUSDT----> new ATH if...Hello to all you crypto lovers!
I hope you like my new design :)
First,
let me say that this currency MEXC:MNTUSDT does not have a high market cap and market depth and may have a lot of fluctuations, so enter with a very, very low percentage of your capital .
second,
Assuming that the current upward trend of the market is maintained , it seems that there is a good buying position on MEXC:MNTUSDT
Generally
If the yellow line is broken by the price with power and momentum, I think the price of 60 cents and above (new ATH ) is not out of mind, and if the blue line is
broken, we will hold back for now!
Considering the above conditions:
Entry 0.42$
TP in order 0.5$ 0.6$ 0.76$
SL (Depending on your risk tolerance and the amount of your investment) 0.34-0.37$
