S.C. Corinthians Fan Token SCCP Price X10Ladies and Gentlemen, fans of the great S.C. Corinthians, I stand before you today not just as a supporter but as a herald of an exciting evolution in the world of sports and fandom - the rise of fan tokens.
The introduction of the S.C. Corinthians Fan Token signifies more than just a digital asset; it represents a revolutionary bridge between a club and its devoted supporters. This token isn't just about ownership; it's about empowerment, engagement, and a new era of connectivity.
Imagine a future where your passion for Corinthians isn't just demonstrated through cheers and jerseys, but through an active participation in club decisions, exclusive fan experiences, and a genuine voice in the club's direction. This is the promise that fan tokens like the one Corinthians offers hold.
Fan tokens are the epitome of the digital revolution meeting the fervor of sports culture. They provide a platform where fans aren't just spectators but active stakeholders in the success and growth of their beloved club. With this token, you hold a part of Corinthians in your digital wallet, but more significantly, Corinthians holds a part of your unwavering support and loyalty.
But let's talk about the future, the horizon of fan tokens. It's not just about holding a token; it's about the potential it carries. We're at the cusp of a paradigm shift where fan engagement transcends the boundaries of stadiums and physical presence. Soon, we'll witness unprecedented access to exclusive content, voting rights on club decisions, VIP experiences, and even the potential for token holders to shape the team's future by expressing their opinions directly through these tokens.
The future of fan tokens isn't confined to a screen or a digital wallet. It's about creating a vibrant community, a global network of Corinthians supporters, united by a digital thread. It's about democratizing the fan experience, where every voice counts, every opinion matters, and every token holder becomes an integral part of the Corinthians family.
So, fellow Corinthians faithful, embrace this new era. Let's not just witness history; let's be a part of shaping it. The S.C. Corinthians Fan Token isn't just a digital asset; it's a symbol of our unity, passion, and dedication. Together, let's paint a future where our love for the club isn't just celebrated but actively influences its journey. Vai Corinthians!
Market

XAUUSD 1dHello, everyone! Weekly review of the gold-dollar pair from higher timeframe to lower:
1D - Daily timeframe, we are in a short context after updating the historical maximum. After that, we confirmed the short context. At the moment, we have an interesting situation as there is a raid against a raid in still a short context. In such moments, I prefer to gather more information before making a decision.

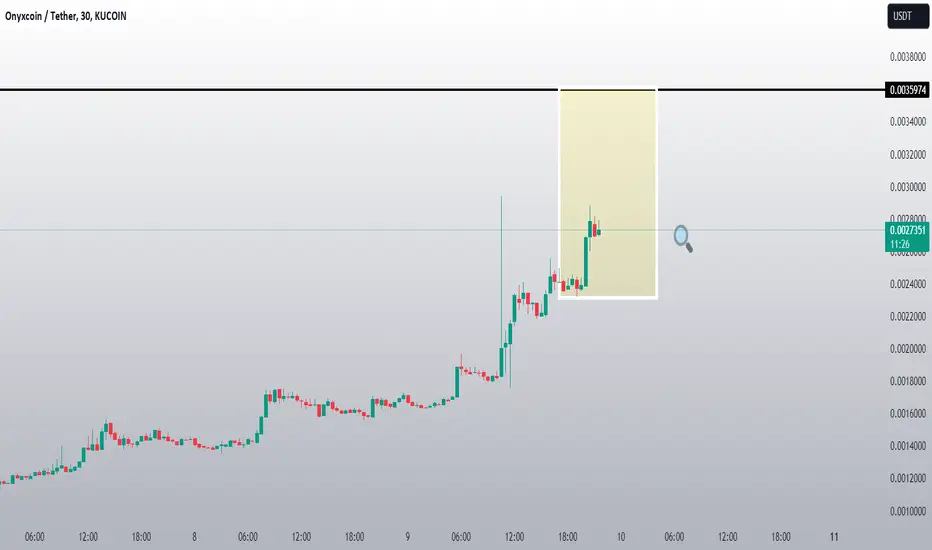
XCN NEW VOLUME STARTThank you for reading this update.
Depending on our study we see that XCN has a good chance of volume increase.
This updates depending on day trade, And the market should confirm with time the right market way.
#Nottradingadvice
#For day traders take always profits when market increase
#Expect noting from the markets, but follow what it shows.
BTC - Market Structure 101 📚 Keeping It SimpleHello TradingView Family / Fellow Traders,
📊 I find the BTC H1 chart interesting as it has been respecting the market structure cleanly inside the rising channel recently.
📈 As the price approaches the lower bound of the channel, the bulls are taking control for an impulse after breaking above the last high in blue and the 21 EMA.
📉 Conversely , as the price nears the upper bound of the channel, the bears take charge for a correction after breaking below the last low in green and the 21 EMA.
Today, BTC rejected the upper bound and broke below the green low and 21 EMA, signaling that the bears are currently in control.
📉 The bears are expected to maintain control, and we anticipate a movement towards the lower bound of the channel.
📈 However , a shift in momentum could occur if the bulls regain control by breaking above the red channel and reaching 38,100. In such a scenario, we would anticipate a bullish continuation towards the upper bound of the rising channel.
What are your thoughts? Do you believe BTC will continue to adhere to this simple market structure?
📚 Always follow your trading plan regarding entry, risk management, and trade management.
Good luck!
All Strategies Are Good; If Managed Properly!
~Richard Nasr

USDJPY - NovemBEARS MARKETFor the current week, the USD/JPY pair has shown a decline, closing Monday's session at 148.675. Investors are speculating on a possible shift in the Bank of Japan's policy away from negative interest rates, which could support a move of the pair towards 145. Consumer confidence in the U.S. and comments from FOMC members are also key factors that could influence the trajectory of USD/JPY.
The focus is on the future direction of the Bank of Japan following higher-than-expected inflation data, with anticipation of further guidance on when this policy shift might occur. On the other hand, in the U.S., a significant drop in consumer confidence could affect spending and thus demand-driven inflation, which would influence the Fed's interest rate outlook. Investors will be attentive to comments from voting FOMC members on inflation and interest rates.
In summary, the market anticipates a possible change in the Bank of Japan's monetary policy and is closely monitoring U.S. consumer confidence indicators and comments from FOMC members, all of which could significantly influence the behavior of the USD/JPY pair in the coming days.
Look my ideas chart
drive.google.com


bitcoin ! go on body :)Well, just as the whole market is involved in what exactly might happen, my personal opinion is on the fall of Bitcoin! Yes ! Bitcoin must experience its fall! The lowest amount that can experience the drop is 24500! But in general, I expect to see the range of 19,500 to 18,200.

BTC DominanceExecuse me!
Bitcoin dominance is on an upward trend,
which suggests that we can enter soon
to the bull market. This process is slow and will not happen now,
but it is worth looking at when the dominance was
Above 50%.
R3ncso

Dmart - hold the position and will move once it crosses the 3950DMart > 3950.
Currently hold the position between 3300 to 3950

History is Repeating Itself, Just FasterA little brief before I start into this. I got started investing prior to the 1987 stock market crash and have always been amazed at the stock market for what it can do in a short period of time. People experience the market in so many different ways and I was fascinated by the mass-hysteria, psychology, economics and politics that surrounded the entire 1987 crash. I will say that since I experienced the crash of 1987 and there has still been nothing like it since. The flash crashes, the GFC and many other "sharp drops" are nothing like the speed and power and dislocation of the 1987 crash. So, with that in mind, here is a pattern to compare the 2020 crash with the 1987 crash in context to the massive upwave from 1974-2000 and 2007.
So, to begin, the 1987 crash lines up with the 2020 crash when you use the 1974 low as a comparison to the 2009 low. Then, as life has it, things happen a little faster so this pattern speeds up a little. You can copy it yourself, just then line up the 1987 crash to the 2020 crash.
And here we are, right on track. Post-1987 crash the world was a very scary place in so many ways. It was actually quite scary. The banking system was falling apart because of the 1986 tax law change which bankrupted the S&L's to the biggest bailout in US history.
George Bush Sr, was president and he was very similar to Biden, making mistakes domestically and internationally. He started up the Drug War which destroyed civil liberties in so many ways, much like the draconian lockdowns for Covid.
I did put this long term forecast on long term charts years back here at TradingView so you can review those. This would have been good to have right in front of us before. I missed that chance.
Reagan had one good term before he had trouble with Iran-Contra funding by selling drugs to finance wars in foreign countries. 1985-1987 was a bad time with trade frictions with Germany and Japan due to a strong dollar and major tax law changes which destroyed real estate, much like 2007 led to the 2009 GFC.
Then we had Bush follow Reagan and he wasn't effective as a leader. His famous "Read my lips, no new taxes" happened right before he raised taxes
Sadly, we then had Clinton come in and take over for 8 years and his first attack was on health care, which ended badly but moved him to be more centrist. Al Gore as VP helped to foster internet growth with tax advantages and boom, we had the technology boom leading into the bubble of 2000.
So, the future should write itself from here. Let's look ahead to 1992-2000 ahead with 1993-1994 being a sideways grind with a giant short squeeze in T-Bonds bankrupting Orange County and knocking Long Term Capital Mgmt (hedge fund) to its knees.
More correlations to follow and hopefully we have a new technology like the internet was at that time, to drive accelerating growth. It could be the electrification of vehicles and transportation for its massively more efficient energy consumption. Time will tell!
Enjoy.
Tim
November 8, 2023 11:17AM EST

Selling Signal: GOLD Retesting Key Support AreaDiscover an enticing selling opportunity in GOLD as it undergoes a critical retest of a key support area. With market analysis, technical indicators, and price action as your allies, evaluate the potential downside move. Stay vigilant and informed to capitalize on this precious metal's market dynamics.

QQQ NEW LOWS INCOMING!Hello, fellow traders and investors! There has recently been a leg up in our bearish channel creating what we anticipate to be a lower high. There is plenty of uncertainty in the economy at the moment whether it be the wars in Russia/Ukraine or Israel/Palestine, upcoming interest rate decisions, the fed's approach to their balance sheet and applying quantitative tightening, etc...
All that to say Rise Capital believes we are at overbought levels and are actively pursuing strategies to take advantage of the bearish movement that is soon to come. We will be taking different approaches like shorting qqq, getting put contracts on qqq and buying shares of sqqq.
SHORT QQQ
Entry: 367.71
Take Profit: 342.20 (Partial profits can be taking off depending on price action)
Stop loss: 373.75
Risk/Reward: 4.3

ETH - One More CheckPoint 📍Hello TradingView Family / Fellow Traders. This is Richard, also known as theSignalyst.
📈 As per our last analysis (attached on the chart), ETH rejected the 1550.0 support and traded higher.
Currently, ETH is sitting around a strong supply marked in orange.
📈 For the bulls to remain in control, we need a break above 1885.0
📉 Meanwhile, if the gray zone 1738.0 is broken downward, expect the bearish impulse to start.
📚 Always follow your trading plan regarding entry, risk management, and trade management.
Good luck!
All Strategies Are Good; If Managed Properly!
~Rich

I think from now Indian market is going to 🚀 shoot up The Indian market is showing signs of a strong recovery after a period of volatility and uncertainty. This is just my analysis its not any type of call

intel - analysis - inside 💻Hello TradingView Family / Fellow Traders. This is Richard, also known as theSignalyst.
📉 INTC has been overall bullish trading inside the rising wedge pattern in blue and it is currently approaching the lower bound / blue trendline.
Moreover, the 31-32 is a strong support zone.
🏹 So the highlighted red circle is a strong area to look for buy setups as it is the intersection of the green support and lower blue trendline acting as a non-horizontal support.
📚 As per my trading style:
As INTC approaches the lower purple circle zone, I will be looking for bullish reversal setups (like a double bottom pattern, trendline break , and so on...)
📚 Always follow your trading plan regarding entry, risk management, and trade management.
Good luck!
All Strategies Are Good; If Managed Properly!
~Rich

Nasdaq STOCK MARKET BIG CRASH MMXM THEN RISENasdaq Daily Market Maker Sell Model until summer next year probably by taking consideration Market Maker X Model, then Smart Money Reversal and Bull Market.. REMEMBER EVERYTHING IS FRACTAL, ALL MODELS WORK ON ALL TIMEFRAMES

Q3 Sell Off Bias Breakdown Part 1Hello, in this analysis, I saw the potential for this sell-off around August 8th. I just never posted it, but I was chatting with AI to see how many months, days, weeks, or years equaled how many candles. So, I picked the 91-day timeframe because I will normally be on the right side of the trend most of the time, as that is higher than the monthly, weekly, daily, etc. in terms of higher timeframe bias.
PART 2:

US500 - Detailed Video Analysis 📹 From Weekly To H4Hello TradingView Family / Fellow Traders. This is Richard, also known as theSignalyst.
📈 Here is a detailed update top-down analysis for #US500.
Which scenario do you think is more likely to happen? and Why?
📚 Always follow your trading plan regarding entry, risk management, and trade management.
Good Luck!.
All Strategies Are Good; If Managed Properly!
~Rich

Crypto Bear Market Bottom Breakout ConfirmedThe total stablecoin market downtrend parabola was broken this week and backtested yesterday and wicked up to form a bullish retest candle.
Crypto bear market bottom is in. Expecting bitcoin to likely lead the charge as usual until we peak out on the BTC.D dominance chart pennant pattern, then alts run.
In meantime gobbling up all my fav alts while they bottom pattern here.

USDT.D (Full Chart Analysis-Long-Term)Hello Friends.
How are you? Hope you always be happy and successful
Today I want to talk about USDT.D
in another words, I want to talk about the dominance of Tether.
the situation is complicated.
I want to check this item based on Ichimoku, channel line, and classic pattern. so, let's go into details.
based on Ichimoku, the future cloud is getting green(positive)
Tenkensen is above Kijunsen and it's a sign to prove us the chart is bullish.
based on the Classic pattern, we have an Ascending Triangle. As you know it's a continuation pattern. and I expect this trend to continue.
if dominance succeeds in breaking 8.21% and then 8.51%, the next target will be 9.45%.
that's a border of a huge dropping in altcoins.
if dominance is able to stabilize above 9.45%, everything will be changed and the main target of this movement will be 15%
it means that you will see a lower low in all markets.
And you should expect it to drop more than you think.
it's my favorite theory. I think it will happen soon.
let me check based on the channel line in the weekly time frame.
As you can see, we are moving in an ascending channel.
we had three hits at the top of the channel and four hits at the bottom of the channel.
it means that this channel is validated.
at this time we are moving around the midline. This move to the top of the channel is expected to be around 15%.
If these three conditions occur, everything will be changed. and you can buy for example Bitcoin for around 9800-11500 USD for the first level. and maybe cheaper.
sounds great.
who doesn't like it?
🙏🙏 Please don’t forget to like 👍, follow ✌️, and share 👌 this analysis with your friends. Thank you so much for your attention and participation 🙏🙏
Sincerely Yours
Ho3ein.mnD

Stock Market Crash PredictionBased on how Bond yields are starting to rise tonight and how the US dollar is going to explode sharply higher without much resistance to the left of the chart, I predict that prices over the next 3 days will collapse all the way down to the demand zone.
There was a guy on youtube explaining how the global financial system works and that China and Europe will be forced to sell Treasuries adding more pressure to bonds and finally causing the stock market to play catch up to bond prices.
If bonds is paying 5 or 6%, it doesn't make sense to risk money on equities if it only returns 7 or 8%. The 1 or 2% delta is not worth the risk, so prices have to reset to reflect this new reality.
Plus October is the month for crashes so this alone could be a self full filling prophecy.
On Thursday and Friday, prices dropped on increasing volume and today it rose on very low volume. Smart money let it rise to see how much demand there is before coming in with aggressive sell orders to drive prices down. If there is no demand at this level, it will take less money to make prices move down.

Neutral on SPY.
As you can see here on the hourly timeframe we have formed some trend lines. I feel like we will open up tomorrow red and then if we can close above the top trend line above vwap and with good volume on the 5 minute chart I feel as though we can get a nice pop. Be careful tomorrow is a FED meeting!

Be ReadyWe cannot trust the last 2 green candles, strong resistance around 33820 area. This upside movementum is just a correction of the drop that we saw from 35560 area. Good chances that tomorrow it will open with gap down and continue to slide down. Of if it opens with a positive sentiments that it will again hit the road block at 33820 zone. For now the index is not in bulls territory dont be fooled by green days its just dead cat bounce.
Next week more news is coming out from the fed so fasten your seat belts for some action.
Hit like & follow guys ;)
