AUDUSD, Pullback Off Resistance, Likely Continuation Ahead!Hello,
Welcome to this analysis about AUDUSD and the 12-hour timeframe perspectives. In recent times AUDUSD showed up with crucial bearish encounters as it pulled back from this main descending-resistance-line in red and increased with bearish volatility after it. Besides, that as I detected now AUDUSD in this whole structure here is now forming this massive bear-flag-formation in which it has the resistance-cluster within and the coherent wave-count in the formation is almost completed. In the near future now as AUDUSD pulled back bearishly from the upper resistance-cluster it is likely that a bearish continuation will follow up in which AUDUSD approaches the lower-boundary of the ascending-channel and when this zone does not hold with AUDUSD closing below the lower boundary this will be the completion of the channel as a bear-flag and AUDUSD will move on with further bearish continuations to approach the initial bear-flag-target-zone marked in blue in my chart, once this zone has been reached it has to be elevated if AUDUSD manages to hold this zone and back-up or it just sets up for further movements to the downside, it will be an interesting journey ahead.
In this manner, thank you for watching the analysis, it will be great when you support it with a like, follow and comment for more upcoming market analysis, all the best!
"Trading effectively is about assessing possibilities, not certainties."
Information provided is only educational and should not be used to take action in the markets.
Market

EURUSD, Ascending-Channel, High-Likelihood Bear-Flag!!Hello,
Welcome to this analysis about EURUSD and the 4-hour timeframe perspectives. The global determinations for EURUSD have already shown a mainly bearish development and now when looking at the more local frames as the 4-hour chart I discovered a decisive formation forming that should not be kept from the desk here. Therefore, when looking at my chart we can watch there how EURUSD is now about to form this major ascending-channel that is likely to complete as a bear-flag especially as the rejection from this main descending-resistance-line was the precarious origin of this bearish move to the downside which has now a high likelihood to continue. In this case, when EURUSD closes below the lower boundary of the bear-flag this will be the origin for the further continuations and EURUSD will move on to approach the lower zones especially the lower target-zone within the 1.145 level marked in blue. Once this zone has been reached it has to be elevated how EURUSD approaches into there and if there comes a possible reversal or EURUSD just sets up for the further bearish continuations. As there are some good supports given a reversal in the structure can be considered.
In this manner, thank you for watching the analysis, it will be great when you support it with a like, follow and comment for more upcoming market analysis, all the best!
"There are many roads to prosperity, but one must be taken."
Information provided is only educational and should not be used to take action in the markets.

EURGBP, Bear-Flag In Structure, Objections Ahead!Hello,
Welcome to this analysis about EURGBP and the daily timeframe perspectives. In recent times EURGBP has developed a main bearish structure and as I discovered now there is a decisive formation in this structure which when completed will be the origin of heavy bearish continuations. Therefore, as when looking at my chart we can watch there how EURGBP has formed this main bear-flag-formation marked with the boundaries in blue, in this formation EURGBP already completed the wave-count reaching from A to C. Now as this wave-count completed it is also contributing to the more global ABC-impulse-wave-count to the downside and the wave B within this wave-count, therefore, when EURGBP closes below the lower boundary of this bear-flag this will be the activation of continuations and downside-targets marked in my chart in the 0.8225 Usd level in blue, when these targets are reached the situation needs to be elevated anew and EURGBP needs to show how it develops from there on, if there comes a potential reversal or it is just a setup for further bearish downside continuations, it will be an interesting journey.
In this manner, thank you for watching the analysis, it will be great when you support it with a like, follow and comment for more upcoming market analysis, all the best!
"The high destiny of the market is to explicate, rather than to speculate."
Information provided is only educational and should not be used to take action in the markets.

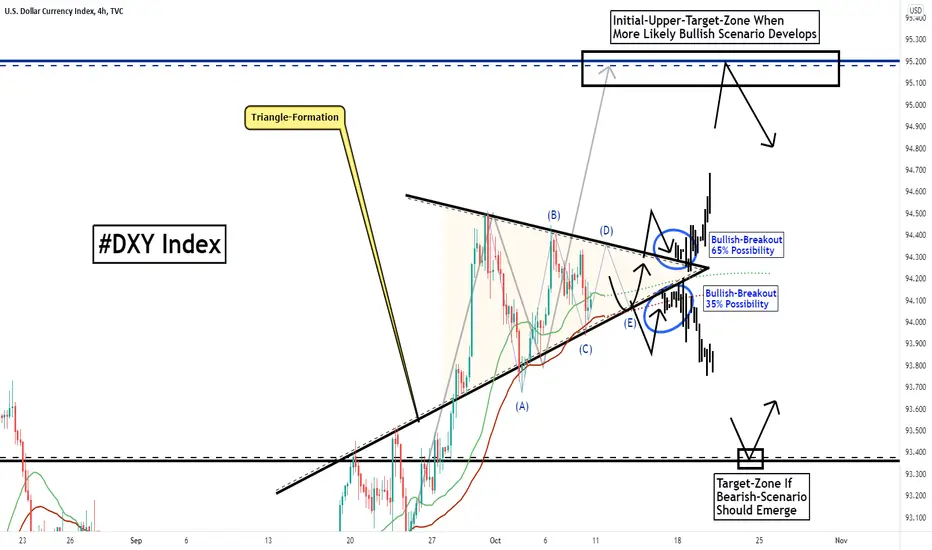
DXY Index, Triangle-Formation, Bullish Breakout More Likely!Hello,
Welcome to this analysis about the DXY US-Dollar Currency Index and the 4-hour timeframe perspectives. The index on the more global terms in recent times initially increased with bullishness and is now forming an important formation as I discovered. When looking at my chart we can watch there how the Index is forming this main symmetrical-triangle-formation marked with the boundaries in black. In this formation the index has a coherent wave-count with the waves A to C already completed and now setting up to form the wave D on which the wave E follows that completes the whole wave-count and therefore also the triangle-formation in the best-case-scenario. As for now the index is staying above the 45-EMA in red and is building up above it with the wave-count and simultan triangle a bullish breakout to the upside currently has a higher possibility by 65% than the bearish breakout. Nevertheless, it is important to wait for the final confirmation which will happen once the Index formed the breakout above either boundary. When the more likely bullish scenario settles it will activate the 95.2 level as a target-zone, once this is reached the situation needs to be elevated anew, it will be an interesting development ahead.
In this manner, thank you for watching the analysis, it will be great when you support it with a like, follow and comment for more upcoming market analysis, all the best!
"Trading effectively is about assessing possibilities, not certainties."
Information provided is only educational and should not be used to take action in the markets.
USDJPY, Develops Triangle-Formation, Incoming Breakout-Targets!Hello,
Welcome to this analysis about USDJPY and the 4-hour timeframe perspectives. As when looking at my chart we can watch there how USDJPY is now forming this main triangle-formation above the 45-EMA in red and the 25-EMA in green. The triangle that USDJPY is forming is also simultaneously the wave B in this major wave-count to the upside, in the wave-count USDJPY has already completed the wave A and when this main triangle-formation finally validates in the structure this will be the origin of the wave-C to the upside and USDJPY will move on to approach the upper target-levels and increase bullish volatility to the upside. When the breakout of the triangle happens properly as expected this will be a high likelihood indication for further bullish developments otherwise when this does not happen and USDJPY increases with strong bearishness again this can also invalidate the whole triangle-formation therefore it will be necessary to elevate how this triangle finally completes before coming to further conclusions.
In this manner, thank you for watching the analysis, it will be great when you support it with a like, follow and comment for more upcoming market analysis, all the best!
"There are many roads to prosperity, but one must be taken."
Information provided is only educational and should not be used to take action in the markets.

EURGBP, Ascending-Wedge, Bearish Breakout Imminent!Hello,
Welcome to this analysis about EURGBP and the 4-hour timeframe perspectives. EURGBP in recent times is forming some interesting developments especially with the main formation I discovered here this can lead to increased volatility in the upcoming times. Therefore, when looking at my chart we can watch there how EURGBP has formed this massive ascending-wedge-formation, such a formation is normally known to show up with a bearish reversal to the downside. Because EURGBP already completed the ABC-wave-count within the formation a completion of the whole formation bearishly to the downside gets more likely or also EURGBP will firstly continue in the ascending-wedge with the wave-count and the development of a wave D as well as a wave E in the structure which will not be bad because this will just increase the potential for an increased bearish breakout to the downside that accelerates further. In all these cases the crucial confirmation will happen when EURGBP finally breaks out below the lower boundary of this whole formation, this will complete the formation and will be the origin for the bearish continuations. In this case, EURGBP will also activate the target-zone marked in blue within the 0.8444 level, when this zone has been reached the situation needs to be elevated anew and EURGBP has to show how it continues there, if the bearishness is heavily increased this can also just lead to a bearish continuation-setup once the zone has been reached.
In this manner, thank you for watching the analysis, it will be great when you support it with a like, follow and comment for more upcoming market analysis, all the best!
"The high destiny of the market is to explicate, rather than to speculate."
Information provided is only educational and should not be used to take action in the markets.

EURUSD, H-S-Formation Completed, Increased Drop Incoming!Hello,
Welcome to this analysis about EURUSD and the 2-day timeframe perspectives. EURUSD in recent times as I discovered has formed a massive formation that is indicating bearish dynamic volatility developments to emerge within the upcoming times. In this case, we should consider that the formation here is mainly completed and that a high possibility is given for the continuations to accelerate within the near future. Therefore, as when looking at my chart we can watch there how EURUSD has formed this massive paramount head-and-shoulder-formation with all the elements already completed reaching from the left shoulder to the head till the right shoulder. The fact that EURUSD now formed the pullback below the neckline was the first technical confirmation and now EURUSD has formed this major bear-flag-formation below the neckline which is marking the appropriate confirmation-formation of this whole pattern. Therefore as EURUSD now also already penetrates the lower boundary matching with the 200-EMA we should expect the bearish breakout to happen within the next times, when this happens and EURUSD marks below the lower boundary of the flag it will be the source of bearish pressure continuations and EURUSD will move on to the initial target-zone marked in my chart in blue at the 1.135 level, it has to be shown then how EURUSD reacts into this zone because when the bearish pressure increases exorbitantly this will be the origin for the further bearish continuations which will develop in the bearish-continuation-zone marked in red in my chart.
In this manner, thank you for watching the analysis, it will be great when you support it with a like, follow and comment for more upcoming market analysis, all the best!
Information provided is only educational and should not be used to take action in the markets.

GBPUSD, Completed Bear-Flag, Continuations!Hello,
Welcome to this analysis about GBPUSD and the 4-hour timeframe perspective. GBPUSD in recent times has shown up with important determinations that defined the whole structure as I discovered here. Therefore, as when looking at my chart we can watch there how GBPUSD completed this main ascending-channel-formation as a bear-flag bearishly to the downside after completing the ABC-wave-count within the bear-flag. Now as GBPUSD is also below the 300-EMA marked in red here this is a sign of bearish continuation for GBPUSD and it is likely to continue bearishly as it is shown in my chart till the lower levels have been reached marked in my chart in the dynamic target-zone in blue from where GBPUSD needs to show how it continues from there on and if there comes a potential stabilization or the next bearish setup. There is good potential given that GBPUSD stabilizes in this zone as there are also some great supports within there, it will be an interesting development.
In this manner, thank you for watching the analysis, it will be great when you support it with a like, follow and comment for more upcoming market analysis, all the best!
Information provided is only educational and should not be used to take action in the markets.

CHFGBP, Developments In Ascending-Wedge, Bounce And Pullback!Hello,
Welcome to this analysis about CHFGBP and its 12-hour timeframe perspectives. CHFGBP in the recent times established important structures and recently formed a interesting bounce in its structure, besides that I discovered further determinations that are worthwhile to look at. As when looking at my chart now we can watch there how CHFGBP emerged with this main ascending-wedge-formation marked with the boundaries in blue. Within this wedge-formation CHFGBP has the coherent wave-count and the waves A to C already completed, with the wave D now developing CHFGBP is approaching this dedicated support-base marked in orange in my chart, because of the several supports within this region also determined by the point-of-control of the volume-profile marked with the red line this is a zone where a bounce has a high possibility and should be expected. Once this bounce emerged CHFGBP will move on with the development of the wave E to approach the upper resistance level to finalize the whole wave-count and pullback from there, when this happen it can be the appropriate setup of the ascending-wedge-completion which will happen when CHFGBP finally bounces below the lower boundary.
In this manner, thank you for watching the analysis, it will be great when you support it with a like, follow and comment for more upcoming market analysis, all the best!
Information provided is only educational and should not be used to take action in the markets.

JPYCAD, Inverse Head-Shoulder, Targets Ahead!Hello,
Welcome to this analysis about JPYCAD and the 4-hour timeframe perspectives. As I discovered in my analysis recently JPYCAD has formed an interesting dynamic and recently completed a pivotal formation with further volatilities to show up likely. Therefore, as when looking at my chart we can watch there how JPYCAD now recently completed this whole inverse head-and-shoulder-formation with the bounce above the neckline which is marked in blue. Above this neckline JPYCAD now forms something like a confirmational bull-flag which has a coherent wave-count within that will be completed when wave C is finalized. Once JPYCAD bounces above the upper boundary of this confirmation flag it will move on further to the upside and approach the main inverse head-and-shoulder-target-zone marked in my chart in blue. For now, this zone is likely to be reached as JPYCAD offers the appropriate structure for it as it is also staying above the 35-EMA in red as well as the 15-EMA in green. Once the upper target-zone has been reached JPYCAD needs to show if it manages to increase further bullishness above this level or firstly reverses which will not be unlikely, it will be an important development ahead.
In this manner, thank you for watching the analysis, it will be great when you support it with a like, follow and comment for more upcoming market analysis, all the best!
"Good luck is when opportunity meets preparation."
Information provided is only educational and should not be used to take action in the markets.

USDCAD, Bull-Flag-Breakout Likely To Establish!Hello,
Welcome to this analysis about USDCAD and the 4-hour timeframe perspectives. USDCAD in recent times as I discovered is forming an interesting formation that can be the appropriate origin for upcoming volatilities to the upside. Therefore, as when looking at my chart now we can watch there how USDCAD has formed this main bull-flag-formation above the ascending-trend-line, within this formation USDCAD has the coherent wave-count with the waves A to C almost already completed and now with the breakout pending. When this breakout finally shows up above the upper-boundary of the bull-flag this will be the right setup to complete this whole bull-flag and to setup bullish continuations which will point to the 1.285 target zone, currently, this is likely to happen and should be expected. It will be important how USDCAD develops further after the targets have been reached if there develops a continuation or USDCAD firstly pulls back to retest lower levels, in any case, this needs to be shown.
In this manner, thank you for watching the analysis, it will be great when you support it with a like, follow and comment for more upcoming market analysis, all the best!
Information provided is only educational and should not be used to take action in the markets.

USDCHF, Ascending-Channel-Development, Local-Triangle-Breakout!Hello,
Welcome to this analysis about USDCHF and the 4-hour timeframe perspectives. As I discovered USDCHF in recent times is forming some interesting developments that can be the origin of upcoming volatilities to consider. As when looking at my chart now we can watch there how USDCHF has developed this major ascending-channel-formation marked with the boundaries in black, within this channel-formation USDCHF has the coherent wave-count with the waves A and B almost already completed, with the emerging of wave C USDCHF has built this local triangle-formation marked in orange. As USDCHF recently formed the breakout above the upper-boundary of this formation this gave the incentive for further continuations to the upside and the main wave-C-development to approach the upper dynamic target-zone marked in blue in my chart, once this zone has been reached the situation needs to be elevated anew and USDCHF needs to show if it manages to continue bullishly in these areas or firstly forms a reversal which will not be unlikely, it will be an interesting development ahead.
In this manner, thank you for watching the analysis, it will be great when you support it with a like, follow and comment for more upcoming market analysis, all the best!
Information provided is only educational and should not be used to take action in the markets.

GBPUSD, Bearish Impulse-Wave As Resistance Approached!Hello,
Welcome to this analysis about GBPUSD, we are looking at the 12-hour timeframe perspectives, the recent events, the established formational structure, and what we should expect in the upcoming times. As when looking at my chart now we can watch there how GBPUSD has established this bearish wave-count to the downside within which it already completed wave A completely and is now about to form the wave B in the structure that is directly moving into the main resistance-cluster marked in red in my chart where several resistances coming together with such as the descending-resistance-line marked in red, the 200-EMA in red, the 100-EMA in green and also the 38.2% Fibonacci-resistance from where a pullback to the downside is highly likely, this pullback will be the origin of the main wave-C and GBPUSD will move on to the downside within its wave-count. Besides, that GBPUSD formed this bearish EMA-death-crossover here already which is giving further increased indication for the bearish impulse to the downside scenario. Once this has been completed and GBPUSD reached the dynamic target- and recovery-zone there will be the possibility given for a substantial reversal once this is done GBPUSD will even have the ability to set up an upside-breakout above the descending-trend-line.
In this manner, thank you for watching the analysis, it will be great when you support it with a like, follow and comment for more upcoming market analysis, all the best!
Information provided is only educational and should not be used to take action in the markets.

EURCAD, Bear-Flag-Formation, Likely Completion Incoming!Hello,
Welcome to this analysis about EURCAD, we are looking at the 2-hour timeframe perspectives. EURCAD in the recent times has shown up with important developments in the structure that indicate potential bearish continuations as I discovered. Therefore, as when looking at my chart now we can watch there how EURCAD emerged with this main wave-count to the downside and within this wave-count is now about to form the wave B in the structure with the bear-flag-formation developing, in this bear-flag-formation EURCAD has also the coherent wave-count from A to C with the waves A and B completed and as EURCAD now approached the resistance-cluster marked in red in my chart this will be a level where the wave-C is likely to finalize and therefore also the whole wave-count, when this happens and EURCAD pulls back in this region a continuation to the downside will follow up till the whole bear-flag has been completed which will happen with EURCAD closing below the lower-boundary of the bear-flag and continuing bearishly. Such a price-action will activate the bear-flag-target-zone marked in blue in my chart and when this zone has been reached it has to be elevated anew if EURCAD can hold this zone or just sets up for further bearish continuations to the downside, it will be an interesting development ahead.
In this manner, thank you for watching my analysis about EURCAD and its main bear-flag-formation structure to consider with the upcoming completions and continuations ahead of the next times, support the analysis with a like and follow or comment for more market insight!
"Trading effectively is about assessing possibilities, not certainties."
Information provided is only educational and should not be used to take action in the market.

CHFGBP, Completes Head-Shoulder-Formation, Targets Activated!Hello,
Welcome to this analysis about CHFGBP, we are looking at the 4-hour timeframe perspectives. As I discovered recently CHFGBP has completed an important formation that is now building the origin for further volatilities to consider in the upcoming times. Therefore, as when looking at my chart we can watch there how CHFGBP completed this main head-and-shoulder-formation in orange with the bearish breakout below the neckline and moved on to test the 200-EMA in red together with the 100-EMA in grey which are close to a bearish crossover. Now within this structure below the neckline CHFGBP is forming this confirmational bear-flag-formation that can take the shape of a protracted bear-flag or also can form the direct breakout to the downside in either case it is building the high possibility setup for further continuations. Mainly the head-and-shoulder completion has activated the bearish target-zone within the 0.785 level marked in blue in my chart, once this zone has been reached the situation needs to be elevated anew and CHFGBP needs to show if it manages to reverse in this level or builds up a setup for further continuations to the downside.
In this manner, thank you for watching my analysis about CHFGBP and the main head-shoulder-formation with the upcoming determinations, support the analysis with a like and follow or comment for more market insight!
"The high destiny of the market is to explicate, rather than to speculate."
Information provided is only educational and should not be used to take action in the market.

GBPCAD, Short-Term Bullish, Long-Term Bear-Flag!Hello,
Welcome to this analysis about GBPCAD, we are looking at the 2-hour timeframe perspectives. GBPCAD is in a condition where it is showing different signs of developments and therefore has diverging perspectives in expectation. In this case, as when looking at my chart we can watch there how GBPCAD is within this main channel-formation with the coherent wave-count within this channel and the waves A and B already completed, now in the next times the wave C will emerge from here which will run directly into this main resistance-cluster where several resistances coming together and therefore has a high likelihood given to emerge with a bearish pullback to the downside which should be expected. Once this pullback has emerged GBPCAD when moving further with the bearish pressure will complete the whole formation as a bear-flag once a breakout to the downside has happened as it is shown in my chart, such a bearish breakout will activate further continuations to the downside and the two targets seen in my chart, when GBPCAD has reached these zones a reversal can be possible however mainly the bearish perspectives are pivotal and should be expected, it will be an important development ahead.
In this manner, thank you for watching my analysis about POLKADOT and the major ascending-channel-formation, support the analysis with a like and follow or comment for more market insight!
"The high destiny of the market is to explicate, rather than to speculate."
Information provided is only educational and should not be used to take action in the market.

GBPCHF, About To Complete Double-Top, Important Zones!Hello,
Welcome to this analysis about GBPCHF, we are looking at the hourly timeframe perspectives. GBPCHF completed an important formation and shows up with the decisive confirmational developments. As when looking at my chart we can watch there this formation is a double-top-formation with the left top and the right top almost finished, now GBPCHF bounced below the neckline which is already the first technical confirmation of the formation. Now it will be likely that GBPCHF continues with a bear-flag below the neckline or some other bearish confirmation-formation, therefore when GBPCHF increases with bearish pressure in the upcoming times this will be the origin for the further continuations to the downside and GBPCHF will reach the target-zone within the 1.25 level from where the situation needs to be elevated anew and GBPCHF needs to show if it manages to bounce in this zone or just sets up for further bearish pressure to the downside, for now, we should not keep the bearish perspective out of sight and expect the bear targets to be reached.
In this manner, thank you for watching my analysis about GBPCHF and the main double-top-formation with upcoming determinations to consider, support the analysis with a like and follow or comment for more market insight!
"There are many roads to prosperity, but one must be taken."
Information provided is only educational and should not be used to take action in the market.

EURGBP, Ascending-Channel-Structure, Breakout Incoming!Hello,
Welcome to this analysis about EURGBP, we are looking at the hourly timeframe perspectives. EURGBP in recent times developed a structure in which a considerable breakout has the ability to emerge when EURGBP determines the right price-actions. When looking at my chart now we can watch there how EURGBP is trading within this massive ascending-channel-formation with a coherent local wave-count within the formation and its waves A and B already completed, now within this wave-count EURGBP also forms this local bull-flag-formation marked in orange in my chart which is likely to be the appropriate origin for an upside-breakout, when this happens and EURGBP bounces above the upper boundary of the flag it will be the setup for the further continuations and EURGBP will approach the upper target zone within the upper boundary marked in blue which is the wave-C-extension target-zone. Once this zone has been reached the situation needs to be elevated anew. For now, we should expect the bullish breakout to emerge in the upcoming times as EURGBP also stays above the important EMA structure, it will be an interesting development.
In this manner, thank you for watching my analysis about EURGBP and the ascending-channel structure with the upcoming breakouts to consider, support the analysis with a like and follow or comment for more market insight!
"Good luck is when opportunity meets preparation."
Information provided is only educational and should not be used to take action in the market.

USDCHF, Descending-Channel, Bearish Continuation Ahead!Hello,
Welcome to this analysis about USDCHF, we are looking at the hourly timeframe perspectives. USDCHF is in a structure in which it has established some important determinations and as I discovered is likely to emerge with increased volatility within the next times once this determining formation has been completed. As when looking at my chart now we can watch there how USDCHF has formed this main descending-channel-formation with the boundaries marked in blue and the coherent wave-count to the downside established within the formation with the waves A and B already completed. Besides that USDCHF is forming this main resistance-triangle in the formation marked in red where several resistances coming together likely to be origin of the wave C to the downside which will fully contribute when USDCHF bounces below the ascending-trend-line marked in dashed grey in my chart, on this breakout below the support-reference-structure has happened USDCHF will continue bearishly to the downside and increased volatility will be likely. Once the target-zone of this wave-count has been reached which lies within the lower boundary as shown in my chart USDCHF has the ability to stabilize within there and bounce to the upside from there however this has to be shown. For now, we should keep prepared on the bearish movements, this whole dynamic can be traded either aggressively with immediate entry or conservative with entry after confirmation, although the immediate entry is also possible the conservative will be much better as it will appoint the final continuation-setup, traders need to decide according to own risk-preferences, it will be an interesting journey ahead.
In this manner, thank you for watching my analysis about USDCHF and its main descending-channel-formation-structure with the upcoming bearish downside incoming, support the analysis with a like and follow or comment for more market insight!
"Trading effectively is about assessing possibilities, not certainties."
Information provided is only educational and should not be used to take action in the market.

GBPNZD, Paramount H-S-Formation Completes, Perspectives Ahead!Hello,
Welcome to this analysis about GBPNZD, we are looking at the 4-hour timeframe perspectives. As I discovered GBPNZD is completing a major formation now that will show up further determinations when fully completed which is likely to emerge in the near future. As when looking at my chart we can watch there how GBPNZD has established this major head-and-shoulder-formation with the left shoulder, head as well as right shoulder already completed. Now as GBPNZD has settled below the neckline this is the technical confirmation and completion of the formation and is taking the form of a bear-flag pattern as it is marked in my chart. Once GBPNZD moves below the lower threshold of the bear-flag this will indicate further bearish continuations to the downside. Also what is likely to come up here when GBPNZD continues with the continuations is the death-cross in which the 65-EMA in black crosses below the 200-EMA in blue which will add to the bearish perspectives. The main targets for GBPNZD are within the 1.946 level marked in my chart in blue, once this level has been reached the situation needs to be elevated anew and GBPNZD needs to show if it manages to stabilize or sets up for further bearish continuations.
In this manner, thank you for watching my update-analysis about GBPNZD and the main head-and-shoulder-formation development, support the analysis with a like and follow or comment for more market insight!
Information provided is only educational and should not be used to take action in the market.

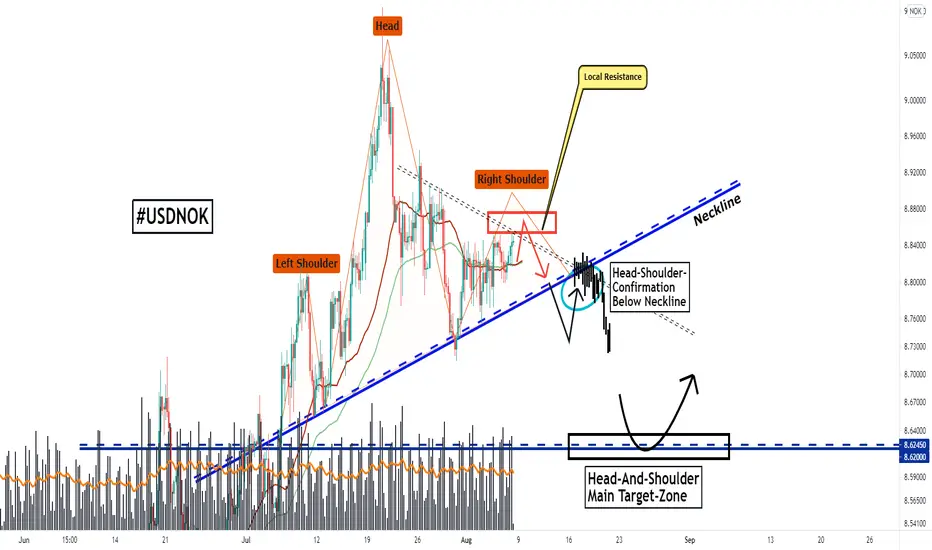
USDNOK, Major Head-Shoulder-Formation, Here Is How It Completes!Hello,
Welcome to this analysis about USDNOK and the 4-hour timeframe perspectives. In my recent analysis, I discovered some interesting signs forming in USDNOK which are important for the upcoming determinations. As when looking at my chart now we can watch there how USDNOK is about to complete this major head-and-shoulder-formation with the left shoulder and the head already completed and now USDNOK is about to continue with the right shoulder in the structure which will finalize likely as there is a main local resistance-zone marked in my chart in red from where USDNOK is likely to pullback and continue to complete the right shoulder in the schedule. Once USDNOK is below the 65-EMA in green and the 35-EMA in red the whole formation is likely to complete as the EMAs already formed a bearish crossover. Once USDNOK finally breaks out below the neckline as it is marked in my chart USDNOK will have finalized the whole formation and it will be the appropriate setup for the continuations to the downside as well as activation of the head-and-shoulder-target-zone marked in my chart in blue within the 8.62 Usd level. Once the target-zone has been reached the situation needs to be elevated anew and if USDNOK manages to firstly stabilize in the structure or sets up a further continuation to the downside, it will be an interesting and important development ahead.
In this manner, thank you for watching my update-analysis about USDNOK and the main head-and-shoulder-formation likely to complete and activate targets in the upcoming times, support the analysis with a like and follow or comment for more market insight!
"The high destiny of the market is to explicate, rather than to speculate."
Information provided is only educational and should not be used to take action in the market.
NZDJPY, Developments In The Channel, Initial Pullback Likely!Hello,
Welcome to this analysis about NZDJPY, we are looking at the 4-hour timeframe perspectives. NZDJPY in recent times is showing a structure with some interesting sights that I discovered. As when looking at my chart now we can watch there how NZDJPY is within this main ascending-channel-formation with the coherent wave-count in the formation and the waves A and B already fully completed. Now As Ethereum is about to finalize the wave C this is crucial because the wave C is directly running into the upper resistance-cluster marked in my chart in red where several resistances coming together consisting of the upper-boundary of the formation, the 400-EMA in red and also horizontal resistance within this zone. Taking these assumptions into the consideration it is likely that NZDJPY has its origin of the wave D to the downside within this resistance-cluster it is currently testing, this wave D will fully develop once NZDJPY is below the 200-EMA in green and once this happened NZDJPY will move on to test the lower boundary where the wave-E-confirmational-bounce-cluster is lying marked in my chart in blue, in this zone NZDJPY will have the ability to bounce and continue with the coherent wave E in the main wave-count to test the upper-boundary anew, it will be an interesting development ahead.
In this manner, thank you for watching my update-analysis about NZDJPY and the main structure ascending-channel and upcoming wave-count-developments to consider, support the analysis with a like and follow or comment for more market insight!
Information provided is only educational and should not be used to take action in the market.

SPX, Bull-Flag-Formation, Breakout Incoming!Hello,
Welcome to this analysis about SPX, we are looking at the 4-hour timeframe perspectives. The S&P 500 Index in recent times is forming some interesting structures that can convert into a great breakout with increased volatility as I detected. When looking at my chart now we can watch there how the Index marked above the paramount support level of 4375 marked in my chart in blue, also corresponding with this support level are the 25-EMA in red and the 15-EMA in green building a coherent and solid support base together with the horizontal support. Furthermore, the Index above this level here is building a great bull-flag-formation that is already in the last stages of completion as the wave-count within already finalized the waves A and B in the structure and now with the wave C bouncing in the lower boundary and the main support base it is the likely source of the completion of this whole formation. The bull-flag will finally confirm and activate targets once the Index is marked above the upper boundary, such a movement will indicate further continuations to the upside and activation of the target zone within the 4550 level marked in my chart in black. Once this level is reached it has to be elevated if the Index manages to continue further bullishly or firstly reverses to come up with a pullback which is also not unlikely in this case, it will be an interesting and important development ahead.
In this manner, thank you for watching my update-analysis about the S&P 500 Index and the main bull-flag-formation with the upcoming breakout to consider, support the analysis with a like and follow or comment for more market insight!
Information provided is only educational and should not be used to take action in the market.
