MSFT, Breakout Of The Flag, Targets Ahead After Confirmation!Hello, Traders Investors And Community, welcome to this update-analysis of the MSFT stock where we are looking at the recent events, the current price-structure and what we can expect the next times. As I already mentioned in past analysis MSFT was trading in a possible bull-flag formation which confirmed recently bullish to the upside, if you did not watch this analysis already I highly recommend it to you when going to my account and look at it to have a full-depth-overview. At the moment MSFT is trading at a preeminent level which is the all-time-high and MSFT provided other important technical signals which I detected therefore we are looking at the 4-hour local timeframe.
Initial Analysis According The Subject (4-Hour Timeframe):
As we can examine now when looking at my chart is that MSFT confirmed the bull-flag with solid bullish volatility to the upside where it is trading near the all-time-high which is currently still a decent resistance where we can get a pull-back to confirm the bull-flag a second time, this will be realized when we confirm the level at 190 as resistance and visit the upper boundary of the bull-flag to test it for a confirmation when this happens we need to hold the upper boundary and do not fall back into the channel again because this can possibly invalidate the bull-flag. Therefore it is important to hold the upper boundary and the EMA structure because when we close below these levels we will see increasing of bearish pressure within a high probable spectrum.
At the moment it is possible at hand that MSFT just runs away to make a new high but that will be an unhealthy movement which can turn out to be a bull-trap and confirm to the downside again, the best way will be that MSFT confirms the bull-flag properly a second time, when this happens it can be traded either with an aggressive entry immediately at the higher boundary or with a conservative entry when MSFT visits the highs again which will provide a breakout entry scenario. In both cases, it is wise to wait on the proper confirmation as there is still a possibility given that MSFT falls back into the channel and confirms bearish which is not high at the moment but it should be kept in mind to succeed in this situation with the proper risk-preference.
When we exemplify the fundamental side of things we can explore that MSFT is a decent winner in the current corona-crisis because we had a massive digitalization boom during the lockdowns which is still holding on because more and more people rely on digital economic and ecologic tools increasingly within this crisis. This digitalization boom can increase the next times or decrease as the real economy gets more important, to have a healthy market environment not only within MSFT but also within the rest market we need similar growth in the real economy and stock-market to confirm also fundamentally bullish, without that given we have a speculative rally which is an unhealthy market environment that can turn fastly to the downside, in this case, MSFT will be anticyclical to the rest of the market when it manages increasing growth in the fundamental and technical aspect otherwise it can add to the overall bearish shape we will get in the main rest of the market.
In this manner, thanks for watching, support for more market insight and all the best!
There is a kind of conformity to come in modern markets which is almost a paradise.
Information provided is only educational and should not be used to take action in the markets.
Market

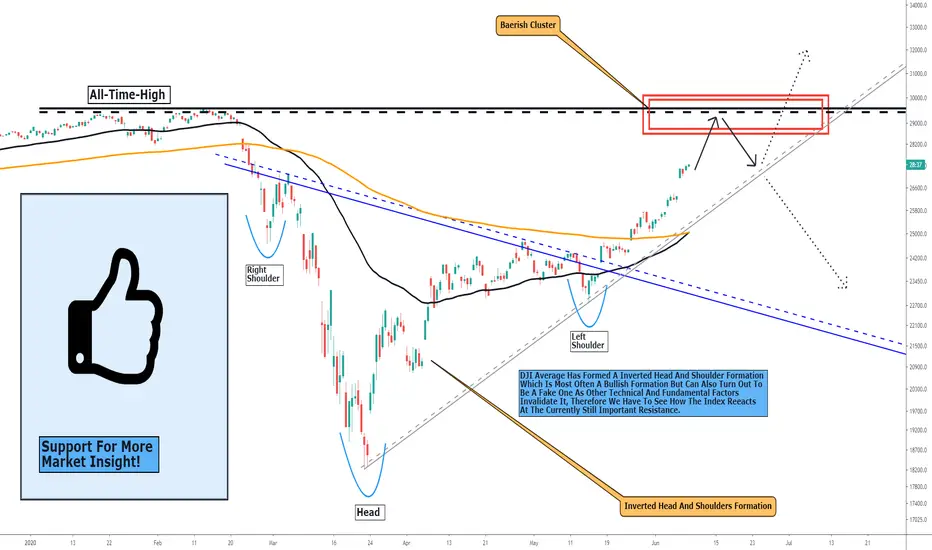
D-JONES, It Will Be An Huge Historical Test In Stock-History!Hello Traders Investors And Community, welcome to this analysis about the recent events, the current price-formation-structure and what we can expect the next times in one of the major leading stock-indices worldwide and one of the oldest participants in stock-markets the DOW JONES INDUSTRIAL AVERAGE, after we have seen the huge corona-crisis-breakdown which hit all global markets heavily we see a slowly moving uptrend right now, the big question which we have to ask our selves at the moment is if this uptrend is a stabile uptrend which will continue on a solid foundation or if it is just a huge bull-trap selling the shares to smart money on higher prices. As there are not only fundamental but also technical signals which I detected and which play an important role in the further outcome of the market we are looking at the 4-hour local timeframe.
When considering an index which builds the stock-market we have to also compare it with the current real economic situation and the things going on worldwide, and this situation is in fact a high volatile right now as the real economy is still damaged from the corona-crisis which has caused big failures due to lockdowns and the conservatism of the investors in this time. Also, we have massive protests going on worldwide which hasn't been seen since many 10th of years in that a mass-fashion. So taking all these factors together we can examine a divergence in the real economy and the stock market which shouldn't be the case because it is unnatural for the market and when it goes on for longer it has a big speculative impact on the market because the real economy isn't growing but the stock-market due to massive money printing from central banks, therefore, these two should build the same line together to provide a possibility for prosperity.
Technically speaking we see the index currently approaching a historical resistance level which is also the all-time-high-level you can see marked in my chart in red, when we approach this level firstly we can expect an pull-back because it is still a strong resistance level when this happened there are basically two possible scenarios which can play out within the index, once it is a second test of the resistance level where the price can succeed and make a new all-time-high to continue further and the second case will be that we break the current uptrend line you can see in my chart marked in grey to the downside which will cause bearish pressure and a test of the neckline of the inverted head and shoulder formation. When considering the bullish case it is important to keep in mind that the breakout needs to confirm with high volatility and sustainable price-action otherwise it can be a bull trap factly till the head and shoulders formation target confirmed.
It has to be noted that when we confirm a new high and advance further this will be a highly speculative rally as the real economy and the stock-market are still in divergence together firstly when these both run together we can get a healthy market environment. When considering the bearish side we can get bearish pressure after the uptrend line crossed to the downside, from that point it is possible for the index to test the neckline of the head and shoulder formation from where we can form a reversal and advance further but it can also turn out to come more bearish pressure to the downside which can invalidate the head and shoulder formation, therefore when we cross the 22690 mark to the downside this will get a definite bearish breakdown and need to be kept in the schedule for further considerations. At all the test of the resistance will be the critical factor in the further continuation of the index.
In this manner, thank you everybody for watching, support for more market insight and all the best!
There are many roads to prosperity in the modern economy, but one must be contemplated.
Information provided is only educational and should not be used to take action in the markets.
SPX500, Approaching Essential Level Which Will Show Conclusion! Hello, Traders Investors And Community, welcome to this analysis about the recent price-action, the current formation-mechanism and the outcome which we can expect the next times within the major leading stock-index S%P 500. At the moment the world is in a massive fluctuational volatile environment with heavy protests ongoing in several countries in the world which weren't seen so far since the 68th in the past century, in fact it is the first time in the 21th century that so many protests happening in that a variety of different countries. The whole corona-crisis and the resulting restrictions covering lockdowns and more were the triggers for that caos but what we see in the markets is an exceptionally unexpected uptrend even though the real economy is still damaged of the crisis we see a growth which firstly is the product of central banks and their money policy pumping fresh money into the markets but can this go forever in a damaged real economy or is it just a whole bull-trap? Therefore we are looking at the leading index within its 4-hour timeframe.
As you can examine in my chart with the blue lines the index is trading in a steady uptrend which has its origins after the lows of the corona-breakdown. After these lows, we first broke above the 40 and 100-EMA which you can see marked in orange and black in the chart from there on the index established the uptrend-channel with its currently speed-support-line meaning the trend is faster than before. When considering the bearish overall scenario which was established in the corona-breakdowns the current movement can be completely neutral and included within the bearish market environment but when considering the bullish scenario and a possibility to the upside which is definitely given at the moment after we saw these high volatile moves now we can examine that when SPX 500 takes out its highs substantially there can come even more growths and prosperity which is possible but it will be a high speculative rally to the upside driven from freshly printed money as the real economy is still in trouble this can increase the tensions and can possibly elude into an even bigger crisis in the aftermath.
The next weeks and months will be decisive not only for the stock-markets but also for the real economy and the ongoing protesters in the world, this paradox situation can lead to a stabilization when the majority of countries can establish its prosperity, growth and the status quo which was seen before the crisis, in this context the real economy will turn the lights on to the upside which will jump over on the stock market and this could result in a healthy bullish environment when the real economy and stocks going in one direction, on the other side ongoing discrepancies between the stocks and real economy will lead to an unhealthy environment which will increase the bearish pressure to the downside. Technically speaking we need to hold the current range between the 3150 and 3370 level and confirm it as support for setting up to test the all-time-high, otherwise when this does not happen and we fall below that level and cross the lower boundary of the channel down it will be bearish and a possible double top pattern can confirm.
It will be highly interesting how the market reacts to the possible scenarios given at hand, for traders this means both scenarios can be traded after confirmation, a long-trade can be entered when we stabilize in the uptrend channel and a short-trade when we cross the uptrend-channel to the downside. But be aware when we cross the all-time-high immediately to the upside without confirmed support before, this can just be a whole bull-trap which can elude the price back again. Overall when we cross the all-time-high to the upside and continue with an uptrend this will be a highly speculative rally because the real economy isn't that ready at the moment and as already mentioned these discrepancies can lead to an unhealthy market-environment. We will see how this plays out and it is important that we are ready to take the proper action in the upcoming market situations when they arising.
In this manner, thanks for watching, support for more market insight, all the best and have a good rest of weekend!
There are many roads to prosperity in the modern economy, but one must be contemplated.
Information provided is only educational and should not be used to take action in the markets.

EURAUD, Further Continuation Onward After Second Confirmation!Hello Traders Investors And Community, welcome to this analysis about recent events, the current price-structure and what we can anticipate from EURAUD the next times. In my research I discovered some fundamental important signs within EURAUD which will determine the outcomes of EURAUD further. As the world economy is slowly starting to grow again after the lockdowns this has an important impact on worldwide currencies and the forex-markets with high volatility which we currently experiencing, some people calling the euro should rotten and the states should keep their own currencies like before, if this is a good option we can not say at the moment but smart investors and traders should make their own personal standpoint in the markets and decide their market-approach on the best possible information at hand, therefore, we are looking at the 4-hour chart of EURAUD.
As you can see in my chart, EURAUD has broken a major declining trendline to the upside which is marked with the blue lines in my chart. So breakdown happened with high volatility and increased volume, therefore, the bearish scenario has confirmed firstly with this significant move to the downside. Currently, it seems that the price is stabilizing between the 1.065 and 1.635 range and forming some upmoves, but at the moment these upmoves are rather weak than really solid bullish moves and furthermore EURAUD is trading below meaningful resistance levels. First of all it is the the 60-EMA which you see marked in black and secondly, it is the 100-EMA marked in orange, together with the falling trendline these levels building a coherent resistance-cluster which will highly likely confirm bearish when touched in this level.
When the bearish resistance-cluster has confirmed as it is the highest possible scenario right now, the both targets you can see in my chart are activated. First of all when we reach the short-term-target and do not get any purposeful reversal here the further downside will be confirmed, after this, the middle-term-target is reached and when this has completed we need to examine the situation again and look for more signs within the information the market has gave us. This trade can be opened conservative or aggressive, the aggressive approach will be to enter the trade immediately in the current range and the conservative approach will be to wait after the falling blue trendline you can see in my chart has confirmed properly, traders should decide according to individual risk preferences and the market approach.
In this manner, thank you for watching, support for more market insight and have a good weekend.
Information provided is only educational and should not be used to take action in the markets.

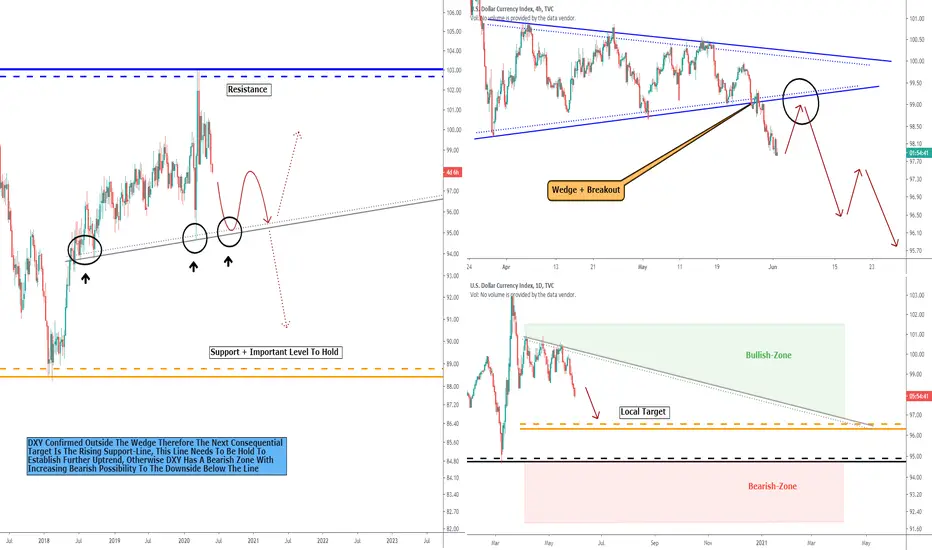
DXY, Wedge Confirmed, Once Targets Reached Further Resolution!Hello Traders Investors And Community, welcome to this analysis about the recent events happening in DXY, the current formation-structure and what we can expect from DXY the next days and weeks, there are some significant signals which I discovered and making it clearer in which direction we will trade with the overall index. As the world economy still struggling because of the corona-restrictions the virus has enabled we see meaningful levels of alternation not only in the stock-market but also in major leading currencies, as the corona-crisis established and increased we saw heavy volatility also in the DXY, for now, it seems to stabilize and consolidate but that can change in the next times when differences begin to increase between the currency-pairs, therefore we are looking at the weekly,daily and 4-hour perspective.
4-Hour Timeframe (Short-Term):
As you can see marked in blue in my chart DXY build a symmetrical wedge which recently confirmed with high volatility to the downside, for now we have the wedge target fully activated but there can also come a confirmation when the price comes back to the lower boundary as you can see in my chart before continuing to the downside, the leg to the downside can be traded aggressively with an immediate entry or conservative after confirmation. The best way in this structure is to wait after the DXY confirmed at the lower boundary of its wedge.
1-Day Timeframe (Middle-Term):
ON the daily timeframe we see some really really interesting and meaningful signs which can determine the further result of DXY, as you can see we have the local target at 96.5 which will be reached within the next time, from that point on we need to see and elevate how DXY can establish further, when we get stabilization in that level it is possible to build a reversal there and get back to previous bullishness otherwise when we fall below the target level and even lower DXY will end up in the bearish-zone you can see marked in my chart below the 94.8 level, on contrary for a bullish continuation we need to cross the falling grey trend line to the upside to end in the bullish-zone. These levels are highly important for the outcome and we need to watch out and be prepared when the time comes and either the bearish or bullish scenario plays out.
Weekly Timeframe (Long-Term):
Here we have the fundamental factors including the 4-hour and daily timeframe in the weekly timeframe which is building a huge constituitve range with a higher range boundary and coherent resistance and a lower range boundary with coherent support which needs to behold for a possible reversal and continuation, below the support level is a highly bearish zone for DXY. We have an uprising support line which you can see marked in grey, it is within the likely spectrum that we reach that line, from that level we need to confirm a stabilization in the price for a bullish outlook otherwise when DXY falls below that level it will be bearish and the next important target will be aimed at the support level at 88.7 which you see marked with the orange line in my chart.
In this manner, thank you for watching, support for more market insight, have a good time and all the best!
There are many roads to prosperity in the modern economy, but one must be contemplated.
Information provided is only educational and should not be used to take action in the markets.
EURUSD, All Targets Have Been Reached Rightly, Next Steps Ahead!Hello Traders Investors And Community, welcome to this update-analysis about the recent price-action, the current formation and where we can sustain further with EURUSD. The targets which I mentioned in analysis about the breakout and confirmation of EURUSD all have been reached right now, the best way to trade this setup was with the conservative approach after the upper boundary of the triangle confirmed. Both targets, the short-term and the middle-term-targets have been reached, if you did not see this analysis already I highly recommend it when going to the EURUSD section on my account. At the moment I discovered some enthralling signs which will determine the further outcome profoundly, therefore we are looking at the 4-hour timeframe.
The direction and breakout described in EURUSD (4-hour timeframe):
As we have reached the middle-term-target this is also an important resistance at the moment, because of this fact we get the loading bearish pressure that EURUSD currently shows in this area, therefore we can expect some more bearish downside the next time as long as EURUSD stabilizes at support or falls more. The next significant support in the next structure is the once been resistance which is now support at the 1.1 level, it is also coherently the short-term-target which I encountered and was reached in the overall uptrend. Therefore this zone is building a coherent bullish support-cluster together with the 800-EMA you can see in orange, adding these all together we have some good increasing likelihood for a bounce in this area.
Overall the current major uptrend isn't at its peak with the given information therefore there is still some room to move higher, this however needs to be confirmed properly. At first we need to see a stabilization in price at the support and after that a clear cross of the 1.114 level to move higher, when this happens and we do not get more bearish pressure action which will move the price to the ground, the target which you see in my chart at 1.126 will be activated with a high possibility given. A clear break of the current resistance can be traded with a conservative entry, the more aggressive approach will be to enter a position when EURUSD touched in the support-cluster, traders should decide according to own risk-preferences.
Thanks for watching everybody, support for more market insight, you can also add in my social media, good day everybody, and all the best!
Information provided is only educational and should not be used to take action in the markets.

NFLX, Breakout Of The Triangle, Aiming For Targets In The Range!Hello Traders Investors And Community, welcome to this important analysis about the current price-action situation within NFLX, it is clearly one of the profiteers of the corona-crisis as people staying at home in the lock-down and watching netflix-series. It is a good thing to relax especially in the current crisis where there is so much time left on the hand and nothing to do. So anyway this should not be a recommendation from my side but it is a growing economic field in the current crisis which shouldn't be ignored similar to the retail business like amazon or alibaba. On the technical side, I discovered some important bullish signs which made it clear that NFLX will develop some more moves to the upside, as it is at an all-time-high-level we are looking at the weekly perspective.
As you can see marked in my chart with the blue lines netflix just broke out a major ascending triangle which you can see marked with the blue lines in my chart. Netflix saw some good volume which confirmed the overall breakout and activated the target at the 580 level marked in green. This is the overall triangle target we have in the structure and it will also be the new all-time-high. To confirm it regularly we need to confirm the upper boundary of the ascending triangle, in this range we also have support from the 50-EMA, therefore, it is building a coherent bearish confluence-cluster in this range which you can see marked with the orange box in this level.
After the triangle target has been reached which is highly possible at the moment we need to see how NFLX develops further and if we can manage to climb above the triangle target and continue with its established uptrend. When we get some serious bearish pressure signs in that level it will be a interesting consideration to open up a short in this area otherwise the overall shape in trend is still in the direction upwards. The confirmation of the triangle can be used as a good conservative entry point to aim for the overall triangle target, otherwise the more conservative approach will be after we formed another high with good volatility after the triangle confirmed.
This price-movement in NFLX which we see here is anticyclical to the vast rest of the market because we established already an all-time-high in NFLX here. As I pointed out already in recent analysis there are gainers and losers in the current crisis and when considering something on the long-side we need to search to the truffles and hidden guesses we have in the market. It makes no sense to buy something which is cyclical with the market and don't profits from the current crisis like airlines which one of the smartest investors, warren buffet just sold recently. Therefore we should not fall for the illogical speculative approach like many people these days and look for stocks with a solid fundamental and technical base like NFLX in this case.
Thanks for watching everybody, support for more market insight and all the best!
Information provided is only educational and should not be used to take action in the markets.

BABA, Moving In Major Channel, Potential To Sustain Further!Hello Traders Investors And Community, welcome to this analysis about the current situation within BABA a stock which I detected in my observation and at the moment providing interesting and worthful signals which can prove profitable to keep in the schedule. As one of the major online retail traders beside amazon, it is a big profiteer of the current corona-crisis as the digital economy experiences an overall boom-phase and more and more people buying things online because of the corona-restrictions and beside it is more convenient as to go in a physical shop. These factors can show positive but this is the fundamental side, on the technical side we have also some meaningful indications right now, therefore we are looking at the locally 4-hour timeframe.
As you can see in my chart BABA is moving in a major rising uptrend channel where the price confirmed the 300-EMA which you can see marked in blue in my chart, overall we have some good support at the moment in that level which can provide a basis for further increase minimum on the short scale basis. What is adding to this scenario is that BABA has some gaps higher within the structure which looking for a gap-fill with liquidity providing volume at this price-range. Adding the exceptional support-cluster and the gap-fill-potential we currently have together we have a decent high probability to follow through with some upward-moving price-action similar as you can see it marked in my chart.
After the gap got filled we need to see and examine how the volatility was within the gap-fill, when we saw some good volatility also BABA has the potential to increase further when it confirms the proper support in the structure when this happens and we can stabilize here BABA will firstly test the short-term-resistance which you can see marked in my chart at the 220 level, this will be a major test because it is still important resistance but when BABA succeeds and maybe manages to hold this level there will be the test of the next higher resistance at 230 remainings. Remember that we need to see the proper confirmation before we can look for these levels as targets, firstly it is highly possible that we will fill the gap before we can consider the other targets as reasonable.
In the bigger picture, BABA is moving in an overall upward consolidation range here which can be bullish when we hold the range and gain support further. The fact that BABA is a major online retail trader gives a more bullish edge on the fundamental side of things which can be an indication for price increase, although BABA is not that big like amazon it is profiting from the crisis which needs to keep in mind. This theory is playing together with the technical side therefore it will be interesting how BABA develops further. On the reverse side it is important to hold the support otherwise when we fall below the rising channel it can provide bearish pressure which will drag the stock down, in this case, a good exit scenario as most often is the best decision.
Thanks for watching everybody, support for more market insight and all the best!
Information provided is only educational and should not be used to take action in the markets.

NZDUSD, Dobble Bottom Building, Confirmation Will Point Target!Hello Traders Investors And Community, welcome to this analysis about the current situation within NZDUSD and what the recent events can tell us about the ongoing outcome we can expect from NZDUSD the next time. In my observations, I discovered some interesting and significant signs which made it clear in which direction NZDUSD will go further. Therefore we are looking at the locally 4-hour timeframe.
As you can see in my chart marked with the cyan circles NZDUSD has built a major dobble bottom at the 0.591 level. We had some good volatility after we touched this level which catapulted the price to the actual condition. At the moment we NZDUSD confirmed the important 500-EMA as resistance therefore we can expect a correction the next hours and days to test the local support level which you see marked in my chart as possible support before moving upward higher.
After the support has confirmed successfully NZDUSD needs to take out the resistance which is building coherently out of the 0.615 resistance in grey and the 500-EMA in blue. Remember that when we take this level out and confirm it as support the dobble bottom we have in the structure here will be fully confirmed and it will activate the overall full-dobble-bottom-target you can see in my chart marked in black at the 0.64 price-level.
At the moment the current situation is a good opportunity for trading NZDUSD on the long-side, the overall setup can be traded aggressively or conservative. The aggressive approach will be to open trade before NZDUSD has confirmed above the higher resistance at 0.615 which will give good upside potential but higher risk, the conservative approach will be after NZDUSD has confirmed above the resistance at 0.615 which will provide a safer trade setup, traders have to decide according to individual risk-preferences.
In this manner, thanks for watching everybody, support for more market insight, and have a good weekend! ;)
Information provided is only educational and should not be used to take action in the markets.

PALLADIUM, Trading Near A-T-H, Targets Ahead When Confirmed! Hello Traders Investors And Community, welcome to this analysis where we are going to look at palladium, its price-action, and what we can expect from the future hours and days. It is one of the important metals and therefore a demanded exchange good in today's global economy. In my observations, I found some important and significant signs which will affect the price further and determine its outcome, therefore we are looking on the locally 4-hour timeframe.
As you can see in my chart palladium currently trades in a huge triangle which you can see marked in blue in my chart in which we have good bullish volatility and support at the moment which indicates a highly possible breakout to the upside as you can see the arrows marked in my chart. At the moment the bullish scenario is more likely because we have strong support in the range and has some good bullish volume but also we are still trading in a big correction that isn't completed yet.
After the triangle has confirmed properly we can expect palladium to test its higher levels, firstly it will be the middle line of the channel as you can see it in my chart when the price and trend stay stable in this region we can expect palladium to move higher at least testing the higher boundary of the uptrend channel and the all-time-high, as you can see the all-time-high is just slightly below the overall triangle target when this target is finally reached it can provide a new all-time-high which will be extremely bullish and can catapult palladium to next highs.
Remember that this scenario has to be confirmed properly, first we have to break the upper boundary with good volatility and close above the 600 and 800-EMA which you can see marked in my chart in light and dark blue. To wait on the right confirmation is the best option wise traders can do in today's market environment, otherwise, trading half-cooked and speculative setups can lead to unsatisfying results therefore it is important to always look and trade the best possible setups which today's market environment can provide to us.
Thanks to everybody for watching, support for more market insight, and all the best!
The ambition to transform opportunity into gold remains the most significant tool for a trader.
In this manner: FAREWELL
Information provided is only educational and should not be used to take action in the markets.
USDJPY, Develelops Rising Wedge, Target Ahead When Confirmed! Hello Traders Investors And Community, welcome to this analysis about the current situation is USDJPY and where we are heading further with price-action, I found some significant signs and signals which will determine the further outcome of USDJPY, at the moment it is still trading in an uptrend but this can change dramatically as the uptrend is weakening. Therefore we are looking at the 4-hour locally timeframe.
As you can see in my chart USDJPY is trading in an overall weakening uptrend on the middle-term which is building an excellent rising wedge at the moment, with already three touches of the lower boundary and two touches of the higher boundary. Such formations almost always break to the downside with a high percentage probability and as we are in a weakening uptrend this probability increases highly within the current situation facing USDJPY.
There is still a third touch of the upper boundary remaining which you can see marked in my chart, after this touch it is heavily possible that we will get a reversal there which will catapult us outside the wedge to the downside. As you can see this whole scenario needs to be confirmed with a break of the lower boudnary as marked in my chart, when this happens the target at 106.5 which you can see marked in orange will be activated.
At the moment this is an optimal textbook opportunity for trading USDJPY on the short-side but even though this is a high possible short-setup there is still a little percentage possibility remaining that it will break to the upside, in this case, it is the smartest option to wait for the confirmation like marked in my chart to set up the short there will be still huge profit potential left. After this scenario has confirmed completely we need to elevate and watch if USDJPY manages to hold the support and form a support or more downside is expected.
Alright, thanks to everybody for watching, support for more market insight, and all the best!
The ambition to transform opportunity into gold remains the most significant tool for a trader.
In this manner: FAREWELL
Information provided is only educational and should not be used to take action in the markets.

EURUSD, High Volatellity In Range, Tagrets Ahead When Confirmed!Hello, Traders Investors And Community, welcome to this analysis about the current structure and price-action we can watch in EURUSD, there are some interesting signs which I discoffered in my obersavtion which makes it clean that EURUSD will determine its targets when confirmed. Currently, we see high volatellity which can be an indication for a breakout sooner or later, we are looking at the locally time-frame.
As you can see in my chart marked with the blue trend-lines EURUSD is building a massive triangle here between the 1.06 and 1.11 price-level, there were some good trading opportunityes when trades took advantage of the overall up and down-swings in the range. The last time we saw a high voaltile bullish move to the upside after bunncing at the lower boundary of the triangle, such volatellity is often a reasoned sign for a possible break to the upside when EURUSD manages to hold the volatellity till the overall triangle is confirmed.
Currently we have still resistance above which has to be taken out for the proper breakout and arctivation of the targets you can see in my chart, the resistance consists of the 400 and 600-EMA you can see in my chart marked in blue and orange and also the higher boundary of the tirangle which is signaling an significant point of resistance here, therefore it is within the high likelihood spectrum that we see a pull-back to the lower boundary of the triangle like marked in my chart before we move up and finally confirm it.
The overall formation and possible breakout can be traded conservative or aggressive, the aggressive approach will be after the price confirmed at the lower boundary and the conservative approach after the confirmation of the triangle, traders should decide which one to take when considering the individual risk preferences, in this case the aggressive approach offers a good risk reward when stop-loss is placed below the 1.076 level this will provide a tight stop with huge profit-potential in the upside to come.
Alright, thanks to everybody for watching, support for more market insight, and all the best!
The ambition to transform opportunity into gold remains the most significant tool for a trader.
In this manner: FAREWELL
Information provided is only educational and should not be used to take action in the markets.

GOLD, Breakout The Bull-Flag-Formation, Confirming The Trend!Hello, Traders Investors And Community, welcome to this update-analysis about GOLD, there are some new meaningful signs in the current formation and price-action which I detected, the last time I mentioned GOLD I recognized an important bull-flag-formation within the structure if you did not see this analysis I recommend that you go to my account and have a look on it. The last hours we saw GOLD breaking out the current bull-flag with good volume and volatility, that is overall all an excellent sign for more continuation to the upside which I mention here with the targets integrated. We are looking at the locally 4-hour time-frame.
As you can see in my chart GOLD has still this strong rising-resistance-line above which serves as a highly important resistance in the structure. First of all, it is a good sign that we broke out of the bull-flag which you see in my chart, the next time it is within the high likelihood schedule that the bull-flag will be confirmed with a pull-back of the higher boundary of the bull-flag before moving higher after the confirmation. If the confirmation happens the next time this will be a good place to open a conservative long-position with a stop-loss below 1710 level, it is wiser to wait on the confirmation here than to rush in the trade as there is still some resistance above.
After the confirmation happened we can expect GOLD to move higher to the first short-term-target at 1775 which you see marked in my chart in grey after this target is reached we can expect that gold will have a smaller correction to correct its upward-move before moving higher and finally reach the overall full-bull-flag-target which you see in my chart at the 1790 level. This target also matches coherently with the rising blue resistance line and building a bearish confluence zone there. On the longer time-frame, I observed that GOLD is trading in a possible big inverted head and shoulder formation in which we are forming the right shoulder currently but this has to be confirmed properly and when it does we have a good sign to move higher in price action.
On the fundamental side, we have the overall stock-market which is declining and this is almost always a bullish sign for GOLD to move higher as the history showed already several times. When the corona-restriction do not increase in the country's again I do not see much of resistance for the growth of gold in the middle-term-basis, remember that when these restrictions increase or we get a second wave of corona-fears on the global-economy it can affect GOLD also as it affected the whole market-landscape, in this case, we need to be prepared and consider the changed situation again, therefore we need to do not get overly speculative and see the situation as it is because that happens fewer and fewer in today's markets.
Thanks for watching, support for more market insight, and all the best.
There are many roads to prosperity, but one must be taken.
In this manner: FAREWELL
Information provided is only educational and should not be used to take action in the markets.

GBPUSD, Bounced At Neckline, Determining Important Zones!Hello, Traders Investors And Community, welcome to this update-analysis about the price-action in GBPUSD, and therefore the resulting conclusion we can examine for the further sequence of price-action. As I pointed out in the past GBPUSD analysis the price formed an overall head and shoulders formation which confirms to the upside or downside, I also gave the conclusion that a break to the upside will be more in the spectrum of a likelihood because of some important factors, however, the bearish scenario was also given but now we have a good confirmation building the upside potential in GBPUSD. If you did not see the analysis already I recommend that you watch it to have a full depth-overview.
When looking at the given information now we can gaze that GBPUSD has touched the neckline of the head and shoulder formation and formed a bullish hammer candle there which is a strong bullish reversal candle and can be watched in all time-periods. As you can see in my chart the price bounced already several times at the rising trend-line of the neckline to form it as a solid support level. Currently, we saw some good bullish continuation candles after the initial bounce of the neckline, overall it is possible that we will visit support-line of the neck-line a second time to confirm it, in all occasion we can expect that GBPUSD will go the way up to the targets you can see in my chart.
A stable confirmation will be when we cross above the 1.24836 level, in this case, it is possible to open a long position here with a stop-loss below otherwise more aggressive traders can trade the formation with immediate entry and stop-loss below the bullish hammer candle, In the occasion to trade this current set up properly it will be a wise decision because of the risk-reward is good in this case and after the strong confirmation of the neck-line, the likelihood and possibility that we visit the targets increased dramatically. The first target is at 1.26373 which will be reached when we cross finally above the 1.24836 level and after that, we can count on the final target of the structure at 1.27558, you can see both targets in my chart.
Thanks for watching, support for more market insight, and a good weekend, everybody! ;)
Astonishment is the basis of reverence.
In this manner: FAREWELL
Information provided is for educational purposes only and should not be used to take action in the markets.

NZDUSD, Moving In Channel, Test Of Higher Boundary Remaining. Hello, Traders Investors And Community, welcome to this meaningful analysis about the current price-action building in NZDUSD and the overall formation resulting out of it. There are some relevant signs which are indicating to me a minimum test of the higher boundary of the channel we are currently trading at the moment. Also what we need to know is that after such a consolidation period we usually get an intense breakout either to the up or downside. In the scenario, for NZDUSD there is a higher tendency for a break-out to the upside. We are looking at the locally 4-hour time-frame.
As you can see in my chart NZDUSD is trading in a bigger ascending-sideway-channel where the price is consolidating to the upside. Usually, such a channel is more bullish than bearish but a possibility of a breakdown to the downside still remains and needs to be watched if confirming. But currently, we have a higher likelihood that NZDUSD will confirm the support-cluster you can see in my chart when touched. This can be traded conservative or aggressive, the conservative approach will be smarter here.
Furthermore, we have the two major important EMAs coming together in the zone at 0.60538 as you can see marked in my chart with the grey trend-line. They are close to a bullish crossover but either we did not confirm above the channel I don't see it coming so soon. The next support building in this area is the logical support-line which is formed from the highs we had in the previous trend which makes this level a significant support-cluster which will be highly likely confirmed bullish when touched.
The importance is here that we confirm it as solid support with clear confirmation to the upside otherwise the price can still bounce at this level come back bounce again and finally moving below that level, therefore, it is important with which momentum we touch this zone, overall we can say that the channel will be confirmed and for now there is a higher degree of liability for a break to the upside but this can change when we get major bearish signs inside the channel which indicating supply and bears entering the market.
Thanks for watching, support for more market insight, and a good weekend, everybody! ;)
Enlightment is under our feet as well as over our heads.
In this manner: FAREWELL
Information provided is only educational and should not be used to take action in the markets.

GBPJPY, Bounced At Key-Level, Suggesting More Upside Potential! Hello Traders Investors And Community, welcome to this analysis about the current fundamental and important price action and its structure occurring in the GBPJPY contemplating further outcome, there are some important and meaningful signs which are indicating that we will continue with the overall trend with which we began after bouncing at the key-level at 124 when the smaller correction has completed.
When looking at my chart we can see that GBPJPY is at the moment correction the heavy up-ward movement we have seen from 124 to 135, this is natural and will occur in a trend, the question now is if it is just a smaller correction or a reversal to the downside, this can be answered when looking at the overall heavy volume and momentum with which the upward-move occurred, therefore, it is not a weak move and this is implying to us that a continuation to the upside is within the possible spectrum.
As you can see the next significant support is at the 128.6 level which is marked in orange, when we visit this level we will highly likely bounce there. If this occurs like imagined we can see the uptrend approaching the higher resistance level at 135 which you can see marked in grey and the important 50-EMA in orange which is still resistance but can be taken out, these levels building a logical resistance-confluence zone which we will first test after moving possibly higher to the bigger falling resistance line you can see marked in blue.
Overall we can keep in mind that the bullish trend established from the key-level can continue but that has to be confirmed rightly and for a further continuation with a new high in the structure we need to take out the important resistance-zones already mentioned. This structure can be traded with an aggressive entry after the support-level touched or with a conservative entry after confirming the continuation trend with the proper volume and momentum.
Thanks for watching the analysis, support for more market insight, and all the best.
The market will teach us when to enter and when to keep patient.
In this manner: FAREWELL
Information provided is only for educational purposes and should not be used to take action in the markets.

AUDUSD, Rising Trendline Broken, Will Test Remaining Resistance!Hello, Traders Investors And Community And welcome to this analysis about AUDUSD and its current situation in the remaining weakening up-trend, there are some important signs I detected in the current price-action AUDUSD is showing us. We are looking at the 4-hour local time-frame. AUDUSD is still in an overall uptrend but the price begins to weaken therefore we will test higher levels and to continue with the trend AUDUSD need to establish stable support here. Lets go!
When looking at my chart we can see that AUDUSD is still trading in an overall bullish trend but currently and seen in the last days and week the trend begins to struggle as we are approaching several resistance levels this is why AUDUSD crossed the first trend-line already successfully to the downside as you can see in my chart after that happened AUDUSD wanted to test higher levels and finally formed a new higher high with a second trend-line which got broken just the last days as you can see it in my chart.
The big common ground in both breakdowns is that AUDUSD actually tested the trend-line before moving a little bit down and confirming the 200-EMA as support the same will happen now again as the trend is weak on the short-time scale although the difference now is that what was the 200-EMA to test before is now the 100-EMA, you can see this scenario in the chart. Furthermore, as we have still serious support in this area minimum the test of higher levels is in the possible spectrum and shouldn't be ignored.
What we need to know now is that the next important resistance is at the 0.65569 level which you see in the chart marked with the grey trend-line, it also matches with the rising blue trend-line and building a logical confluence-zone there. After that we can get the next confirmation at the 100-EMA and moving higher to test the second grey resistance level at 0.67058 to form a possible higher high, it will be a similar mechanism to the higher high we have formed in the previous uptrend as you see it in my chart.
To continue with the overall bullish trend we have to establish more support in that area and hold the range otherwise we can still fall down as the global momentum begins to slow down and the bulls weakening, the first big confirmation in this scenario will be when we confirm below the 100 and 200-EMA and form a bearish cross this will be a stable signal to open a short position otherwise we are still remaining in the bullish trend and need to look if and how it can continue with the bullish scenario.
This should give you a good overview of the situation, have a good day, and support for more market insight!
“All I have seen teaches me to trust the Creator for all I have not seen.”
In this manner: FAREWELL
Information provided is only educational and should not be used to take action in the markets.

GBPUSD - Possible H%S Forming, Breakout Will Determine Target!Hello Traders Investors And Community, hopefully, everybody of you is doing well in today's market environment and welcome to this analysis about the current price action and formation forming in the GBPUSD, there are some interesting signs which I detected and make it clear that we will get a heavy breakout either to the up or downside, both scenarios can be traded properly after the initial confirmation. We are looking at the locally 4-hour time-frame.
When looking at the chart we can see that GBPUSD is still in an overall uptrend with a consolidation currently occurring since 26th march, I detected that the overall current consolidation is a potential head and shoulders formation, you can see its market in my chart with the blue neckline and its left shoulder, head, and right shoulder. The big importance of this formation is that it needs to confirm to be fully validated and to point the right target out.
The next time we can expect a touch of the blue neckline as you can see it in my chart. After this touch, we can expect GBPUSD breaking out in the bearish or bullish direction, the good thing now is both cases can be traded with entry after confirmation! The breakout has to be confirmed with high volume and in the best case with high momentum. After the breakout and confirmation happened we can set the trade with the proper target. It will be interesting to see how it will play out.
Currently, there is a higher potential given that we will break out to the upside because we are moving in an overall uptrend with its origins at 1.4118 before we built momentum to the point now, the bullish scenario will be 100%ed confirmed when we cross above the blue 100-EMA you can see in my chart. But please note that this does not necessarily play out, it is also in the possible spectrum that we confirm bearish as the correction takes longer than expected.
Thanks for watching, have a good start of the week and support for more market insight!
Let the market decide, it knows when to take off or break down.
In this manner: FAREWELL
Information provided is only educational and should not be used to take action in the markets.

EURUSD, Confirmed Triangle, Building More Upside Potential!Hello, Traders Investors and community, welcome to this analysis about the price action happening in EURUSD, I discovered some significant events happening the past days which will affect price-action further the next time. We are watching on the daily chart.
When looking at my chart you can see that EURUSD traded in a huge triangle which finally confirmed to the upside. This triangle had also the potential to break to the downside therefore it was very important to wait for the confirmation in this structure. As you can see in my chart the upper boundary of the triangle confirmed with a very nice bullish engulfing candle that shot the price from 1.0835 to 1.09685 in just one day which is a highly bullish sign.
We had also a second confirmation at the 100-EMA which built a logical confluence-zone together with the upper boundary of the triangle and after that, the price came above the 350-EMA which is at all a good structure for further continue. We can expect a second confirmation of the 100-EMA the next hours and days as you can see it in my chart, from there EURUSD has definitely room to move higher.
The next meaningful resistance-zone is at 1.10567 which you can see in my chart after we approach this level EURUSD can move higher 1.11489 level which has build resistance from the top of the triangle. The overall structure still looks decently bullish and we have definitely room to move higher, will be interesting to see how we advance.
Thanks for watching the analysis, have a good day, and support for more market insight! ;)
"Science is organized knowledge. Wisdom is organized life."
In this manner: FAREWELL
Information provided is only educational and should not be used to take action in the markets.

AUDUSD - Two ways one outcome! Hello traders, investors and community. Today i will take a bullish look on AUDUSD and what the chart is showing me, the absolute high probability signs for some bullish outcomes. On my chart you see the daily price action of AUDUSD. AUDUSD is just about to form a massive bottom formation with an descending triangle about to complete. I detected it and it is marked with the red trendlines, price is still remaining in the triangle. It is for sure that it will break out and form some bullish movement, the question is when it will complete.
In my chart you can see that price is touching the upper trendline of the triangle, it is possible that we break out of the channel the next time otherwise price can still remain in the triangle and touch the lower trendline before it breaks out. Also AUDUSD had some good volume, (over average), in the last bull-wave which you see in the chart. There is a huge support zone at 0.64 - 0.69, that if we come back to this level there is a high probability for some good support in this area.
Also you see this huge bullish dragonfly doji formed on the 3th of january, this shows how storng and important that support level is.
When we break out of the triangle without coming back again! There is a target projection which you see in my chart. This target will be intact when we break out and confirm the triangle. When you see the light blue striped trendline where the target remains you can see that it is EXACTLY the point of resistance of the previous bear moves till we reached the bottom. You can see it marked with the dark blue square.
If we remain in the triangle and breakout later the target will be a different price but the same length!
The RSI shows me that we had some oversold condition before the two last bull moves began, it can come back to the trendline and form a bullish divergence. I am expacting this to happen either when we break out of the triangle now or when we remain in the triangle and confirm the lower trendline.
This i only educational information and should not be used to take action in the markets!
Peace and love to everybody!

EURUSD - from Daily to M30📹Hello TradingView Family / Fellow Traders. This is Richard, also known as theSignalyst.
📈 Here is a detailed update top-down analysis for #EURUSD.
Which scenario do you think is more likely to happen? and Why?
📚Always follow your trading plan regarding entry, risk management, and trade management.
Good Luck!.
All Strategies Are Good; If Managed Properly!
~Rich

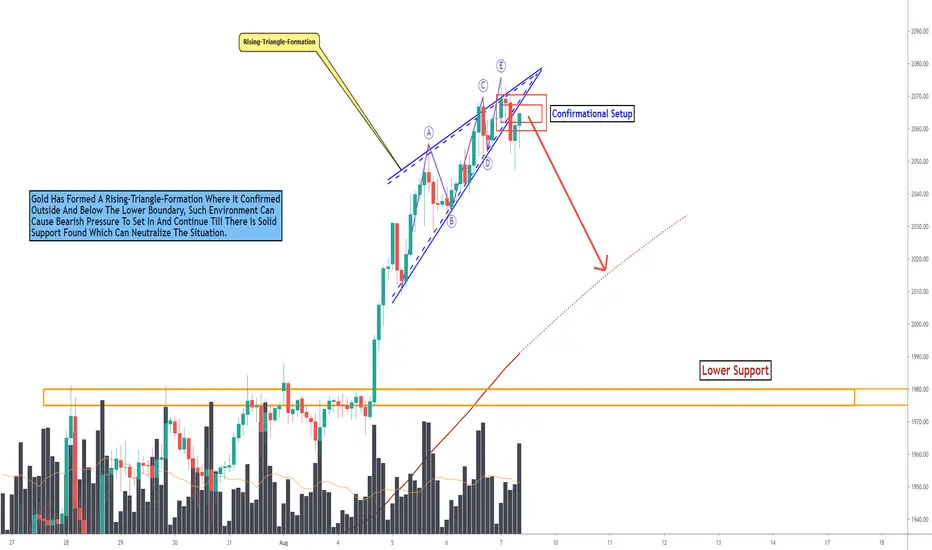
GOLD, This Formation Is A Decisive Factor In The Current Pace!Hello Traders Investors And Community, welcomt to this analysis where we are looking at GOLD 2-hour timeframe perspective, the recent events, the current formational structure, what we can expect the next times and how to handle the situation. As GOLD provided a massive bull market to the upside with heavy volatile bullish moves we should not be naive and expect it to go on forever as the market is oversold the logical follow-up normally after such phases is minimum a correction when not bigger pull-back, therefore we should not keep the bearish scenario by side and look at the current circumstances to wage possibilites in the right manner. In this case I detected some important signals in the current situation which will determine GOLDs outcome.
Looking at my chart you can watch there that GOLD is building up this rising-triangle-formation which is in the most cases a bearish formation which shows outcomes to the downside and continuation ahead, as the price already confirmed below the lower boundary which is marked in blue in my chart this gives the current price-action another confirmational bearish edge. All these signs giving a higher possibility for continuation to the downside till there is solid support found which is firstly the 100-EMA you can watch marked in red in my chart where GOLD can stabilize and reverse to continue with its upside course, when this does not happen and GOLD falls below the next crucial support will be between the 1975 and 1980 level marked in orange.
Taking all these factors into consideration we can come to the conclusion that GOLD can defnitely provide continued bearishness on the short-term but that does not mean GOLD is completely bearish further only when it does not manages to hold important mentioned support bases and falls below them there can come more bearish pressure and continuation to the downside till then the bearishness remains only on the short-term-perspective. But the estbalished bearishness and follow-up should not be ignored as it can also increase in such environments. In this case it will be highly important to look further and see what GOLD will do when it arrives on the remaining support bases to test them and if there is bearish continuation ahead or a reversal in the range.
In this manner, thank you for watching, support for more market insight and have a good day!
“Trading effectively is about accessing possibilities, not certainties.”
Information provided is only educational and should not be used to take action in the markets