Overall Sentiment for US Economy from January to May 2024The period from January to May 2024 has been marked by significant bearish sentiment due to multiple geopolitical events. The escalation of conflicts in Ukraine, increased US-China trade tensions, disruptions in the Red Sea, and heightened hostilities in the Middle East have collectively contributed to market instability. These events led to increased energy prices, supply chain disruptions, and heightened global volatility, which pressured the US Dollar Index.
The overall bearish impact on the dollar was driven primarily by inflationary pressures from higher oil prices and increased geopolitical risks, reducing demand for the dollar as a safe haven. Large institutions had to adjust their portfolios and manage risks strategically to navigate the volatile environment.
Marketanalysis

Nifty Short, Medium, Long Term 20-May-24 to 24-May-24Nifty Short, Medium, Long Term 20-May-24 to 24-May-24
Nifty closed at 22502 (22055) and touched low & high of 21836 & 22514
Nifty was up from the support level.
RSI and stochastics levels was up from last week (56 % & 69% Respectively). Both are moving up towards oversold zone.
Nifty 22502- Short & medium term (Neutral till it cross 22820 decisively)
As mentioned in the past 1.5 month, nifty reached the near term target 22819 (Fibonacci extended resistance target) again, formed a 'W' pattern. ( 22819 Target- which is the % of difference between Oct21 Peak -Jun22 Low from Oct 21 peak/23000 which need be crossed decisively. Nifty at PE 21.5 below the Historical Average of 22.5, only Political results is awaited which will give a clear direction.
Short term support 22312 (MA 50)- Nifty last week had a pause between 2220-22300/ 22050 ( Trend Line Support as shown) /21800
Medium term Support - 20877 Fib Support as shown in the chart.
Long Term
Market expected range bound between 24000 ( Trend Line Resistance till Jun 2024) &
Support at 20225 / 20000 ( Fib Resistance),19500 expected in 2024.
Q3 results are average except bank & Nbfc stocks, further up move will have target of 23150 ( Trend Line), 23500 ( Fib Resistance).
All Companies so far posted results are average other than Bank & Finance stocks which posted Good results, IT posted muted growth, Maruti posted good results, Reliance, Ultratech posted good growth. Other manufacturing, capital goods companies results are awaited in coming weeks.
Nifty bank 48199(47421) - Nifty bank tested trend line support 47000 last week and later part of the week. Many bank & Finance stocks are buyable zone. As insisted for last 3 months Banks & Finanace Stocks are really good and will give good results, as expected Q4 results are good especially for Axis Bank , Indusind bank ,ICICI Bank definitely can be added as portfolio stock. Kotak Bank ( after the fall due to RBI regulation can be added slowly whenever there is a dip), Bank of Maharasthra ( Buy on Dips) ,Canara bank( Buy on Dips) can be accumulated slowly as well.
Following Finance Stocks can be added as it posted good results are Bajaj Finance, Bajaj Fin Serv, Manappuram Finance, suryoday small fin,Motilal Fin, Chola Finance, ICICI Securities. Other stocks like Dr Reddys, Natco Pharma, Cipla, JK Cements, Apollo tyres, Biocon, Coforge & persistent Sys can add these stocks to portfolio. Please buy in parcels and every dip of Index and every dip of individual stocks (2-5% of portfolio on each purchase for long term)
Comments :
Positive Lok Sabha Election result expectation, Global trend helped sustaining the market above 22000.
Recent Electoral bonds, CAA implementation news couldnt make the market down as market is confident that current govt will win more than halfway mark, continue govt post election without any additional support of other parties so that govt can be confident enough to take decisions. Hence whenever there is a dip in the market, continue to buy on small quantities till post election survey results are revealed on Jun1- Jun 3rd and Jun 4th Election results.
Hence market is in good buy whenever there is a dip. Post Elections, only way Market will start grow higher by reduction of interest rate by RBI on a staggered manner till it reaches 5%. US fed rate reduction also expected from Jun/ Sep 2024. Market may correct if any global news till 19500 as there is strong multiple fib support in this range.
Nifty IT broke the Major support at 33350 and went down upto 32919. Nifty IT Stocks like TCS, Infosys, Wipro gave muted results in Q4 2024. Can be added for short rally as it fell sharply, however strictly for long term and also in portions slowly on each fall ( say 5-10% of total investment in IT stocks). Whenever there is such dips and new lows ( in the last 1 year) We can add slowly considering 2-3 years. It need to break above 38000 needed to further move up. Future of technology stocks are in high pressure due to AI as it is reflecting in US and Indian technology stocks. Especially Indian IT stocks is in a non decisive path and downtrend.ifty Short, Medium & Long Term View- 13-May-24 to 17-May-24
every dip of individual stocks (2-5% of portfolio on each purchase for long term)

Aggregate Rate of Return All 401(k) PlansThe purpose of this chart is to show how retirement funds are drained once returns reach 20%.
The reason this happens is because the purpose of the 401(k) is to prevent working people from ever reaching anything that resembles financial independence.
From the time we begin our careers to the time that we reach retirement age, we are CONSTANTLY told that if we do NOT use the 401(k), we are "leaving free money on the table".
But look at the chart.
The reality is: retirement funds get drained, people lose their life savings ('08), and big institutional funds (supposedly fiduciaries) get bailed out, WHILE YOU LOSE EVERYTHING YOU WORKED TO BUILD.
All I'm saying is: if you work with a "financial professional", you have a right to ask questions. You have a right to seek answers. You have a right to know what THEIR plan is for YOUR money.
Look at the S&P 500.
Ask your advisor: What causes these massive drops? Why does this occur? Am I protected?
I will build on this in my subsequent chart publishing.

S&P rally continues; will we see new high?After confirmation of control in the first days of May, bulls enjoyed their dominance. The market opened with a gap up on Monday, rallied throughout the entire week, and closed very strongly within the top value area. There was some profit-taking on Monday, but sellers were not able to push the price even below the previous day's high. At this stage, there are no major warning signs for the buyers. On the other hand, there are many signs that confirm their strength:
1. Price is in a daily uptrend, aligned with higher level context (weekly/monthly uptrend).
2. Two unfilled gaps (Friday the 3rd and Monday the 6th).
3. Strong close of the week within the top value area (price has retraced >80% of April’s bearish wave).
The only technical weakness on the chart is the monthly consolidation. Bears might try to defend April’s high ( 524 ), but unless they receive support from economic reports coming this week, their position looks very vulnerable.
An important level for the bulls is 515 , where the price pivoted on Wednesday after a pre-market sell-off. Important economic data will be released on Tuesday and Wednesday, which could cause volatility in both directions. But as long as there are no major negative surprises, pullbacks are buying opportunities
Disclaimer
I don't give trading or investing advice, just sharing my thoughts.

MARKET ANALYSIS To day we look at some market on GOLD ,GBPUSD and GBPJPY and market some relevant way price is likely to move .

Strategic GBPJPY Selling AnalysisExplore the latest trends in the GBPJPY forex pair with identified sell levels at 195 and 197. Our comprehensive analysis delves into key market drivers, technical indicators, and fundamental factors, providing strategic insights for navigating the dynamic GBPJPY landscape.

📉📈 SUPER Trade Analysis 🔄💼Trade Overview:
SUPER has reached a robust support area, maintaining its position for the past month, indicating potential for a long trade opportunity.
Trade Strategy:
Entry: Consider entering a trade between $0.81 - $0.93, capitalizing on the strong support zone.
Take Profit: Set take profit targets at $1.118 - $1.27 and identify the next area of resistance at $1.40 - $1.55.
Stop Loss: Place the stop loss just below $0.77 to mitigate risk.
📊🔍 Stay vigilant and monitor SUPER's price movement for trade management! #SUPERTrading #CryptoAnalysis 🌐🔒

🚀💻 Nvidia (NVDA) Analysis 📈🔍Market Overview:
Nvidia's NASDAQ:NVDA recent rally has bolstered bullish confidence, driven by anticipated revenue and profit growth, and positive analyst outlooks, particularly from Goldman Sachs. The company's leading position in the AI-powered GPU sector further contributes to positive sentiment, with potential for continued uptrend supported by upcoming earnings reports.
Analyst Projections:
Goldman Sachs' raised target price of $1,100 per share reflects market optimism, fueled by revenue growth forecasts to $110 billion by 2025 and 8% annual profit growth through 2027.
Investment Outlook:
Long-Term Breakout: Investors are eyeing a potential long-term break above the $1,000 mark, aiming for sustained momentum beyond historical highs.
Risk Awareness: A break below the current upward trend line could disrupt the bullish scenario, leading to sideways movement or attempts to push the price lower.
📊🔍 Stay vigilant for signs of trend reversal or corrective movements while monitoring Nvidia's performance! #Nvidia #StockAnalysis 📉🚀

RIDING THE BITCOIN BULLRiding the Bull: Long positions activated as Bitcoin's halving sparks bullish fervor! 🚀
Major support at 52300 holds strong.
Let's soar to new heights!
#Bitcoin #Bullish #HalvingHype

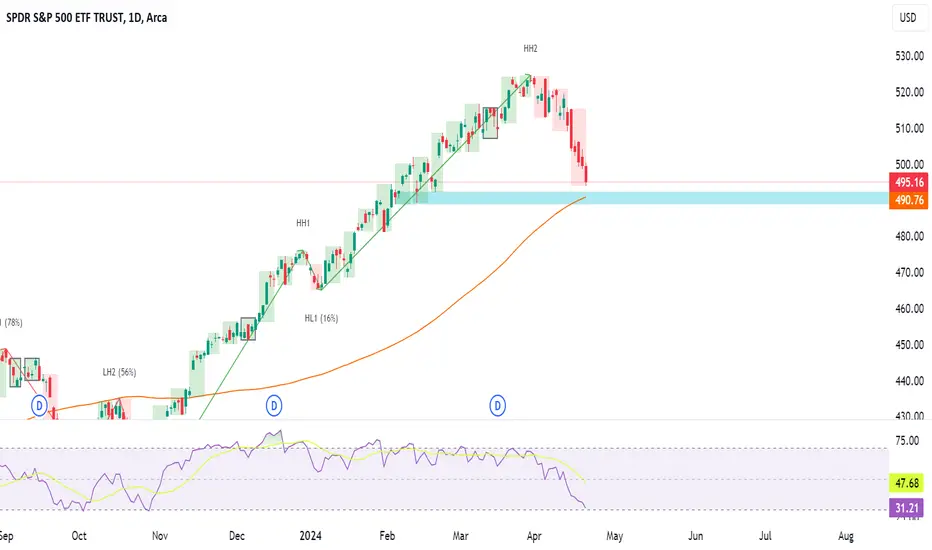
S&P bulls attempt to regain control but they are not there yetLast week, using oversold bounce, buyers attempted to regain control over the price. Their effort was somewhat successful, as they managed to establish both a higher low and a higher high on the daily chart. However, they failed to set a weekly low, which was a challenging task given the magnitude of the previous week's range. This indicates that bears still maintain control over the weekly (and monthly) timeframes, suggesting that we should expect to see more selling pressure in the short term.
The immediate objective for bulls is to test the price above last week's high ( 509.9 ) and to close the month within March's range. They must also protect the last higher low ( 497.5 ) or the last weekly low ( 495.5 ), or else their progress will be undone.
The short term outlook is mildly bearish.
Watch out for volatility on Wednesday as important economic data is released and FED announces decision over interest rate
Disclaimer
I don't give trading or investing advice, just sharing my thoughts.

Premium Gold idea $$$ #xauusdThe XAU/USD (gold) pair is currently experiencing a wick down, indicating a temporary bearish movement in the market. Despite this short-term dip, the overall sentiment for gold is becoming increasingly bullish for day trading. Many traders view this as a buying opportunity, as gold is seen as a safe-haven asset during times of economic uncertainty. The recent dovish stance of central banks worldwide has further boosted the appeal of gold as a hedge against inflation and currency devaluation. From a technical standpoint, the wick down may be considered a retracement within a larger uptrend. Traders may look for buying opportunities near key support levels or trendlines to capitalize on potential upside momentum. Overall, with strong fundamentals and technical signals aligning, the XAU/USD pair is likely to resume its bullish trend in the near future, making it a favorable option for day traders.
entry :2309.32 - wait for the wick down first then as it comes back up enter
SL: this is the wick down I'm talking about allow market to wick down first then when you see a clear buy signal get in
TP1 2319.09
#XAU/USD #gold #marketanalysis #bullish #daytrading #safehavenasset #economicuncertainty #dovishcentralbanks #inflationhedge #technicalanalysis #supportlevels #uptrend #buyingopportunities #traders #riskmanagement
Like share comment and hit the follow button for more premium Free ideas thanks
Trade God out

✅ Daily Market Analysis - 01 MAY 2024Economic events:
USA - ADP Nonfarm Employment Change (Apr)
USA - S&P Global US Manufacturing PMI (Apr)
USA - ISM Manufacturing PMI (Apr)
USA - ISM Manufacturing Prices (Apr)
USA - JOLTs Job Openings (Mar)
USA - Crude Oil Inventories
USA - FOMC Statement
USA - Fed Interest Rate Decision
USA - FOMC Press Conference
On Tuesday, the S&P 500 underwent a decline, terminating its five-month streak of consecutive gains. This downturn was propelled by apprehensions surrounding inflation, ignited by data highlighting wage pressure. Concurrently, this development aligns with the commencement of the Federal Reserve's two-day meeting.
The Dow Jones Industrial Average witnessed a decline of 570 points, equating to a 1.1% decrease, while the S&P 500 experienced a 1.5% drop, and the NASDAQ Composite saw a 2% downturn. Particularly noteworthy is the S&P 500's recording of a 3% loss for the month.
NDX, SPX, and DJI indices daily chart
The escalation in US labor costs throughout the first quarter exceeded expectations, primarily propelled by rising wages and benefits. This development has revived apprehensions regarding inflation, particularly amid a diminishing investor confidence in potential Federal Reserve rate reductions.
As per the Employment Cost Index, labor expenses surged by 1.2% in the preceding quarter, following an unrevised 0.9% uptick in the quarter prior. On a year-over-year basis, labor costs climbed by 4.2%.
This report emerges following recent data indicating a buildup of price pressures in the initial quarter, amplifying concerns surrounding inflation.
The downtrend of EUR/USD persists for the second consecutive day, with the pair hovering around the 1.0650 level during Asian trading hours on Wednesday. Amid European market closures in observance of Labour Day, market participants eagerly anticipate the Federal Reserve's forthcoming policy decision.
EUR/USD daily chart
Despite the release of robust Eurozone data on Tuesday, the Euro encountered challenges in sustaining its upward trajectory. Notably, Eurozone GDP surpassed expectations, expanding by 0.3% in the first quarter. Moreover, the Harmonized Index of Consumer Prices (HICP) exhibited stable year-over-year growth, meeting anticipated levels. However, the core HICP, excluding food and energy prices, exhibited a softening trend, albeit still surpassing estimates.
Investor sentiment remains optimistic regarding the possibility of interest rate cuts by the European Central Bank in June, as a majority of ECB policymakers have signaled their endorsement for such measures.
On Tuesday, the Japanese Yen incurred notable losses against its American counterpart, reversing a significant portion of the gains witnessed the previous day, driven by the potential intervention by Japanese authorities. The primary contributor to the JPY's weakness is the substantial interest rate differential between Japan and the United States, a trend expected to persist in the foreseeable future. This, combined with heightened demand for the US Dollar, propelled the USD/JPY pair higher during intraday trading.
USD/JPY daily chart
Following the publication of the AiG Industry Index on Wednesday, indicating a continued contraction in Australia's private business activity for March, the Australian Dollar remains subdued. Despite this, market sentiment suggests that the Reserve Bank of Australia will maintain its current interest rates of 4.35% in the upcoming meeting scheduled for next week.
The Australian Dollar faced additional downward pressure following the release of disappointing Aussie Retail Sales data on Tuesday, raising speculation about its potential impact on the RBA's interest rate stance. However, optimism stemming from higher-than-anticipated domestic inflation figures from the previous week has led to speculation that the central bank might delay any decisions regarding interest rate cuts.
AUD/USD daily chart
During the early Asian session on Wednesday, the NZD/USD pair faces selling pressure around the 0.5880 level. The New Zealand Dollar depreciates in response to worse-than-expected employment data from New Zealand.
NZD/USD daily chart
In the first quarter of this year, New Zealand faced a notable increase in its unemployment rate amidst a prolonged recession compounded by high-interest rate conditions. According to Statistics New Zealand's report on Wednesday, the nation's Unemployment Rate rose to 4.3% in Q1 from 4.0% in Q4, surpassing market expectations of 4.2%. Simultaneously, Employment Change figures recorded a decrease of 0.2% in Q1, contrasting with the previous reading's 0.4% rise and falling short of the projected 0.3% increase.
The upsurge in the unemployment rate may prompt the Reserve Bank of New Zealand to uphold its elevated rate for an extended duration to counter inflationary pressures. Market sentiment suggests that the RBNZ is inclined to maintain a restrictive Official Cash Rate, with any potential for rate cuts unlikely until 2025.
As the Federal Reserve initiates its two-day policy-setting meeting, market consensus leans towards the central bank maintaining its benchmark interest rate within the current range of 5.25%-5.50%, a level sustained since July.
Investors are particularly attentive to Federal Reserve Chair Jerome Powell's subsequent remarks following the monetary policy statement. These remarks are expected to carry substantial significance, with investors keen to glean insights into Powell's alignment with the market's less dovish perspective on the rate outlook.

Weekly Outlook - 27/04/2024Last week brought huge earnings reports for some of the big US tech companies, with mixed reactions. We saw META lose 7% during the previous week after a great earnings report, and Alphabet (GOOG) soaring 10% on Friday. Next week, we will see earnings from Amazon (Tuesday) and Apple on Thursday as well as other large cap earnings reports. Will the market be pricing in higher earnings off the back of last week's form?
First, let's observe the broader markets...
S&P 500
SPX looks to have created a bearish break of structure. I am anticipating a retrace into the pattern, at approximately $5,200 (around a 2% up move), at which point, the price may look to reverse to the downside. We can find confirmation for this on the RSI, where the momentum, which was holding at ~40, was broken and bulls are clearly losing power for the time being.
DXY
The DXY (or dollar index) is inversely correlated to the S&P 500. To put it simply: dollar goes up; stocks go down, and vice versa.
In this image, you can see that the DXY has broken down from the highs and is looking to retrace. We have already seen a throwback into the consolidation pattern, and are now looking for the dollar to retrace...thereby adding confluence to the fact that stocks will see a rise in the early days of the week
AAPL
For AAPL, it is simple. A break below $165.67 would cause a major impulse to the downside, targetting ~$149.50. However, with current momentum, what I believe is more likely is a retrace to between $186 and $191 (an increase of nearly 10% and 13% respectively). For this to happen, a clean break of the swing high at 178.36 would need to occur.
That's all for this market outlook. In conclusion, I am looking for a declining dollar and rising stocks in the early part of next week.
Let me know what you think.
Cheers

S&P Bears are strong but Bulls still have a chanceLast week, sellers firmly controlled the market. Buyers attempted to defend March's low, but the bears left them no chance. Prices consistently declined for six consecutive days, with the futures chart ( CME_MINI:ES1! ) appearing even more bearish.
We are now approaching a critical juncture, which presents a significant opportunity for buyers to take a stand. The daily RSI is nearing an oversold condition, and simultaneously, the price is approaching the SMA100 alongside a horizontal support level ( 490 ) from the February consolidation.
There is no absolute certainty that buyers will seize this opportunity, but we should closely monitor the price action next week. Although sellers have demonstrated their strength, we are still in a weekly uptrend, and trends do not end easily unless there is a radical shift in sentiment. Despite negative news in recent weeks, nothing has emerged as critically detrimental yet. However, this could change, so we must regularly reassess the situation as new information becomes available.
The short-term outlook remains bearish, but this could change depending on how the price reacts to these support levels.
Disclaimer
I don't give trading or investing advice, just sharing my thoughts.
XAUUSD Short Setup: Potential Sell Opportunity!We're eyeing a short opportunity on XAUUSD around the $2355-2360 range, where the price is expected to encounter resistance. This level coincides with the Fibonacci 0.50 retracement level, a key trendline test, and upcoming PMI news, suggesting a potential reversal. Heightened geopolitical tensions further support the bearish bias. Stay tuned for detailed analysis and trade insights!#XAUUSD #ForexTrading #ShortSetup #TechnicalAnalysis #GeopoliticalFactors #PMINews

Today's Gold Price and Future DirectionAmidst prolonged tensions in the Middle East, global gold prices have surged, defying expectations despite robust economic data from the U.S. The sharp rise in gold prices comes as Israel signals readiness to retaliate against Iran's attacks, disregarding calls for restraint from Western nations.
In the face of escalating geopolitical tensions, global gold prices show no signs of slowing down, with projections pointing towards a potential climb to the $2460 mark. Additionally, the metal is approaching a critical Fibonacci 1.618 profit-taking level, aligning with predictions from Dow Theory."

Gold Market Update Exploring Trends Stay ahead in the gold market with our latest analysis! Gold prices are holding strong around $2385, with potential to breach the $2400 mark amidst escalating tensions in the Middle East. Geopolitical uncertainties drive investors towards gold, making it a safe haven asset of choice. Our in-depth analysis delves into market trends, technical indicators, and trading signals to guide you through potential opportunities. Explore the impact of central bank activities and inflation expectations on gold's trajectory. Don't miss out on valuable insights – keep informed with our comprehensive gold market update

🟢📈 Market Update: BTC Breakout Potential! 📈🟢📊 Analysis:
Market Movement: The market opened with a bullish tone, with BTC attempting to break through the top of the range support area at $66,000.
Key Levels: Watch the 0.618 – 0.786 Fibonacci retracement level closely, spanning $68,000 - $70,000.
Potential Scenario: A successful break above this level could lead BTC to retest the all-time high at $73,800.
Risk Awareness: If BTC faces rejection, it may signal further downside, necessitating cautious risk management.
📈 Trading Strategy:
Observation: Monitor BTC's price action around the key Fibonacci retracement levels.
Entry: Consider long positions if BTC breaks convincingly above $70,000.
Targets: Target potential retest of the all-time high at $73,800.
Risk Management: Implement appropriate stop-loss measures to manage downside risk in case of rejection.
🚦 Stay Alert: Market trends may shift rapidly, so stay vigilant for changes in price dynamics! 📊📉 #BTC #MarketAnalysis #TradingStrategy 🌟📈

Cracking the Code: XAU/USD Insights TodayToday, gold continues its upward momentum, eyeing the $2,400 milestone. Fueled by a weakening U.S. Dollar and subdued Treasury yields, gold remains a safe haven amidst global uncertainties. However, attention turns to Federal Reserve policymakers whose upcoming speeches may sway market sentiment. Stay tuned for key economic data releases and policy whispers shaping gold's trajectory.

S&P weekly consolidation in progressAt the end of last week, sellers confirmed weekly consolidation by closing below the previous week's low. From now on, bears have control over the price on the weekly timeframe. We should monitor the progression of weekly lows and highs to see when things start to shift, but until then, we should trust the sellers.
It is also notable that if we look at the futures chart ( CME_MINI:ES1! ), we can see that buyers were unable to close above the previous day's high for the last 10 trading days. If buyers want to regain control, this will be their first objective.
Please note that the price is currently positioned near the previous month's low, which can provide an intermediate support level. If you’re planning to short the market, it is better to wait for a pullback or for a breakout with retest.
Finally, if weekly consolidation will convert into monthly consolidation it will be a major win for bears.
Disclaimer
I don't give trading or investing advice, just sharing my thoughts.

Short-term DXY Analysis: Navigating a Diamond Bottom 📈💎Short-term DXY Analysis: Navigating a Diamond Bottom 📈💎
The US Dollar Index (DXY) is a critical indicator for currency traders, reflecting the strength of the USD against a basket of major currencies. As of mid-April 2024, here's a concise analysis based on the current market scenario, recent technical patterns observed, and economic events:
Diamond Bottom Formation 💠
The DXY chart suggests the formation of a 'diamond bottom,' typically a bullish reversal pattern that occurs after a price drop. This pattern suggests potential for a reversal of the preceding downtrend, indicating that buyers might be gaining ground.
Current Economic Backdrop 🌐
With geopolitical tensions and hawkish tones from central banks, particularly the Federal Reserve, there is a noted increase in the DXY. Hawkishness from the Fed Chair Powell indicates that rate cuts may not be imminent, reinforcing the USD’s strength.
Technical Levels to Watch 🧐
Resistance Levels: The DXY faces immediate resistance at the 105.38/63 zone. A decisive break above could push it towards 106.57, with 107.17/20 as the next target for bulls.
Support Levels: Initial support lies at the lower parallel/78.6% retracement of the yearly range at 104.53, followed by 104.23. A break below these levels could lead to a correction towards 103.47/49.
Market Sentiment 📊
Market sentiment shows mixed positions among traders in commodities like gold and currencies like EUR/USD, with many investors likely leaning towards safer assets amid uncertainty.
Possible Triggers 🔔
Central Bank Policies: USD bulls are currently facing headwinds from the Fed's stance and upcoming rate decisions.
Global Market Dynamics: Rising geopolitical tensions and market volatility could increase the allure of the USD as a safe-haven asset.
Conclusion: USD's Path Ahead
In the short term, the DXY's outlook hinges on whether support levels hold post-FOMC decisions and broader market sentiment. If geopolitical situations exacerbate or central banks adopt more hawkish policies, the DXY could see further upside. Conversely, a break below key support levels could signal a shift in trend. The situation calls for vigilant monitoring of upcoming economic releases and central bank activities.
🔍 Please Note: This analysis does not constitute financial advice. Investors should conduct their own research or consult a financial advisor before making any investment decisions.
#MarketAnalysis
#TradingView
#TechnicalAnalysis
#DXY
#USDDominance
#Forex
#Commodities
#Gold
#SafeHaven
#EconomicIndicators
#InterestRates
#FederalReserve
#Inflation
#CurrencyTrading
#Investing
#StockMarket
#Bonds
#ETFs
#Cryptocurrency
#BearMarket
#BullMarket
#PriceAction
#ChartPatterns
#DiamondBottom
#MarketSentiment

THE KOG REPORTTHE KOG REPORT:
In last week’s KOG Report, we said traders must be aware of the conditions they’re trading, and markets are moving at extreme levels, we said would be looking for that sudden turn in Gold that may catch traders out. We gave the initial resistance level on the open of 2330-35 where we anticipated the first move down into support, this gave traders an opportunity but it was short lived and only netted us 100pips. The move however, was pinpoint, into support and then the bounce giving the long trade back up level to level. We said a break of that support level is what will be needed for Gold to go down further, otherwise, the reaction from those levels could give the bounce, which is what we got into the region we wanted 2350-55.
During the week, upon breaking the resistance level, we continued with KOG’s bias of the week, looking for the higher levels 2365 and above that 2372, which we completed. Excalibur however had other plans and kept activating long and looking at the move we decided to continue with the move taking longs until Thursday’s close, where we suggested no more longs and gave the levels for the potential turn.
The third level worked a treat, giving traders the opportunity to short the market for a huge move to the downside, which is where we closed for the week. An absolutely fantastic week in Camelot, completing targets not only on Gold, but the numerous other pairs we trade, giving a record breaking pip capture for us since we started sharing our work.
So, what can we expect in the week ahead?
Are we now bearish? That’s the question on everyone’s mind at the moment! Answer, simply, no, not yet! This is a correction, but most likely profit taking at the moment, we still need a complete swing turn here to then start looking for this to target the lower levels we wanted last week, which are sitting around the 2270-50 region. For that reason, we’ll initially want to see how the markets open before taking any positions, there is a chance we will see gaps on open that may again catch some traders out, especially those who entered late session Friday and didn’t protect their trades!
We have the immediate resistance above sitting at the 2355-65 region, if held during the early part of the week, we feel there is an opportunity to short the market back down into the lower support regions, 2330-35 and below that 2310-2295. This is where we want to see the first RIP, and if we get it we feel the long is available into the higher regions where we will only follow Excalibur and hopefully get to carry and trades, if we get them.
Please note, breaking above that higher resistance level of 2365-70 will give us the move to fill that wick and potentially take us into an even higher high, so please be careful if you’re in the wrong way, make sure you act accordingly and have a risk model in place.
On the flip, continuing downside from the open, we suggest traders leave runners on any shorts from above, looking for the levels below 2310 and below that 2290-95 where we feel there may be RIPs, but only temporary, giving traders an opportunity to long the market level to level upside. If we get this move, we will be looking to add short trades and move with the market.
One key thing to note here, if this is a bearish move here, we need more confirmation on it, as institutions don’t usually stop in one day, they tend to continue the move so breaking that lower level of 2290-95 is important. Don’t worry about capturing moves from tops and bottoms, it’s extremely difficult to do unless you have the right guidance and experience in identifying the key levels. The market will always give opportunities, take it at your stride, use the levels provided and make sure you have a risk model in place.
More extreme conditions to come in the week’s ahead!
KOG’s bias for the week:
Bearish below 2365-70 with targets below 2310 and below that 2295
Bullish on break of 2375 with targets above 2425 and above that 2447
Keep an eye on the daily analysis as well as KOG's daily bias which as many traders have seen, work extremely well.
Please do support us by hitting the like button, leaving a comment, and giving us a follow. We’ve been doing this for a long time now providing traders with in-depth free analysis on Gold, so your likes and comments are very much appreciated.
As always, trade safe.
KOG

Nifty Short, Medium & Long Term View- 15-Apr-24 to 19-Apr-24Nifty Short, Medium & Long Term View- 15-Apr-24 to 19-Apr-24
Nifty closed at 22519 (22513) and touched low & high of 22435 & 22782
Nifty touched new high last week and reduced 1 % due to global cues on last day.
Global tension caused mild drop in last working day of market. Depends the situation market will react next week. Expecting a mild fall till 22000 and may raise afterwards.
RSI and stochastics levels was marginally down last week(57% & 71% Respectively).
Refer to detailed comments in the bottom on market and election outcome.
Nifty IT 35018(35250) - Nifty IT marginally decreased last three weeks. To continue hold and buy on dips. Nifty IT touched 20 days before new high (38550) and started falling. Major support at 34918 /34000. Can add more at 33288 with Target 40000.
Nifty bank 48565 (48535) - As expected Nifty Bank increased in the last month gaining near to 6.5%. Nifty touched the near time target provided at 48618 & touched new high of 49063.
Medium term support is at 44598 if breaks major support at 43650 ( Fib Support). To continue buy on dips.
Nifty 22519- Short & medium term (Neutral)
Nifty moved up in the last week touched new high 22782. As mentioned in the past month, nifty almost reached the near term target 22819 (Fibonacci extended resistance ( target) iwhich is the % of difference between Oct21 Peak -Jun22 Low from Oct 21 peak/23000.
Short term support 22000/21900
Medium term Support - 21721 (Mar Low),21554 (Fib Support),21300, 20877 Fib Support as shown in the chart.
Long Term
Market expected range bound between 23300 ( Trend Line Resistance till May 2024) to 20225 / 20000 ( Fib Resistance),19500 expected in 2024.
Q3 results are average except bank & Nbfc stocks, further up move will have target of 23150 ( Trend Line), 23500 ( Fib Resistance). Market Awaiting for the Q4 results to take a cue.
Comments :
Positive Lok Sabha Election result expectation, Global trend helped sustaining the market above 22000.
Recent Electoral bonds, CAA implementation news couldnt make the market down as market is confident that current govt will win more than halfway mark, continue govt post election without any additional support of other parties so that govt can be confident enough to take decisions.
Hence market is in good buy whenever there is a dip. Post Elections, only way Market will start grow higher by reduction of interest rate by RBI on a staggered manner till it reaches 5%. US fed rate reduction also expected from Jun/ Sep 2024. Market may correct if any global news till 19500 as there is strong multiple fib support in this range.
Earlier last 2-3 months, purchasing/holding Nifty IT at lower levels proved effective as the Nifty IT index as it moved up by 20%. Nifty IT posted flat or negative results in Q3. Nifty IT touched new high on 16-Feb-24 (38477). Target 40000.
Similarly despite nifty bank results for Q3 were good as expected, Nifty Bank index was down by 10% last three-Four weeks. Nifty Bank Index was suggested to buy two weeks before. Nifty Bank in nearing the target provided (48600). Nifty Bank Stocks / Bank Index can be purchased whenever it falls down. HDFC bank is now in buyable range, can be further bought if it further dips for Medium to Long Term. Continue to buy on dips.
As expected, stocks other than Banks have posted mixed results. Market can any time expected to turn volatile till elections in 2024 (Apr-May). Company Earning per share (EPS) are near to maximum level, expected policy / budgetary push to move up further in 2024. Individual stock pick will be the key in 2024.
