XAUUSD Bullish Trend - All-Time HighOverview:
XAUUSD (Gold/US Dollar) is currently experiencing a strong bullish trend, marked by consistent upward momentum and robust buying pressure. This bullish sentiment is underscored by the recent attainment of an all-time high price level.
Key Indicators:
Price Action: XAUUSD has been steadily climbing, forming higher highs and higher lows, indicating a clear uptrend.
Moving Averages: Short-term moving averages (e.g., 20-day SMA) are positioned above longer-term ones (e.g., 200-day SMA), signaling bullish momentum.
Volume: Trading volume has been increasing alongside price gains, reflecting heightened investor interest and participation in the market.
MACD: The MACD (Moving Average Convergence Divergence) indicator shows a bullish crossover, with the MACD line rising above the signal line, suggesting upward momentum.
RSI: The Relative Strength Index (RSI) is in the overbought territory, indicating strong buying pressure and potential further upside.
Marketanalysis

📉💡 TOTAL Market Retracement Analysis 💡📉📊 Market Overview:
Recent Movement: The TOTAL cryptocurrency market capitalization has experienced a retracement from approximately $2.6 trillion to $2.35 trillion before rebounding briefly and encountering resistance at the $2.5 trillion level.
Current Trend: Despite the bounce, there's a risk of further downside if the daily support line around $2.35 trillion is breached.
📉 Potential Scenarios:
Breakdown Scenario: If the support at $2.35 trillion is breached:
Downside Targets: Look for potential support zones at $2.10 trillion - $2.20 trillion and $1.80 trillion - $1.90 trillion.
Impact on Altcoins: A market retracement could lead to bearish sentiment for altcoins, potentially resulting in further declines.
Recovery Scenario: If the support holds and the market rebounds:
Upside Potential: Anticipate a potential return to previous levels or higher.
Altcoin Resilience: A successful rebound could stabilize altcoin prices and restore confidence in the market.
💼 Risk Management:
Monitoring Support Levels: Keep a close eye on the $2.35 trillion support level and be prepared to adjust strategies accordingly based on price action.
Managing Positions: Consider implementing risk management strategies such as stop-loss orders to protect against adverse price movements.
Market Sentiment: Stay informed about market sentiment and monitor key indicators for signs of potential trend reversals.
📈💰 Trade Responsibly: Stay cautious and adapt to changing market conditions. Managing risk effectively is crucial in navigating volatile market environments. 📉💡 #TOTAL #MarketAnalysis 🚀📊

S&P still very strong; rally goes onLast week began with bearish consolidation, which was short-lived. The bulls quickly regained control, established a daily higher low, and broke through the previous week's resistance at 524.1 . Although the breakout was not very strong, it was still meaningful. The March close was very strong, posting a +3% gain, and both weekly and daily charts are indicating an uptrend. All major sectors appear strong. The bulls have full control, and the rally is likely to continue.
This week is heavily loaded with economic data releases, which might cause some volatility. However, unless there are major surprises, it should not affect our main thesis.
Important level to watch is 518.4 . As long as it holds, buyers are in control
Disclaimer
I don't give trading or investing advice, just sharing my thoughts.

S&P Sector RotationAll major sectors are strong, confirming SPX strength. There are minor signs of weakness on some charts but nothing serious yet.

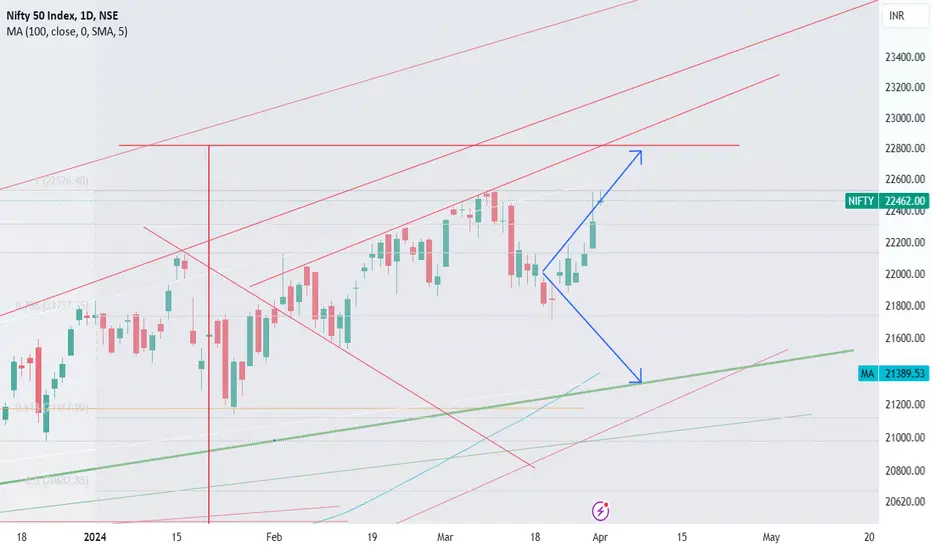
Nifty Short , Medium & Long Term View- 02-Apr-24 to 05-Apr-24Nifty Short, Medium & Long Term View- 02-Apr-24 to 05-Apr-24
Nifty closed at 22462 on 01-Apr-24 (22096 on 22-Mar-24) and touched low & high of 21893 & 22517
RSI and stochastics levels have improved last week (61% & 92% Respectively).
Market was volatile in the month of March and in the end of the month started to increase.
Market touched new high on 01-Apr-24 (22522).
Refer to detailed comments in the bottom on market and election outcome.
Nifty IT 35042 (35188) - Nifty IT marginally decreased. To continue hold and buy on dips. Nifty IT touched 20 days before new high (38550) and started falling. Major support at 34918 /34000. Can add more at 33288 with Target 40000.
Nifty bank 47578 (46863) -To continue buy on dips. As expected Nifty Bank increased in the last 2 weeks. It is nearing the initial Target 48618 (All time high).
support is at 44598 if breaks major support at 43650 ( Fib Support). Purchase on Dips.
Nifty 22462- Short & medium term (Neutral)
Nifty moved up in the last week touched new high 22522. As mentioned for the past three weeks, Fibonacci extended resistance ( target) is near to 22819 which is the % of difference between Oct21 Peak -Jun22 Low from Oct 21 peak. nifty next target 22819 (Fib Resistance)/23000.
Short term Support - 21900, 21721 (Mar Low)
Medium term Support at 21554 (Fib Support),21300, 20877 Fib Support as shown in the chart.20225 (prev high), 20000 ( Fib Resistance)
Long Term
Market expected range bound between 23300 ( Trend Line Resistance till May 2024) to 19500 expected in 2024.
Q3 results are average except bank & Nbfc stocks, further up move will have target of 23150 ( Trend Line), 23500 ( Fib Resistance). Market Awaiting for the Q4 results to take a cue.
Comments :
Positive Lok Sabha Election result expectation, Global trend helped sustaining the market above 22000.
Recent Electoral bonds, CAA implementation news couldnt make the market down as market is confident that current govt will win more than halfway mark, continue govt post election without any additional support of other parties so that govt can be confident enough to take decisions.
Hence market is in good buy whenever there is a dip. Post Elections, only way Market will start grow higher by reduction of interest rate by RBI on a staggered manner till it reaches 5%. US fed rate reduction also expected from Jun/ Sep 2024. Market may correct if any global news till 19500 as there is strong multiple fib support in this range.
Earlier last 2-3 months, purchasing/holding Nifty IT at lower levels proved effective as the Nifty IT index as it moved up by 20%. Nifty IT posted flat or negative results in Q3. Nifty IT touched new high on 16-Feb-24 (38477). Target 40000.
Similarly despite nifty bank results for Q3 were good as expected, Nifty Bank index was down by 10% last three-Four weeks. Nifty Bank Index was suggested to buy two weeks before. Nifty Bank in nearing the target provided (48600). Nifty Bank Stocks / Bank Index can be purchased whenever it falls down. HDFC bank is now in buyable range, can be further bought if it further dips for Medium to Long Term. Continue to buy on dips.
As expected, stocks other than Banks have posted mixed results. Market can any time expected to turn volatile till elections in 2024 (Apr-May). Company Earning per share (EPS) are near to maximum level, expected policy / budgetary push to move up further in 2024. Individual stock pick will be the key in 2024.
THE KOG REPORT THE KOG REPORT:
In last week’s KOG Report we said we would be looking for the support level of 2145-7 to be attempted and if held we felt that region would represent an opportunity to long the market using KOG’s daily bias levels and the levels on the chart. We said we would be looking for 2165-7 and in extension of the move into 2175 which were both completed. We then released the FOMC KOG Report, giving the level of 2180-5 as a RIP region, which gave us a good capture short, and then suggested that the break of 2175 could lead us into extreme levels 2210 which was highlighted. As you can see, the FOMC move tapped into the higher region and slightly higher, before a reaction in price with a huge rejection. We managed to trade the long into key levels, missed the all time high as it was overnight, and then captured a nice short as well. Tracked and traded up and down using our red box strategy, indicator and of course Excalibur.
A great week on not only Gold, but we hit our all time high targets on US30, NAS100 and DAX ending a phenomenal week in Camelot.
So, what can we expect in the week ahead?
It’s the last week of the month and Friday is the last day, so expect there to be some aggressive movement, whipsawing and choppy price action. We can already see profit taking from the highs, what we want to see if they are going to try and retest that high, or as institutions usually do, continue the move in the intended direction.
This week we’re sticking to a similar plan from last week, but hopefully without the extreme movement. We have the higher resistance level now at 2175-80 with extension of 2193-5, which was our bearish below bias level and as long as we stay below this level, if attempted, we will be looking to hold any short trades further down into the 2155, 2150 and below that 2147 regions initially. If the move down continues, we would expect a RIP around the 2135-40 region giving an opportunity to capture the scalps back up. The 2155-50 is the hurdle, if we can flip this level the move down will give us more confidence in lower pricing.
Please note – Breaking above 2175 and holding will flip us again, and we’re likely to go and test that high. It has to be traded day by day at the moment unless you’re holding trades from key levels above or below.
In summary:
Move up into resistance, as long as it holds we’ll look to take this down further into the levels given. Move down, we’ll level to level trade it, holding anything from above and look for bounces for the scalps long. It’s looking like we may see some gaps on opening, so please be careful.
KOG’s Bias for the week:
Bearish below 2175 with targets below 2145
Bullish on break of 2175 with targets above 2183 and above that 2195
Please do support us by hitting the like button, leaving a comment, and giving us a follow. We’ve been doing this for a long time now providing traders with in-depth free analysis on Gold, so your likes and comments are very much appreciated.
As always, trade safe.
KOG

Nifty Short , Medium & Long Term View- 19-Mar-24 to 22-Mar-24Nifty Short , Medium & Long Term View- 19-Mar-24 to 22-Mar-24
Nifty closed at 22023(22493) and touched low & high of 21905 & 22524
RSI and stochastics levels are same in this week (47% & 21% Respectively). Stochastics is in oversold zone.
Market touched a new high last week Monday 22524. RBI issued warning on excessive rally on Mid & Small Cap to control liquidity. Hence Mid & Small Cap corrected last week. Market waiting for to take clear position (to go up or down). Market closed almost flat on first day of this week i.e 18-Mar-24.
Nifty IT 37517 (37099) -To continue hold. Nifty IT touched new high of 38550 20 days before. Major support at 34918 /34000. Target can be 40000.
Nifty bank 46591 (47853) -To continue buy on dips. Nifty Bank last week dipped. initial Target 48618 ( all time high). if it cross this resistance decisively.
support is at 44598 if breaks major support at 43650 ( Fib Support). Purchase on Dips.
Nifty Bank last week high was 47864 and dipped to low to 46316.
Refer to detailed comments in the bottom.
Nifty 22023- Short & medium term (Neutral)
Nifty is undecisive state at present and will be rangebound. As mentioned for the past three weeks, Fibonacci extended resistance ( target) is near to 22819 which is the % of difference between Oct21 Peak -Jun22 Low from Oct 21 peak. nifty next target 22819 (Fib Resistance)/23000.
Short term Support - 21900, 21554 (Fib Support),20877 Fib Support as shown in the chart.
Medium term Support at 20225 (prev high), 20000 ( Fib Resistance)
Long Term
Market expected range bound between 23000 to 18800 expected in 2024.
Q3 results are average except bank & Nbfc stocks, further up move will have target of 23150 ( Trend Line), 23500 ( Fib Resistance).
Comments :
Positive Lok Sabha Election result expectation, Global trend sustaining the market above 22000.
Recent Electoral bonds, CAA implementation news couldnt make the market down. Hence market is in good buy whenever there is a dip. Post Elections, only way Market will start grow higher by reduction of interest rate by RBI on a staggered manner till it reaches 5%. US fed rate reduction also expected from Jun 2024. Market may correct if any global news till 19500 as there is strong multiple fib support.
Earlier last 2-3 months, purchasing/holding Nifty IT at lower levels proved effective as the Nifty IT index as it moved up by 20%. Nifty IT posted flat or negative results in Q3. But to a surprise Nifty IT moved up 4-5% up as US economy is recovering. Nifty IT touched new high on 16-Feb-24 (38477). Target 40000.
Similarly despite nifty bank results for Q3 were good as expected, Nifty Bank index was down by 10% last three-Four weeks. Nifty Bank Index was suggested to buy two weeks before. Nifty Bank Stocks / Bank Index can be purchased whenever it falls down. HDFC bank is now in buyable range, can be further bought if it further dips for Medium to Long Term. Nifty Bank ( 46554) tried to move above key resistances. Continue to buy on dips.
As expected, stocks other than Banks have posted mixed results. Market can any time expected to turn volatile till elections in 2024 (Apr-May). Company Earning per share (EPS) are near to maximum level, expected policy / budgetary push to move up further in 2024. Individual stock pick will be the key in 2024.

Leveraging Pivot Points for Intraday Trading StrategiesIntroduction to Pivot Points:
A pivot point serves as a pivotal indicator in technical analysis, aiding in discerning market trends across various time frames. Essentially, it's an average of the intraday high, low, and closing prices from the previous trading day.
Traders interpret trading above the pivot point as indicative of bullish sentiment and below as bearish.
Key Features:
Pivot points form the foundation of this indicator, from which support and resistance levels
are projected. These levels offer insights into potential price reversals or continuations. It's widely utilized in equities, commodities, and forex markets to identify trend shifts and
reversals.
Traders leverage pivot points to determine entry and exit levels, aiding in strategic decision-
making for intraday trades.
Formulas for Calculation:
The formulas for pivot points involve simple calculations based on the previous day's high, low, and close prices. These calculations yield pivotal support and resistance levels crucial for trade planning.
The Formulas for Pivot Points:
P= High+Low+Close / 3
R1=(P×2)−Low
R2=P+(High−Low)
S1=(P×2)−High
S2=P−(High−Low)
where:
P=Pivot point
R1=Resistance 1
R2=Resistance 2
S1=Support 1
S2=Support 2
Calculation Method:
Pivot points can be manually calculated using the prior day's data, which includes the high, low, and close prices. These levels are essential for traders, especially for intraday strategies.
High indicates the highest price from the prior trading day,
Low indicates the lowest price from the prior trading day, and
Close indicates the closing price from the prior trading day.
Interpreting Pivot Points:
Pivot points provide traders with static support and resistance levels throughout the trading
day. This enables traders to pre-plan their trades based on potential price movements.
Traders utilize pivot points in conjunction with other indicators to enhance their trading
strategies, aiming for more accurate predictions and better risk management.
Comparison with Fibonacci Retracements:
Pivot points and Fibonacci retracements share the common goal of identifying support and
resistance levels. However, pivot points rely on fixed numbers derived from the previous
day's prices, while Fibonacci retracements are based on percentage levels drawn between
significant price points.
Limitations and Considerations:
While pivot points offer valuable insights, they are not foolproof indicators and may not work
for all traders. It's crucial to integrate them within a comprehensive trading plan and
acknowledge their limitations.
Price movements may not always adhere strictly to pivot point levels, requiring traders to
exercise caution and employ additional analysis techniques.
Conclusion:
Pivot points remain a fundamental tool in the arsenal of intraday traders, aiding in trend identification and trade planning. By understanding their calculations, interpreting their implications, and integrating them with other indicators, traders can harness the power of pivot points to make informed trading decisions.
Disclaimer: This trading idea is for educational purposes only and should not be considered as financial advice. Traders are encouraged to conduct thorough research and exercise caution when implementing any trading strategies.

Nifty Short , Medium & Long Term View- 11-Mar-24 to 15-Mar-24Nifty Short , Medium & Long Term View- 11-Mar-24 to 15-Mar-24
Nifty closed at 22493(22378) and touched low & high of 22224 & 22522
RSI and stochastics levels are same in this week (65% & 96% Respectively). Stochastics is in overbought zone.
Market touched a new high on last short trading session on Saturday to 22522, which crossed the Fib resistance and trend line resistance near to 22350. RBI issued warning on excessive rally on Mid & Small Cap to control liquidity. Hence extreme caution need to be applied.
Nifty IT 37099 (37593 ) -To continue hold. Nifty IT touched new high of 38550 15 days before. Major support at 34918 /34000. Target can be 40000.
Nifty bank 47853 (47297) -To continue buy on dips. Nifty Bank touched 48160 high last week and dipped. initial Target 48618 ( all time high). if it cross this resistance decisively.
support is at 44598 if breaks major support at 43650 ( Fib Support). Purchase on Dips.
Refer to detailed comments in the bottom.
Nifty 22493- Short Term (Up) & medium term (Neutral)
As mentioned in for the past two week, Fibonacci extended resistance ( target) is near to 22819 which is the % of difference between Oct21 Peak -Jun22 Low from Oct 21 peak. nifty next target 22819 (Fib Resistance)/23000.
Short term Support - 22116 (MA 21), 21554 (Fib Support ),20877 Fib Support as shown in the chart.
Medium term Support at 20225 (prev high), 20000 ( Fib Resistance)
Nifty Medium Term & long Term - Can buy at 20800 -21000 level in case of dip
Target Fibonacci extended resistance is near to 22819 which is the % of difference between Oct21 Peak -Jun22 Low from Oct 21 peak. nifty will move to next target 22819 (Fib Resistance)/22500.
Support at 20225 (prev high), 20000 ( Fib Resistance)
Long Term
Market expected range bound between 23000 to 18800 expected in 2024.
Q3 results are average except bank & Nbfc stocks, further up move will have target of 23150 ( Trend Line), 23500 ( Fib Resistance).
Comments :
Positive Lok Sabha Election result expectation, Global trend sustaining the market above 22000.
Only way Market will start grow higher by reduction of interest rate by RBI on a staggered manner till it reaches 5%. US fed rate reduction also expected from Jun 2024. Market may correct if any global news till 19500 as there is strong multiple fib support.
Earlier last 2-3 months, purchasing/holding Nifty IT at lower levels proved effective as the Nifty IT index as it moved up by 20%. Nifty IT posted flat or negative results in Q3. But to a surprise Nifty IT moved up 4-5% up as US economy is recovering. Nifty IT touched new high on 16-Feb-24 (38477). Target 40000.
Similarly despite nifty bank results for Q3 were good as expected, Nifty Bank index was down by 10% last three-Four weeks. Nifty Bank Index was suggested to buy two weeks before. Nifty Bank Stocks / Bank Index can be purchased whenever it falls down. HDFC bank is now in buyable range, can be further bought if it further dips for Medium to Long Term. Nifty Bank ( 46554) tried to move above key resistances. Continue to buy on dips.
As expected, stocks other than Banks have posted mixed results. Market can any time expected to turn volatile till elections in 2024 (Apr-May). Company Earning per share (EPS) are near to maximum level, expected policy / budgetary push to move up further in 2024. Individual stock pick will be the key in 2024.

FTT on the Horizon: Market Analysis and ProjectionsTechnical Analysis Overview
Current Price : $3.7605
Weekly Trend : A decrease of 27.10%, indicating recent bearish sentiment.
1-Month Trend : An increase of 8.98%, showing some recovery.
6-Month and Yearly Trends : Impressive growth of 289.95% and 260.09%, respectively, highlighting a strong bullish trend in the medium to long term.
Advanced Technical Indicators
Relative Strength Index (RSI) : Approaching overbought territory, signaling a potential reversal or consolidation in the short term.
Moving Average Convergence Divergence (MACD) : Suggests a bullish crossover, indicating strong buying momentum.
Chart Patterns and Analysis
Bullish Triangle Pattern : Indicating a potential breakout and continuation of the uptrend.
Falling Wedge Patterns : Multiple patterns suggest a diminishing selling pressure and a possible trend reversal.
Unique Insights
Potential for a Major Rally : Analysts have identified key levels for a potential 10x payout, suggesting that FTT might be gearing up for a significant rally.
Impact of External News : News flow and external events, such as regulatory changes or developments within the FTX ecosystem, can have a substantial impact on FTT's price.
Keeping an eye on these factors is crucial for understanding potential market movements.
Market Sentiment and External Factors
Market Capitalization : $1.234B USD.
Trading Volume Analysis : High trading volume of $191.331M USD with a significant volume/market cap ratio.
Recent News Coverage Impacting FTT
FTX Trading and FTX Digital Markets Settlement ( PYMNTS.com ): A unified approach to valuing customer claims could impact FTT's valuation and distribution.
Valuation Rules Set by FTX and Bahamas Liquidators ( Bloomberg.com ): Crucial for determining the valuation of FTT in bankruptcy proceedings.
Unified Asset Distribution Deal ( CryptoSlate ): Streamlining the asset distribution process within the FTX ecosystem.
FTX's Bankruptcy Exit Plan ( Banking Dive ): Involves valuing assets at their November 11, 2022, rate, affecting FTT's value.
FTX's Crypto Asset Liquidation ( Watcher Guru ): The liquidation of $240 million worth of crypto assets, including FTT, could influence its market price.
Conclusion
FTT presents a complex picture with both short-term bearish and long-term bullish trends.
The technical indicators suggest strong buying momentum, but overbought conditions signal caution.
The recent news, particularly the settlement and bankruptcy proceedings, directly impacts the valuation and liquidity of FTT.

XRP/USDT BULLRUSH BEFORE THE FLUSH???Looking at the XRP/USDT Daily Time Frame, we can get an idea where and WHY price is moving the way it is:
We see that ALL previous buyside has been swept.
This should indicate BULLISH order flow.
Every bullrun hits it's breaking point but where will that be???
We see that there's more Buyside that's yet to be swept and I'm thinking it will sweep them soon in the near future.
But WAIT .... There's More!
Right above the highest high, there is a GORGEOUS Daily SIBI resting right above.
Sadly, it hasn't been tapped yet :(
If it gets tapped, will XRP rise or will that be it's Downfall???
There's only one way to find out ;)
I'm patiently waiting for potential opportunities that allow a solid 2:1 RR trade to be taken.
(DISCLAIMER) THIS IS NOT FINANCIAL ADVICE! THIS IS MY PERSONAL OPINION AND I COULD BE 100% INACCURATE IN MY ANALYSIS. DO YOUR OWN RESEARCH AND ANALYZE YOUR OWN CHARTS. TRADING IS EXTREMELY RISKY SO BE CAUTIOUS AND TRADE AT YOUR OWN RISK!!!

Nifty Short , Medium & Long Term View- 04-Mar-24 to 08-Mar-24Nifty Short , Medium & Long Term View- 04-Mar-24 to 08-Mar-24
Nifty closed at 22378 (22212) and touched low & high of 21860 & 22297
RSI and stochastics levels reduced this week (63% & 97% Respectively). Stochastics is in overbought zone.
Market touched a new high on last short trading session on Saturday to 22416, which crossed the Fib resistance and trend line resistance 22350 and closed at 22378.
Nifty IT 37593 (38045 ) -To continue hold. Nifty IT touched new high of 38477 10 days before. Major support at 34918 /34000. Target can be 40000.
Nifty bank 47297 (46554) -To continue buy on dips. Nifty Bank touched 47424 high last week. Target 48618 ( all time high). Crossed the previous resistance and now can expect to move up.
support is at 44598 if breaks major support at 43650 ( Fib Support). Purchase on Dips.
Refer to detailed comments in the bottom.
Nifty 22378- Short Term ( UP) & medium term ( Neutral )
As mentioned in last week Target Fibonacci extended resistance is near to 22819 which is the % of difference between Oct21 Peak -Jun22 Low from Oct 21 peak. nifty will move to next target 22819 (Fib Resistance)/22500.
Short term Support - 21554 (Fib Support ), 20877 Fib Support as shown in the chart.
Medium Support at 20225 (prev high), 20000 ( Fib Resistance)
Nifty Medium Term & long Term - Can buy at 20800 -21000 level in case of dip for a short run up.
Target Fibonacci extended resistance is near to 22819 which is the % of difference between Oct21 Peak -Jun22 Low from Oct 21 peak. nifty will move to next target 22819 (Fib Resistance)/22500.
Support at 20225 (prev high), 20000 ( Fib Resistance)
Long Term
Market expected range bound between 23000 to 18800 expected in 2024.
Q3 results are average except bank & Nbfc stocks, further up move will have target of 23150 ( Trend Line), 23500 ( Fib Resistance).
Comments :
Political anticipated result expectation, Global trend sustaining the market above 22000.
only way Market will start grow higher by reduction of interest rate by RBI on a staggered manner till it reaches 5%. US fed rate reduction also expected from Jun 2024. Market may correct if any global news till 19500 as there is strong multiple fib support.
Earlier last 2-3 months, purchasing/holding Nifty IT at lower levels proved effective as the Nifty IT index as it moved up by 20%. Nifty IT posted flat or negative results in Q3. But to a surprise Nifty IT moved up 4-5% up as US economy is recovering. Nifty IT touched new high on 16-Feb-24 (38477). Target 40000.
Similarly despite nifty bank results for Q3 were good as expected, Nifty Bank index was down by 10% last three-Four weeks. Nifty Bank Index was suggested to buy two weeks before. Nifty Bank Stocks / Bank Index can be purchased whenever it falls down. HDFC bank is now in buyable range, can be further bought if it further dips for Medium to Long Term. Nifty Bank ( 46554) tried to move above key resistances. Continue to buy on dips.
As expected, stocks other than Banks have posted mixed results. Market can any time expected to turn volatile till elections in 2024 (Apr-May). Company Earning per share (EPS) are near to maximum level, expected policy / budgetary push to move up further in 2024. Individual stock pick will be the key in 2024.

BANKNIFTY ANALYSISNo Trading Reversal Zone:
Range: 46,662 to 46,800
Analysis: The market has established a no trading reversal zone in the range of 46,662 to 46,800, suggesting a period of consolidation or indecision. Traders should exercise caution within this range, awaiting clearer signals before making significant trading decisions.
Previous Day High and Open Interest (OI) Resistance:
Previous Day High (PDH): 47,020
OI Resistance Zone: 47,020 to 47,110
Analysis: The PDH at 47,020 serves as a critical level. If the price surpasses this point, it may encounter resistance within the OI resistance zone from 47,020 to 47,110. Traders should closely monitor price action in this area for potential breakout opportunities.
Previous Day Low and OI Support:
Previous Day Low (PDL): 46,350
OI Support Zone: 46,350 to 46,440
Analysis: The PDL at 46,350 acts as a key reference point. If the price approaches this level, it may find support within the OI support zone ranging from 46,350 to 46,440. Traders should observe how the market reacts around this area, as a bounce or breakdown could indicate potential future movements.
Profit Booking Zone for Longs:
Profit Booking Zone: 47,270 to 47,400
Analysis: Traders holding long positions may consider booking profits in the zone from 47,270 to 47,400. This area represents a potential region where bullish momentum could face resistance, and profit-taking becomes a strategic consideration.
Overall Analysis:
The market is currently within the no trading reversal zone, suggesting a lack of clear direction.
Traders should closely watch the PDH, OI resistance zone, PDL, and OI support zone for potential breakout or breakdown signals.
The profit booking zone for longs provides a strategic area for traders to consider securing profits from bullish positions.
Key Takeaways for Traders:
Caution: Exercise caution within the no trading reversal zone and wait for clearer signals.
Breakout/Breakdown Opportunities: Monitor the PDH, OI resistance, PDL, and OI support for potential breakout or breakdown opportunities.
Profit Booking: Traders with long positions may consider booking profits in the specified profit booking zone.
This analysis provides a framework for traders to navigate potential market movements based on historical price levels and open interest data. However, it's crucial to use additional technical indicators, real-time data, and risk management strategies for a comprehensive trading approach. Stay informed about external factors and market news that could impact Bank Nifty's movements.

Nifty Short , Medium & Long Term View-19-Feb-24 to 23-Feb-24Nifty Short , Medium & Long Term View-19-Feb-24 to 23-Feb-24
Nifty closed at 22040 (Last week 21540) and touched low & high of 21629 & 22068
RSI and stochastics levels reduced this week(58% & 87% Respectively). Stochastics is in overbought zone.
Huge volatility was seen last week within the topmost resistance and bottom most support last week. Market was exactly trading within this trend line resistance and trendline support provided.
Market need to decisively close above all time high 22117 and 22157 (Fib Resistance). Earlier 30% profit booking was suggested (except Bank & IT stocks). Partial Booking can be considered for further 5-10% in Mid & Small Cap (Stocks/ Mutual Funds) wherever valuation are high. There is no worry on Good Valued Stocks which can be kept for Long Term.
This cash will be useful to buy when during the fall.
Nifty IT 38477 (Prev Week 37699) -To continue hold. Nifty IT touched new high of 38477 in this week. Major support at 34918 /34000. Target can be 40000.
Nifty bank 46554 ( Prev Week 45634 ) -To continue hold. Nifty Bank touched 46695 high last week. Purchase on dips was suggested. Nifty Bank moved from 44673 to 46695.
support is at 44598 if breaks major support at 43650 ( Fib Support). Purchase on Dips.
Refer to detailed comments in the bottom.
Nifty 22040- Short Term ( Neutral )
All time high 22136 will be a key resistance. Market could not surpass it decisively. Hence bearish sideways movement expected for some more weeks.
Resistances are at 22000, 22117, 22136 ( All time high),22150
Support - 21430 (Fib Support & MA 50 Support), 20877 Fib Support and trend line support as shown in the chart.
Nifty Medium Term & long Term - Can buy at 20800 -21000 level in case of dip for a short run up.
Target Fibonacci extended resistance is near to 22500 as shown in chart. nifty will move to next target 22308 (Fib Resistance)/22521.
Support at 20225 (prev high), 20000 ( Fib Resistance)
Long Term
Market expected range bound between 22500 to 18800 expected till mid of 2024.
Q3 results are average except bank & Nbfc stocks, further up move will have target of 23150 ( Trend Line), 23500 ( Fib Resistance).
Comments (19-Feb-24) :
Earlier last 2-3 months, purchasing/holding Nifty IT at lower levels proved effective as the Nifty IT index as it moved up by 20%. Nifty IT posted flat or negative results in Q3. But to a surprise Nifty IT moved up 4-5% up as US economy is recovering. Nifty IT touched new high on 16-Feb-24 (38477). Target 40000.
Similarly despite nifty bank results for Q3 were good as expected, Nifty Bank index was down by 10% last three-Four weeks. Nifty Bank Index was suggested to buy two weeks before. Nifty Bank Stocks / Bank Index can be purchased whenever it falls down. HDFC bank is now in buyable range, can be further bought if it further dips for Medium to Long Term. Nifty Bank ( 46554) tried to move above key resistances. Continue to buy on dips.
As expected, stocks other than Banks have posted mixed results. Market can any time expected to turn volatile till elections in 2024 (Apr-May). Company Earning per share (EPS) are near to maximum level, expected policy / budgetary push to move up further in 2024. Individual stock pick will be the key in 2024.

Nifty Short , Medium & Long Term View-12-Feb-24 to 16-Feb-24Nifty Short , Medium & Long Term View-12-Feb-24 to 16-Feb-24
Nifty closed at 21782.5 ( Prev Close 21853 ) and touched low & high of 21629 & 22053
RSI and stochastics levels reduced this week( 54.5% & 65% Respectively).
Market is in indecisive state, could not take any direction as it could not surpass the previous all time high 22117 decisively. Earlier 30% profit booking was suggested (except Bank & IT stocks). Mid & Small cap Index fell buy 2.5-3% on 09-Feb-24. Partial Booking can be considered for further 5-10% in Mid & Small Cap (Stocks/ Mutual Funds) wherever valuation are high. There is no worry on Good Valued Stocks which can be kept for Long Term.
Interim budget announced was a status quo budget, no relief for income tax payers, no change in corporate tax, as expected Capex for infra (Railways & Road) increased. Infra Stocks, undervalued bluechip stocks can be considered based on the valuation.
Nifty IT 37699 (Last week 37323 ) -To continue hold. Nifty IT touched new high of 38368 in this week and then came below to 37699. Major support at 34918 /34000.
Nifty bank 45634 (Prev Close 45970) -To continue hold. Nifty Bank touched 44908 and then moved and settled 45634 Low last week. support is at 44598 if breaks major support at 43650 ( Fib Support). Purchase on Dips.
Profit booking upto 30% was suggested in the last 1.5 months, Cash is useful to pick the right stocks currently to pick the right stock. Purchased Nifty Bank at Jan 1st & 2nd week when it was low using that cash.
Refer to detailed comments in the bottom.
Nifty 21782- Short Term ( Neutral - Bearish Continued)-
All time high 22136 will be a key resistance. Market could not surpass it decisively. Hence bearish sideways movement expected for some more weeks.
Resistances are at 22000, 22117, 22136 ( All time high),22150
Support - 21430 (Fib Support & MA 50 Support), 20877 Fib Support and trend line support as shown in the chart.
Nifty Medium Term & long Term (Neutral)- Can buy at 20800 -21000 level in case of dip.
Target Fibonacci extended resistance is near to 22500 as shown in chart. nifty will move to next target 22308 (Fib Resistance)/22521.
Support at 20225 (prev high), 20000 ( Fib Resistance)
Long Term
Market expected range bound between 22500 to 18800 expected till mid of 2024.
Q3 results are average except bank & Nbfc stocks, further up move will have target of 23150 ( Trend Line), 23500 ( Fib Resistance).
Comments (11-Feb-24) :
Earlier last 2-3 months, purchasing/holding Nifty IT at lower levels proved effective as the Nifty IT index as it moved up by 20%. Nifty IT posted flat or negative results in Q3. But to a surprise Nifty IT moved up 4-5% up as US economy is recovering. Last two weeks IT was little down but comparatively lesser than Nifty Index and nifty Bank. Nifty IT touched new high on 08-Feb-24.
Similarly despite nifty bank results for Q3 were good as expected, Nifty Bank index was down by 10% last three-Four weeks. Nifty Bank Index was suggested to buy two weeks before. Nifty Bank Stocks / Bank Index can be purchased whenever it falls down. HDFC bank is now in buyable range, can be further bought if it further dips for Medium to Long Term.
As expected, stocks other than Banks have posted mixed results. Market can any time expected to turn volatile till elections in 2024 (Apr-May). Company Earning per share (EPS) are near to maximum level, expected policy / budgetary push to move up further in 2024. Individual stock pick will be the key in 2024.

AUDUSD Head & Shoulders PatternHi Traders!
A head-and-shoulders pattern is forming on the AUDUSD 1D chart.
Here are the details:
The market has found strong support at the 0.65255 level, which is the neckline. The right shoulder is currently forming, and we expect some consolidation around this level before a possible break and close below the neckline.
The plan here is to monitor both the neckline and right shoulder and wait for a confirmation signal before entry.
Preferred Direction: Sell
Technical Indicators: 20 EMA
Resistance: 0.66048
Support: 0.65255
Please make sure to click on the like/boost button 🚀 as your support greatly helps.
Trade safely and responsibly.
BluetonaFX

ETH: Anticipating Multiple ScenariosFor Ethereum (ETH), there are currently several scenarios in play. The first involves breaking out of the current range, followed by a retest, and a potential move towards the 2352 level. The second scenario envisions a correction to a key trading area, followed by a push towards the 2352 level. Let's take a closer look at these possibilities.

Nifty Short , Medium & Long Term View-05-Feb-24 to 09-Feb-24Nifty Short , Medium & Long Term View-05-Feb-24 to 09-Feb-24
Nifty closed at 21853 ( Prev Close 21353 ) and touched low & high of 21429 & 22126
RSI and stochastics levels ( 58% & 74 % Respectively). Stochastics is near overbought zone.
Market closed all time high and moved higher comparative to last week but is in indecisive state, could not take any direction as it could not surpass the previous all time high 22117 decisively.
Interim budget announced was a status quo budget, no relief for income tax payers, no change in corporate tax, as expected Capex for infra (Railways & Road) increased. Infra Stocks, undervalued bluechip stocks can be considered.
Nifty IT 37323 (Last week 36496) -To continue hold. On the last day (Fri) of last week it was traded upto 1100 points and moved up. major support at 34918 /34000.
Nifty bank 45970( 44866) Moved 1000 points up compared to last week. support is at 44598 if breaks major support at 43650 ( Fib Support). Purchase on Dips.
Profit booking upto 30% was suggested in the last 1.5 months, Cash is useful to pick the right stocks currently to pick the right stock. Purchased Nifty Bank at Jan 1st & 2nd week when it was low using that cash.
Refer to detailed comments in the bottom.
Nifty- Short Term ( Neutral - Bearish Continued)- 21300 ( trend Line support Provided was major support last week.
Resistances are at 21439 ( Fib Resistance), 21639 ( MA 21 days) , 22000, 22117, 22155
Further below to 21300, 20800-21000 have strong Fib Support and trend line support as shown in the chart.
Nifty Medium Term & long Term ( Neutral)- Can buy at 20800 -21000 level in case of dip.
Target Fibonacci extended resistance is near to 22500 as shown in chart. nifty will move to next target 22308 (Fib Resistance)/22521.
Support at 20225 (prev high), 20000 ( Fib Resistance)
Long Term
Market expected range bound between 22500 to 18800 expected till mid of 2024.
Q3 results are average except bank & Nbfc stocks, further up move will have target of 23150 ( Trend Line), 23500 ( Fib Resistance).
Comments (04-Feb-24) :
Earlier last 2-3 months , purchasing/holding Nifty IT at lower levels proved effective as the Nifty IT index as it moved up by 20%. Nifty IT posted flat or negative results in Q3. But to a surprise Nifty IT moved up 4-5% up as US economy is recovering. Last two weeks IT was little down but comparatively lesser than Nifty Index and nifty Bank.
Simillarly despite nifty bank results for Q3 were good as expected, Nifty Bank index was down by 10% last two weeks. Nifty Bank Index was suggested to buy last week. Nifty Bank Stocks / Bank Index can be purchased whenever it falls down. HDFC bank is now in buyable range, can be further bought if it further dips for Medium to Long Term.
As expected, stocks other than Banks have posted mixed results. Market can any time expected to turn volatile till elections in 2024 (Apr-May). Company Earning per share (EPS) are near to maximum level, expected policy / budgetary push to move up further in 2024. Individual stock pick will be the key in 2024.

High positive correlation between gold price and gold stockAs it can be seen in the chart we have a high positive correlation between gold prices and Barrick Gold Corporation as they move together.
Previously as stock prices formed a new high gold price failed to do so and this represents a bearish divergence between prices and caused stock price to move lower sharply while gold price remained roughly around the prices it was.
Now as Gold stock price creates a new low and broke bullish structure to the downside we could expect gold spot price to follow the move and also break the structure to the downside.

USOIL Triangle PatternHi Traders!
A symmetrical triangle is forming on the USOIL 1D chart, and we could have a breakout soon.
Here are the details:
The market has found support and resistance at both the trendline support and trendline resistance of the triangle, as the market is looking for a direction. Looking at the price action, it looks bullish due to the market swings; the lows and highs are starting to get higher, and additionally, the market is above the 20 EMA.
As long as the market is still above the 20 EMA, our view will remain bullish. We expect some more consolidation before a possible third attempt at the trendline resistance.
Preferred Direction: Buy
Technical Indicators: 20 EMA
Resistance: 74.91
Support: 72.13
Please make sure to click on the like/boost button 🚀 as your support greatly helps.
Trade safely and responsibly.
BluetonaFX

GBPUSD Possible Re-Test Of Monthly HighHi Traders!
There is some bullish momentum behind GBPUSD, and there may be a possibility of a re-test of the monthly high.
Here are the details:
The price action on the 1D chart looks bullish. The market is in an ascending price channel with higher market swings and lower rejection price wicks; the market is also currently above the 20 EMA.
Preferred Direction: Buy
Resistance: 1.27858
Support: 1.26612
Technical Indicators: 20 EMA
Please make sure to click on the like/boost button 🚀 as your support greatly helps.
Trade safely and responsibly.
BluetonaFX

📈 AARTIIND: New Year, New Opportunities! Analyzing the UptrendHello traders!
It's great to be back with my first post of the year. Today, let's dive into $NSE:AARTIIND. Here's the breakdown:
📉 Directional Shift: The stock is transitioning from a downward to an upward trajectory, signaling a potential change in trend.
📈 Retesting Support: After reaching its previous peak, AARTIIND is retracing to test the support before gearing up for another upward move.
📊 Chart Analysis: Check out the visual for my entry, exit, and profit target. These are the key levels I'm watching closely.
💹 Derivative Trading Strategy: For derivative traders eyeing January expiry, consider 580 or 600 CE for potential opportunities.
🔄 Dynamic Market: Keep in mind that the market is dynamic, and these are just my observations. Always conduct your analysis before making any trading decisions.
🤔 Your Thoughts: What's your take on AARTIIND? Share your insights and strategies in the comments.
🔗 Stay Connected: Let's navigate these markets together. Stay tuned for more posts and updates!
Happy trading in the new year!
Best regards,
Alpha Trading Station

EURUSD Price RejectionHi Traders!
EURUSD has had double price rejection at the resistance, and there are shorting opportunities near the resistance to target support levels below.
Here are the details:
There is double price rejection at the 1.09986 level, which tells us that bearish demand is currently too strong in this area.
We are looking for a momentum price break and a close below the 20 EMA.
Preferred Direction: Sell
Technical Indicators: 20 EMA
Resistance: 1.09986
Support 1: 1.09102
Support 2 (monthly low): 1.08770
Please make sure to click on the like/boost button 🚀 as your support greatly helps.
Trade safely and responsibly.
BluetonaFX
