NASDAQ analysis (long term)NASDAQ correction has done 37% in almost 407 Days, after knockdown it's continuesly found in DownTrend , now NASDAQ taking support from his crucial level let's see, can it go positive or will do continue to the trend .
Marketanalysis

Trend of the dayTrend of the day. Stock market forecast for 23 Dec.
Test it. Like it. And follow me.

Are we in a financial crisis?We are all asking ourselves the same question, are we in the next big financial crash or is the worst already over?
To answer this question, let's look at the S&P 500 since the beginning.
The S&P has only seen one really big/long correction in its history and that was triggered by the Great Recession in the 1930s and the following Second World War.
Since then, the S&P 500 has only seen one strong uptrend.
If we take a closer look at this uptrend since WWII, we can see very clearly the subordinate waves 12345.
1. impulse wave: recovery after WWII and start of globalisation.
2. correction wave: 1970 recession and oil crisis
3. impulse wave: digitalisation and increased globalisation (EU, China, etc.)
4. Correction wave: dot.com bubble and 2008 financial crisis
5. impulse wave: digitalisation and automation of value chains
The two correction waves were each triggered by major negative economic events.
The individual phases are shown in time in the chart below. A certain temporal correlation can be seen. The upward trends lasted approx. 8700 to 9100 days and the downward trends approx. 3300 days.
Current situation
Currently we are in a strong uptrend that has lasted since 2008 and purely in terms of time has lasted only half the time than the two previous uptrends.
But the economic situation is worse than in 2008 and worse than in the 1970s.
Economic situation
- Extremely high energy costs and production costs weigh on businesses and households
- Interest rate hikes put additional strain on the economy
- The higher interest rates are to remain for the time being in the medium term
- Higher costs mean lower profits
- Lower profits and higher capital costs mean less investments
- Unstable housing market in the USA, Europe and China
- Industry and trade under massive pressure
- Stock market still largely overvalued
- China - Taiwan conflict
- Ukraine - Russia conflict
- Unstable society
- Etc.
All these individual events are having a negative impact on the global economy and together form a perfect foundation for a deeper recession. Many negative effects will only become apparent in the coming months, especially in the companies' key figures.
In previous crises, even minor problems have led to crashes.
Therefore, we are preparing for a falling/stagnating economy in the coming months, even years, which will also have a corresponding impact on the financial markets.
In the current economic situation, to assume that the correction is now over and that we are now testing one high after another again can be very dangerous.
We do not assume that the next few months will only be downward. Every overriding downward trend also has its (major) counter-corrections to the upside.
Therefore, we may also experience months of euphoria and months of stagnation.
Moreover, we do not expect such a strong and prolonged correction as in the 1930s, as sentiment was much worse then than now.
The correction course shown in the chart is only symbolic of a correction.
Pessimism - Realism
We do not represent pessimism here, we represent realism.
We want to encourage you to think about this realistically. In the current crisis landscape we are in, can you imagine that the correction is now over and we will test one high after the other and see an all-time high again in a few months? Especially considering the previous crises, what triggered them and how long they lasted.
We no longer ask ourselves whether the crisis will come, but only how long it will last and how it will proceed in order to use the movements profitably.
Price target of the correction?
The previous corrections (1970s) & (2000 + 2008) were each able to form a bottom between the 0.5 and 0.618 FIB level and start the next uptrend from there.
Projecting this onto the current correction, the price target of the correction would be around $2,500, which can also be confirmed very well on the chart with resistances, trendlines and many other indicators.
However, this is still very difficult to judge in the current situation, as it depends on an enormous number of factors, which are not yet meaningful enough, after all, we are only at the beginning of the correction.
We hope that this article was helpful for you and that you may now look at the current situation from a different perspective.

impact of two important following news on DXYTwo important factors that been driving Dollar prices in last several month as we all know is Federal Funds Rate and Inflation data like CPI.
In this week we have both of them coming out on Tuesday and Wednesday, now we want to see how it can affect the market.
Price usually tend to be at important resistive or supportive areas at the time of important news hit the market and as we can see now price is at supporting area and at the Daily low which probably will remain here until the news hit the market so we can expect of low volatility movement on USD and other major crosses, But what will happen when the news releases?
As we know CPI balance is curving to downside and shows that inflation is cooling down and as we see the prediction of tomorrow CPI news we can see that the market expect this trend to continue. Now here is the tricky part, if CPI data put out like prediction or lower than the prediction this means that fed has the inflation under control which makes trader to believe that federal reserve would not need to raise prices very aggressively like before and as a result we may see a risk on environment in the market which can lead Dollar prices to come lower, but on the other hand SPX, TLT, EUR,JPY and also commodity currencies like AUD,NZD to take benefit from the situation.
But if CPI data comes out higher than expectation then we can argue that federal reserve do not have inflation under control so it needs to continue hiking prices like before and this situation may lead to higher prices for Dollar and lower prices for all the other assets that we covered above.
Also if the second scenario take place tomorrow we can expect USYIELD to continue going higher which have negative effect on US treasury bond and very bad effect on SPX index.
Put CPI analysis apart the other important news that can shake prices real hard is federal reserve which going to hit the market on Wednesday. On that time we can see that what exactly is in the mind of federal reserve and how they are going to impact the economy. In overall, if they raise rate same or below the expectation its going to be very good for risky assets since it shows that we are getting close to end of rate hiking cycle but if federal reserve going for raising rate higher than expectation then it will have a very good impact on Dollar but bad impact on risky assets.

We're at the 200 day. Now What?Good morning. Last week we finished the week in the green even with Powell speaking on Wednesday. And now, we are hanging out at the 200 day. So.... where do we go from here? The charts are telling me to be bullish, but we should remain cautious at this level. The overall big picture makes you sit back and think. We visited the trend line from this years high back in late March and mid August. Both times, we headed lower shortly after. Is this time different? Since October we've had bullish price action and everything is saying to be bullish. But.....the overall long term pattern should not go unrecognized. We're still in a Bear Market.
I wouldn't be surprised if we grind a little bit higher this week but overall, just base here until next week. CPI is due out on the 13th and that's when we could see some action. I have my eyes set on 3600 by the end of the year. Let's see what happens. Either way, be patient, stay disciplined, control your emotions and trade the market in front of you. Happy Trading!


S&P 500 Big Picture - Bearish ScenarioMany investors are already assuming a breakout from the upper trend line and thus a continuation of the uptrend.
The economic sentiment is still bearish, many companies now have to bear the high capital and energy costs and many companies are still highly overvalued.
Therefore, today we would like to introduce you to a bearish scenario that is likely to occur, the Double ZigZag.
Structure of a Double ZigZag
- Superior: (W) - (X) - (Y)
- Subordinate: (ABC) - (ABC) - (ABC)
- Subwaves: (12345 - ABC - 12345) - (ABC) - (12345 - ABC - 12345)
Current situation
If this scenario is correct, we would be in the last sub-wave ABC and now see the last downward movement as sub-wave 12345. This would complete the last subordinate (ABC) wave.
This scenario would be confirmed if in the next few days/weeks the SPX initiates a trend reversal to the downside. We already see a weaker SPX struggling to pump above the yellow highlighted resistance. Even if we could make it above this, it would have to be retested first and thus hold above resistance.
We now expect the SPX to either make another small breakout to the upside before correcting back down, or for the SPX to correct right away.
Strongly changing market
The market is very difficult to assess at the moment. Many economic news are affecting the markets very strongly, new political and economic changes are coming at a record pace and most investors are still afraid to lose money. Thus, this Double ZigZag scenario is one of several possible scenarios. We will post a bullish scenario in the next few days.

Analysis, Set Up and Taking Trade Part 1This Is part 1 on Market Analysis, Waiting for set up and taking trades.
Hope this help.

GBPJPY Pre-Asian Analysis (1st December 2022)GBPJPY Pre-Asian Analysis (1st December 2022)
Summary:
* Downtrend since the start of the week
* Looking for sells below 165.500
Things to look out for:
* Tommorow is last trading date (friday) so plan accordinly to that. Dont over risk and if you had a profitable week only take quality trades tommorow.
* USD Non-Farm, Employement news, alought its USD news sometimes it brings alot of volatility during the time of the news release, plan accordinly

SPX: BREAKING OUT OR BREAKING DOWN?MACRO FACTORS: Given the recent CPI print coming in over 9 in conjunction with a labor market that refuses to slacken, there is little reason to believe that a FED pivot is anywhere on the horizon. It can seem perplexing as to why the FED would continue to hike rates when it doesn't seem to be having the intended deflationary effects at the economic level, but when we consider the amount of fixed rate debt that currently exists in the marketplace and how delayed that latent impact can be on consumers, it’s easier to understand how modifications to base effects can take 3 or 4 quarters before tangibly emerging onto main street.
The above chart is illustrative of a strong labor market and is currently one of the largest impediments towards the Fed’s inflation taming efforts. The top box (JTSJOL) shows the Total Non-Farm Job Openings just beginning to roll over, but not yet below its moving average (green line). We see this as more likely a result of job offers being rescinded than it is of jobs being filled and a potential indication of companies downsizing or reducing the rate of hiring in anticipation of slowed growth expectations over the next few quarters.
The second box (JTSQUR) shows the Total Non-farm Quits. The quits are indicative of job insecurity levels amongst workers. When workers are feeling confident in their ability to get another job, they are more inclined to quit their current job to “trade up”. When workers perceive a negative, future, economic outlook, increased fear of company downsizing can begin to set in. This results in an increased probability of workers feeling less confident about their prospects in the jobs market, which eventually emerges in the Quits rate beginning to trend down. Quits has begun to roll over, but just like the Job Openings, it has yet to cross over its moving average (green line above), indicating it might have some more downside wood to chop in order to properly insatiate Chairman Powell.
SPX 1D: Moving into our S&P500 index analysis, we see price moving into the upper 3rd standard deviation of its downward trending 100-day linear mean indicating the potential for a breakout or breakdown type of market inflection point over the next few days or weeks. The SPX broke YTD, highs on both the DMI and RSI indicators over the course of this week’s rally, giving further credence to the “lows are in” theory and bringing the long dormant bulls out of the closet after months of being driven into hibernation by the high-grading, bears.
Despite these bullish signals it is our opinion that this is nothing more than a "bear market rally/dead-cat bounce" off the recent floor and here's why:
DMI: Our DMI indicator is showing strong positive divergence from the +DI which hit YTD highs, but the ADX differential, which measures the strength of the price move by gauging its potential for impulsivity, is well below the significance level of 25 coming in at 17.4. This translates to significant upward price action with low volume conviction. In other words, a weak move.
VFI: Taking one look at our Volume Flow Index we see that while volume flows have come up over the moving average, flows are a long way from pressing up toward the zero line like they were during the March rally. Given the unlikeliness of the bulls closing the distance on the volume gap, we consider it unlikely that price will be able rise substantially further than it already has without significant volume inflows. Significant volume inflows can be hard for markets to procure in a liquidity tightening cycle such as the one we are in right now.
RSI: While our RSI is not quite at the overbought line of 70, it is the highest reading YTD on a 1 day time frame chart at 65.9, and is well into overbought (above 70) on longer intraday timeframes. Recent history on 4H and 1D times frames has shown price beginning to reject at these levels on the RSI and we don't see this time as being any different barring a pivot from the FED which seems equally unlikely at this point.
MULTI-TIME FRAME MACD: Taking a look at our MACD from a multi time frame perspective starting in the lower left hand corner and moving counter clockwise, we have 1DAY (lower left), 1WEEK (lower right) and 1MONTH (top) time frames.
Starting with our short term, 1 day (1D) time frame in the lower, left box we see we are in a substantial bullish trend with MACD and Signal illustrating strong spread divergence at the mouth. This indicates that there is enough price cushion in the short-term trend for MACD to remain positive even on a small pull back.
Moving to the lower-right box we have the 1-week (1W) time frame which is just beginning to roll over to the upside after printing two positive weeks of tape with the most recent being a YTD high on the MACD histogram which measures the breadth of signal divergence. This rally has been a violent move to the upside, which is commonplace in a liquidity starved market, sensitive to even the slightest upticks in volume inflows.
While the lower time frame MACD charts appear positive, it’s the 1-month MACD indicator, that is most troubling. This is the most significant drawdown on a 1-month MACD indicator in 22 years, including both the 2001 and 2008 financial crisis. While the steepness of the descent-angle is leveling off, the breadth of the divergence at the mouth is gaping. It does not appear that the 1-month MACD indicator is going to be crossing back positive anytime soon.
From a structural perspective we can see that the bulls have their work cut out for them if they want to turn the 100-day linear trend around. Due to the March 2022 high's still propping up the back end of the 100-day linear trend (See horizontal line labeled ‘MARCH RALLY’ above.), the bulls would need an impulsive move to the upside, past the +3SD line at 4217, up to the 4300 price region. At this point price would need to consolidate above the 4100 level for a few days in order to put enough pressure on the 100-day linear mean to begin shattering the trend. A significant breach of the lower EMA Envelope (green tab) at 3899 would substantially increase the probabilities of this recent rally coming to an end. Given the low volume flows, lack of ADX follow through on the DMI and an RSI approaching overbought on the 1day time frame, we see the shattering of the down-trending, 100-day, linear mean as an unlikely outcome over the course of the next week to 10 days.
Solid price architecture is built on strong volume flows that speak to market conviction around directional sentiment. We are not seeing that market conviction from our technical analysis. It is our position that SPX price action will reject at or around the 4217 line (+3SD) within the next week or so. At this point the SPX should begin to take its 5th and final leg of the Elliot Wave Cycle down to the 3652-3311 price range as illustrated on the chart directly above. Buckle up, be agile and stay liquid!
(NOT FINANCIAL ADVICE)

🔥Tip about BTC and The whole C-Market!!●We are at The same spot and same pattern In pretty much whole Market :
_Recently we were trading in The Triangle and It kind of broke down, Now I don't know exactly it's a pullback (IDT) or a false break or whatever, charts acting crazy lately..
▪︎Anyway, we are exactly in The very same Triangle we were couple days ago, and it's for altcoins too you can check.
🟡In The Bitcoin's case, we are right at The very important Trendline too! So If/when price breaks This trendline and The Triangle Together,
BTC having a Real #Pump is Very Likely,
And so The whole Market after It!
📎Just wanted to let you know and Heads up
Good Luck!

Turn and burn? Or 4100?Good morning! Well, the last 4 days we've been in a high base and futures are currently trading lower around 3925ish. Still somewhat basing. Or is it turning over? It already touched the 200 day so now we gotta see if the bulls have any more in them to pierce through it. And that could happen. Last week I had mentioned that the markets like a divided congress. GOP took control of the house. Not by much, but just enough. This could give the markets a reason to celebrate in the short term and could cause the market to pierce through to 4100. That would be like an exhaustion finish or max pain for the bears. With the way these markets have been acting this year, I wouldn't be surprised if that happened. Just remember, we are in a bear market.
Plan for today: I entered in a low risk diagonal call spread on Tuesday with the anticipation that we would run to 4100 by EOW. If the markets turn over, I'll just let that expire worthless and enter in a short position. Ideally, I wanna see this run to 4100 and then get short. So, I'll just have to wait and see the price action these next two days. Be patient, stay disciplined, control your emotions, trade the market in front of you. Happy Trading!


Monday RecapSo a little selling yesterday. But that was expected after Thursday and Friday. Clearly these new levels we're at have many traders scratching their heads trying to figure out what's next. As of yesterday, we had 65% of stocks trading above their 50 day. Charts are telling you to be bullish. But it's more like cautiously bullish. We can probably continue to base here a couple more days before we go test 410. At the time of writing futures are up over 1%. Generally the week before Thanksgiving is a strong up week so let's see what happens this year. Don't predict....react.
Plan for today: Just going to sit on my hands again and wait for a good short entry. Be patient, stay disciplined, control your emotions and trade the market in front of you. Happy Trading!

General US Market Update - HeatmapHeatmap SP500
...looks quite red but is less concerning than one might think. The pullback after the giant gains last week did not come unexpected. Also, the low volume indicated that the big institutions are not in selling mode. All good signals for a continuation of the resumed uptrend.
General Market Update
Stock Market Pauses After 2 Big Days
The stock market wavered Monday, taking a needed pause following the biggest two-day rally since 2008.
The Nasdaq composite was down as much as 1.4% early in the day, but then bounced back. After spending part of the day in the black, the main indexes faded in late trading. The Nasdaq closed with a 1.1% loss. The S&P 500 fell 0.9% and the Dow Jones Industrial Average lost 0.6%.
But selling picked up in the last hour of the session and indexes closed at the day's lows. It was bearish action, although not a surprise.
Stock Market Looks For Leadership
While the major indexes are in confirmed uptrends, investors still need stocks to break out and make gains. In that regard, the picture is still mixed.
The energy sector has been leading the market for much of the year and continues to provide opportunities.
Remember, the bear market destroyed the leadership — much of it in tech — that led the prior bull market. Fresh leadership could take time to develop and prove itself. With the amount of breakouts and bases investors have to work with right now, an exposure level of 20% to 40% seems adequate.

Bitcoin and rest of the market in accumulationHi guys lots of mixed signals going around the market at the moment ,which generally indicates big investors wanting to buy in at a cheap price
as it shows we have already hit the bear market bottom and through some TA and FA we can make a call that our position is long
-RSI has a hit a strong oversold region and is also indicating a strong bullish divergence in the 4 monthly
-Market cap has hit the top of the 2018 market and therefore the bottom cap for the 2022 of 850bil
-Overall volume is indicative of Huge amounts of oversells leaving bears liable for long positions within 4-8 month positions
overall expect all short positions in the next 6 months to get absolutely lit up current volume depth is growing
alt market will be prime for yearly long positions entrys right now with most coins being able to 4-8x within the next bull market.

Is it Time to get Bullish?Man...what a crazy week last week. With the Elections, CPI and the drama with FTX, it was a rollercoaster for sure. The FTX story was something else. But you know, during recessions, entities get exposed. Same thing happened with Enron in the 2000 bubble, the banks in 2008-2009 and now crypto. As the famous Warren Buffett quote says: "A rising tide floats all boats....only when the tide goes out, you discover whos been swimming naked.".
So let's recap a little what happened last week. I've been bearish the last few weeks and I had to be since we are in a bear market. With the Elections, FTX and the CPI report, the market was going to make a decision on the direction and the CPI report was what did it. With the gap up and 7% day on Thursday, it broke out of resistance and the downward trend line. The Dollar got crushed and bonds declined by 7%. That's mostly what fueled the rally. The market has been longing a reason to party because inflation peaked. Did they party to hard Thursday and Friday? Thursday, markets chugged 3 beers.Friday, took a shot of whiskey and said "I'm ready for more next week".
So look, I know inflation is still at 7% and we still need a ways to get down to the Fed's 2% target. It's a tough pill to swallow if you were bearish. But, you gotta trade the markets in front of you. Especially if the charts are telling you to go bullish. Generally the week before Thanksgiving is a good week for the markets, just not sure how much higher we can go this week because the markets used up A LOT of energy Thursday and Friday. It needs to take a break. If the market wants to party the rest of this month, I don't see why it could crawl it's way to 4100 before the next CPI report. One thing to note is tomorrow's PPI report. If this report comes in hotter, everyone who bought last week might step back a little. So if that happens, this would pull back the markets. If it doesn't come in hot, then we might head higher at a slow pace the rest of the month.
Plan for today: Going to sit on my hands today and wait for tomorrow. If PPI comes in hot and we get a big downward reaction in the markets, I'll watch the price action to see if this is a Bull pull back or not. Come Wednesday or Thursday, I'll see if there's a good entry for a bullish position. Be patient, stay disciplined, control your emotions and trade the market in front of you. Happy trading!

S&P500A Buy hold would be a safe bet right now Market was bearing but Because of CPI it reversed which gave the STRONG bullish momentum

ZZZzzzZZZzzz at 3800Good morning! Here we are, Election Day has passed and we get the CPI report tomorrow. Couple things about the Mid Terms. Generally, the markets like it when Democrats have partial control and Republicans partial control. The expectations are, that the Republicans will win the House. If that happens, that could be a good thing for the markets. At the time of writing, Republicans have 199, Democrats 172 and 64 are undecided for the House. Gotta see how that plays out. Because here's the thing. Let's say the Republicans take the House and the Democrats keep the Senate, the markets might actually like that. And with Big Tech taking a beating after all these earning announcements, they're low enough to bid on and that could push the markets higher. Whoever that dude at Morgan Stanley was last week, saying that we could see 4000 or 4100 in the near term, might actually be right if it plays out this way.
But remember, longer term, we have significant headwinds and this is still a Bear Market. CPI report is accumulative, like a moving average. If you add up all the monthly CPI numbers, it gives you the annualized CPI. It's going to stay high because at the beginning of this year, we were seeing CPI numbers at about 1%. So when we add all these monthly's up, we're going to get a high number. Obviously, over time, this will come down. Which is why expectations are to get to 4% by early Q2 or abouts. So, if the Republicans' don't take the House, and the CPI report is hot. What does that mean for the markets? Well, we could head back down starting tomorrow or Friday. Either way, these are two possible outcomes that could play out.
Plan for the Day: We're technically still in No Man's Land but with a slightly more Bullish lean right now. IF I decide to chase this up to 4000, or 4100, I will do so cautiously and wait for an exhausting point in the rally. We might just hang out here at 3800 today until all the results come in and then tomorrow we could see the true direction. I'll sit on my hands again and just watch the market. Be patient, stay disciplined and trade the market in front of you. Happy Trading!

Fed WeekGood morning! Batteries are recharged for this week, as we have a very important day on Wednesday. THE FED SPEAKS. Not gonna lie, but Friday's action caught me off guard. As I watched the action, I still wasn't convinced. It still had the feeling of a hope rally. Now look, we can still push to about 3970ish to complete the ABC correction before rolling over. And did you see the VIX? JUst got crushed all the way back to 26 maybe even 25 at one point. Still too many mixed signals in the market with the DOW up almost 15% for the month, the NASDAQ showing more of a Bearish Chart set up and the S&P looking like it's ready to follow the DOW.
So is this rally going to hold tech up? It's looking that way, but the FED can change all of that come Wednesday. 3900 is a key area of resistance so I wouldn't be surprised if we got some sideways movement the next two days before we see any real price action. Tomorrow might be interesting for the JOLTS Report. Why? Well the FED said in their last announcement that they wanted this number to come in lower. Forecast is somewhere around 9.5 million. So if tomorrow we see this number come in lower. Say, 9 million, it could be off to the races and continue higher. But at the end of the day, everyone is still going to want to hear from the FED. Will they admit the economy is slowing? I'm sure they will and the market is going to like that they acknowledge it. But is it enough?
Remember that you get three moves on FED Days. You'll have the initial move, the retracement, then you'll see the direction of the market. So my plan is to just wait for Wednesday to determine if I should go bullish or stay bearish. I still think there are too many uncertainties and the FED will continue its efforts to bring inflation down even more. Either way, it doesn't matter. I need to trade the markets in front of me. Happy trading!

DXY Possible movesSince DXY is governing what happens in all other markets, I think that it is worth a deep analysis, and this is what I expect for DXY in the coming days/weeks.
If this scenario plays out like this, then we can do basically the opposite for crypto and stocks. Sell crypto and stocks when DXY is going up and buy crypto and stocks when DXY in a downtrend.

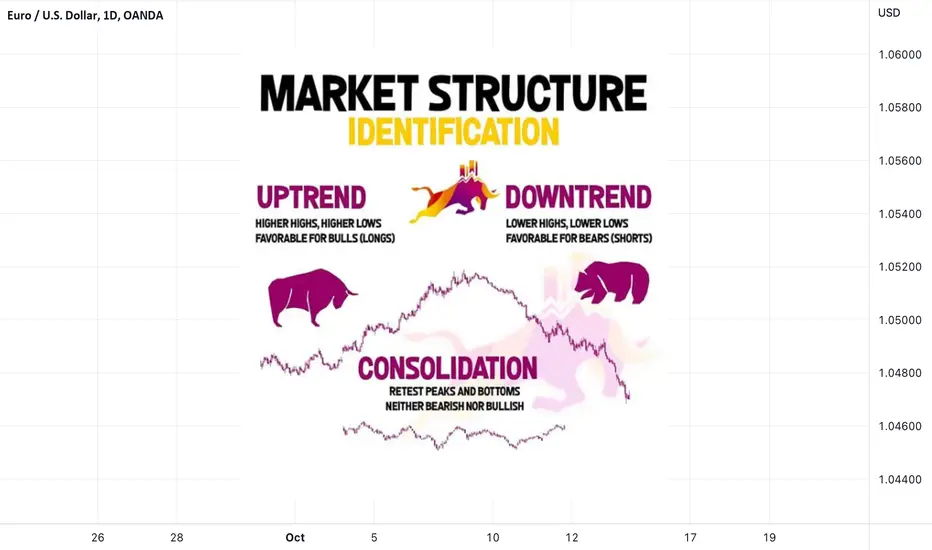
Market Structure Identification ✅Hello traders!
✅ MARKET STRUCUTURE .
Today we will talk about market structure in the financial markets, market structure is basically the understading where the institutional traders/investors are positioned are they short or long on certain financial asset, it is very important to be positioned your trading opportunities with the trend as the saying says trend is your friend follow the trend when you are taking trades that are alligned with the strucutre you have a better probability of them closing in profit.
✅ Types of Market Structure
Bearish Market Structure - institutions are positioned LONG, look only to enter long/buy trades, we are spotingt the bullish market strucutre if price is making higher highs (hh) and higher lows (hl)
Bullish Market Structure - institutions are positioned SHORT, look only to enter short/sell trades, we are spoting the bearish market strucutre when price is making lower highs (lh) and lower lows (ll)
Range Market Structure - the volumes on short/long trades are equall instiutions dont have a clear direction we are spoting this strucutre if we see price making equal highs and equal lows and is accumulating .
I hope I was clear enough so you can understand this very important trading concept, remember its not in the number its in the quality of the trades and to have a better quality try to allign every trading idea with the actual strucutre