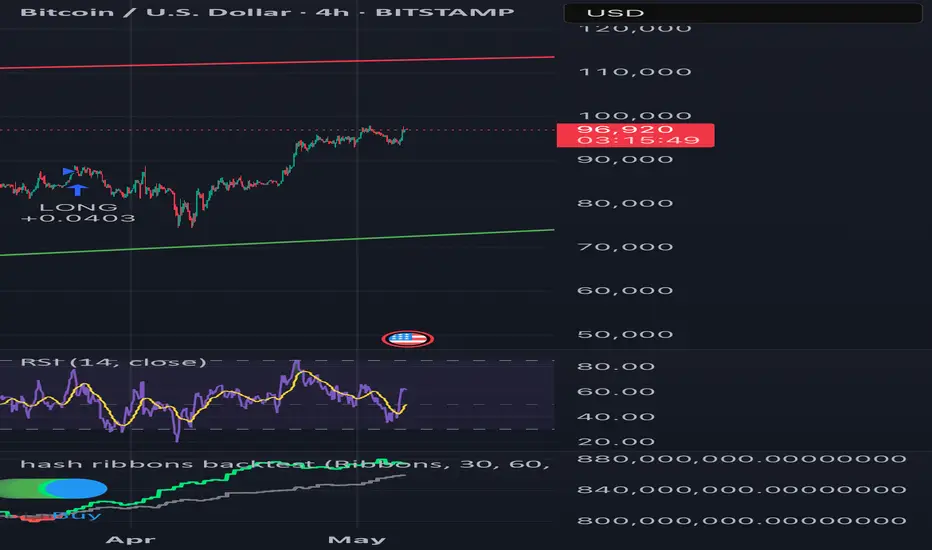
Market Overview (May 7, 2025)📊 Key Metrics
1. Funding Rate: ~0.018% (on Binance)
— positive rate indicates long position dominance and bullish sentiment
2. Open Interest (OI): GETTEX:29B , up ~ SEED_TVCODER77_ETHBTCDATA:7B in recent days
— rising OI suggests new positions are opening, increasing volatility risk
3. ETF Inflows: +$420.9M (May 6)
— strong institutional demand, especially into BlackRock’s IBIT
4. Fear & Greed Index: 67 (Greed)
— rising greed may signal potential for a short-term correction
⸻
📈 Market Movement Probability
• Upward: 60%
(supported by ETF inflows and positive funding)
• Downward: 40%
(high greed and rising OI could trigger a correction)
⸻
Disclaimer: This is not financial advice. Always do your own research.
Marketanalysis
Market Overview (May 5, 2025)
📊 Key Metrics
1. Funding Rate: -0.0024% (on Binance)
— traders are paying to hold short positions, signaling bearish pressure
2. Open Interest (OI): $27.5B, down –3.13% in 24h
— positions are closing, possibly due to liquidations or profit-taking
3. ETF Inflows: +$674.9M (on May 2)
— strong institutional demand, especially into BlackRock’s IBIT
4. Fear & Greed Index: 52 (Neutral)
— sentiment has stabilized after a period of greed
⸻
📈 Market Movement Probability
• Upward: 55%
(potential short squeeze fueled by ETF inflows)
• Downward: 45%
(OI is dropping, market losing momentum)
⸻
Disclaimer: This information is not financial advice and should not be used as the sole basis for investment decisions.

CAD JPY Entry Setup 1 hour timeframe CAD JPY Entry Setup
Bearish break and retest
Candlestick confirmation: Doji and clow below
Risk to Reward: 1:3

EUR USD Trade Setup 4 hour timeframe EUR USD has formed a Head and shoulders Pattern on the 4 hour timeframe
the market has been very choppy on the lower timeframe only the higher timeframe can show direction.

AR Trade Setup – Watching for Market Structure ShiftAR is showing early signs of strength after defending the $5 key level a crucial support that bulls needed to hold. Now, the focus is on a potential shift in market structure around $6, which could lead to a strong upside move.
📍 Entry Zone:
Enter around $6 after confirmation (e.g., reclaim with strong volume or bullish candle close)
🎯 Take Profit Targets:
🥇 $12
🥈 $16
🥉 $22
🛑 Stop Loss:
Below $5

EURUSD Monthly Timeframe Potential Impulsive DownwaveEvery correction starts with an impulsive wave, followed by a corrective wave and ends with an impulsive wave. Here in EURUSD, a potential corrective wave has potentially completed and getting ready for another impulsive downwave.

AI Sector Watch – TAO Pullback OpportunityAI-related tokens are showing real strength lately, and TAO has led the charge with a series of green candles. However, the most recent candle suggests potential for a cool-off into support—which could form a higher low and provide a great entry opportunity.
📍 Entry Zone:
$279 (potential higher low formation)
🎯 Take Profit Targets:
🥇 $292
🥈 $317
🛑 Stop Loss:
Below $260 (look for daily close confirmation)
📊 Notes:
If price consolidates above $279 and bounces, it confirms strength.
Watch for volume drop during the pullback—bulls want a light retrace before resuming higher.
If TAO breaks and holds above $292 quickly, you may want to trail your stop.

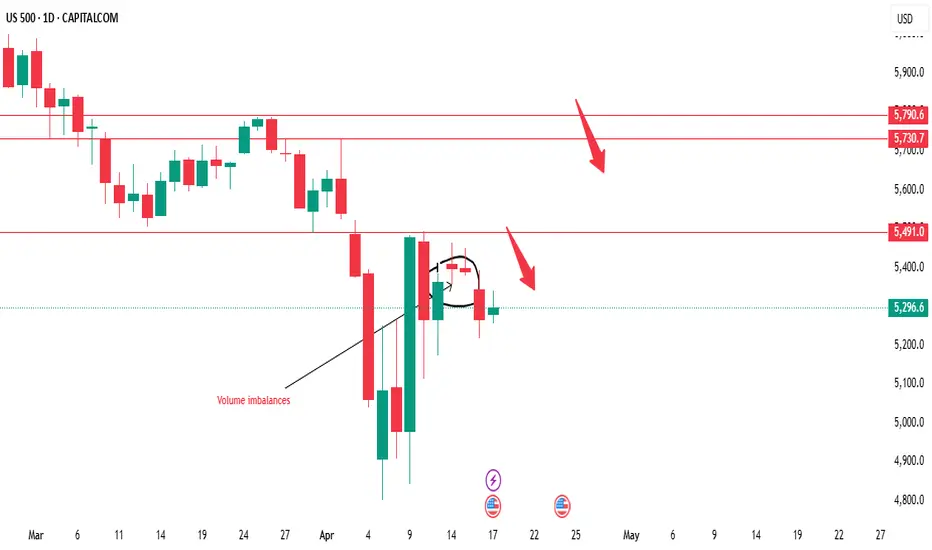
US500's performance this week will be crucial in determiningUS500 Weekly Analysis
The US500 index is currently exhibiting bearish tendencies, but a crucial level to monitor is $5491. This level has the potential to act as a resistance point, and we're looking for a possible selling opportunity around this area. However, if the market breaks above $5491, it could signal a shift in bias towards bullish territory, potentially leading to a significant upward move.
Key Levels to Watch:
1. Sell Zone: $5491 - This level is critical in determining the next move. We'll be watching for confirmation to sell, such as bearish candlestick patterns or trend indicators.
2. Resistance Area: $5730 - $5790 - A strong resistance zone that could potentially cap upward movements.
Trading Strategy:
1. Wait for Confirmation: We'll wait for the market to reach the $5491 level and look for confirmation to sell. This could include bearish candlestick patterns, trend indicators, or other technical signals.
2. Breakout Scenario: If the market breaks above $5491, we'll reassess the bullish potential and look for opportunities to buy.
3. Risk Management: It's essential to manage risk effectively, setting stop-losses and take-profits according to our trading plan.
Market Outlook:
The US500's performance this week will be crucial in determining the next direction. We'll be monitoring the market closely, analyzing price action, and providing updates on any developments. Stay tuned for our analysis and guidance on potential trading opportunities.
By keeping a close eye on these key levels and waiting for confirmation, we can make more informed trading decisions and navigate the markets effectively.
Markets next move will depend on its interaction with Key LevelsGold Analysis
MSS & FVG+Breaker Zone
Gold has given an MSS (Market Structure Shift) and touched the FVG+Breaker Zone, followed by a downward move. Given the current market structure, potential areas to watch for a stop and potential upside pump could be:
Possible Downside Targets:
1. $3321 liquidity level
2. Higher Time Frame (HTF) PD Arrays
Potential Upside Pump
If the market reaches these areas, we might see a pump upwards, driven by liquidity and market structure.
Key Levels to Watch:
- $3321 liquidity level
- HTF PD Arrays
Market Direction
The market's next move will depend on its interaction with these key levels. A potential bounce from these areas could signal an upside pump.
Let's monitor the market's movement and adjust our analysis accordingly.

GBPAUD market outlookFX:GBPAUD
Price has reached and reacted off significant level of resistance zone at 2.16400, which was last seen on the 2nd of November 2015. On Friday's NY open, price created a false bullish signal with a 190 pips pin bar candle on the H1 chart. Instead, price reacted off its recent swap zone and continued its downtrend. If it breaks below 2.07720, we can anticipate a short-term continuous downtrend to the daily demand range, which is about 200 to 300 pip movement.
On the fundamentals, the Aussie dollar has recently hit a 5 year low against the USD, trading at just 60.5 US cents as the two world's largest economies have been ramping up tariffs to as high as 125%. The AUD may be impacted due to China being Australia's biggest trading partner and the trade war is only increasing uncertainty risks. On the bright side, the ASX 200 surged by 4.5% on a single day as Trump announces tariff pause, which was the highest increase in value on a single day ever since the pandemic in 2020. Both the UK and Australia have been imposed the same reciprocal tariff rates of 10%, for now, I expect a short-term downtrend before its continuation upwards, but we'll see what the coming week brings to us.

Gold (XAU/USD) Breaks Ascending Channel – Bearish Move Ahead?📉 Market Structure:
Gold was moving in an ascending channel, but price has now broken below the support trendline.
This suggests a possible trend reversal or correction.
📌 Key Levels:
Resistance : $3,125 - $3,170
Support: $3,054 - $3,035
Target: $3,000 - $2,995
📊 Trade Idea:
A pullback to support-turned-resistance could give a short entry.
Bearish target: $3,000 if rejection holds.
Invalidation: If price reclaims $3,125.
🔍 Watch for:
Price reaction at the former channel support.
Possible retest before further drop.
Let me know if you need any modifications! 🚀

Altcoin Recovery Depends on This USDT Dominance BreakAltcoins have taken a heavy hit — many are down 60–80% from their highs.
As seen in the USDT Dominance chart, we're still respecting the rising trendline. Until this trend breaks to the downside, pressure on altcoins may continue.
Key Zone to Watch:
Once USDT.D breaks below that rising support line and sustains a move lower, we could witness a strong recovery phase across the altcoin market. That shift will likely signal renewed confidence and capital rotation into risk-on assets.
Stay patient: The breakout is brewing. When that trendline cracks, altseason could ignite fast.
Keep your watchlists ready. The reversal will reward the prepared. 🚀
Like and drop a comment if you found our analysis helpful — your support keeps us going!

AUD/CAD – Potential Bullish Reversal from Key Support📊 Chart Analysis
1️⃣ Accumulation Zone : The price previously traded within a rectangular consolidation range before breaking down.
2️⃣ Bullish Reversal Pattern : A falling wedge has formed, indicating a possible breakout to the upside.
3️⃣ Key Support : The price has tested the 0.8980 - 0.8970 zone multiple times and is showing signs of rejection.
4️⃣ Potential Upside : A breakout above 0.9030 - 0.9050 could confirm further bullish momentum.
🚀 Trading Plan:
📌 Entry : On a breakout above 0.9025
🎯 Targets :
First target : 0.9100
Extended target : 0.9130
🛑 Stop Loss : Below 0.8965 to minimize risk.
🔔 Confirmation Needed: Wait for strong bullish price action before entering long trades. 🚀🔥

EUR/USD Chart Analysis - Bearish Breakdown Towards Target📉 Pattern & Market Structure:
The chart shows an ascending channel that was previously supporting price action. However, the price has broken below the lower trendline, confirming a bearish breakdown.
The recent price action suggests a shift from bullish momentum to bearish sentiment.
📉 Price Action & Target:
A breakdown from the channel suggests further downside movement.
The price is currently around 1.07556, with a potential target of 1.05089 based on the measured move from the broken channel.
This target aligns with a key support level.
📌 Trading Plan:
Bears may look for sell opportunities below 1.07602.
Confirmation of further downside can be seen if the price stays below previous support-turned-resistance levels.
Bulls might wait for a potential reversal near the target zone.
⚠️ Risk Management:
Watch for pullbacks or retests of the broken support before entering a short position.
A break back above 1.08765 could invalidate the bearish setup.

USD/JPY Bullish Reversal (Inverse Head & Shoulders)📌 Pattern: Inverse Head & Shoulders
📌 Analysis: The chart showcases an inverse head and shoulders pattern, a classic bullish reversal formation. The price has successfully broken out of the downward trendline, indicating potential upside movement.
🔹 Left Shoulder: Formed during the previous retracement.
🔹 Head: The lowest point of the pattern, marking strong support.
🔹 Right Shoulder: Completed with a breakout above resistance.
📈 Trading Plan:
✅ Entry (Buy): After a confirmed breakout and possible retest.
🎯 Target: 153.988 - 154.672 (2.74% potential gain).
🔻 Support: 149.883 - 148.837 (Stops should be placed accordingly).
📊 Conclusion:
If the price maintains above the breakout level, we may see a strong rally toward the resistance target. Watch for volume confirmation and pullback retests before entering a trade.

Nasdaq in Correction: Technical Targets and Weekly OutlookWe can observe that Nasdaq has started a new corrective leg since its last recovery in early Q3 2024. Currently, the index is experiencing its first rebound and test of the 20-period moving average (MA20, in green) since this average turned downward. Typically, this scenario triggers a selling reaction, with the first target at the previous low of 19,200. If selling pressure intensifies, the next projections are at 18,300 and 17,900.
However, from a weekly perspective, there is still room for a deeper correction, potentially reaching the 200-period moving average (MA200), which is currently at 15,690. When applying a Fibonacci retracement to the last major bullish leg (Oct 10, 2022 – Feb 17, 2025), we see that the 50% retracement level aligns closely with the weekly MA200 at 16,300.
We know that price movements do not follow a straight line but rather unfold in waves. Given this context, the bias remains bearish, and I see further corrections ahead in the U.S. market.

Gold/EUR Analysis –Bearish Continuation from Channel Resistance📉
Market Structure & Trend
The chart represents a descending channel where price has continuously rejected from the upper boundary.
Multiple lower highs and lower lows indicate a bearish trend.
Gold/EUR has once again reached the channel resistance and failed to break above, suggesting a strong sell opportunity.
Key Technical Levels
🔴 Resistance:
2,809 - Local resistance where price has faced rejection multiple times.
2,849 - Major resistance level, a break above this could invalidate the bearish outlook.
🟢 Support & Target Levels:
2,790 - Short-term support; if broken, further downside is expected.
2,740 - First key target where previous demand is present.
2,660 - Major support and final bearish target if selling pressure continues.
Trade Setup & Strategy
📍 Sell Below: 2,790
🎯 Target 1: 2,740
🎯 Target 2: 2,660
❌ Stop-Loss: Above 2,810
Conclusion
Bearish bias remains strong as long as price stays below 2,809.
A breakdown below 2,790 could accelerate selling pressure.
Traders can look for bearish confirmation signals (e.g., break of structure, candlestick patterns) to enter short positions.
Would you like a refined strategy based on lower timeframes?

GBP/USD Breakdown – Support Under Pressure, Bearish Target AheadChart Analysis:
The GBP/USD pair is currently trading around 1.29578, facing resistance near 1.30366.
A support zone has been identified around 1.29000, which the price is testing.
If this support level breaks, we could see a bearish move toward the next target near 1.26970.
Strong support is positioned lower, which may act as a key reversal point if the decline continues.
Trading Outlook:
Bearish Scenario: If the price breaks below the current support, a drop toward 1.26970 seems likely.
Bullish Scenario: If GBP/USD holds above support, we may see a retest of resistance at 1.30366.
Conclusion:
Traders should watch for a confirmed breakout or rejection at support before taking positions. A clean break below could trigger a stronger bearish move. 🚨

(XAU/USD) Sell Setup |Bearish Move Expected Towards Key SupportAnalysis:
The price has experienced a strong uptrend but is now showing signs of resistance near the 3,054.161 level.
A support level is identified around 3,000, which has been tested multiple times.
A potential sell setup is indicated after the price retested a resistance-turned-support zone around 3,027.737.
The target for the downside move is marked at 2,942.844, aligning with a previous support level.
If bearish momentum continues, a further decline toward 2,915.859 is possible.
Trading Idea:
Sell Entry: Around 3,027-3,030 after confirmation of rejection.
Stop Loss: Above 3,054 (recent resistance).
Take Profit Targets:
TP1: 2,942
TP2: 2,915
Market Sentiment:
The price is reacting to key levels, and if it breaks below 3,000, it could accelerate the bearish move.
A break above 3,054 would invalidate the short setup and could push the price higher.

GBP/USD Technical Analysis – Potential Bearish MoveThis 4-hour GBP/USD chart indicates a potential bearish setup. Price has been trading within a range, with resistance around 1.30366 and support near 1.29467.
The price recently retested the support zone, showing signs of weakness.
If the support level fails to hold, a breakdown could push the price towards the 1.27035 target.
A stronger support level is observed further below, around 1.2600, which could act as a key demand zone.
Traders should monitor the price action near the support zone. A clear rejection could signal a potential buy opportunity, while a confirmed breakdown could validate a short trade targeting lower levels.
Key Levels:
🔹 Resistance: 1.30366
🔹 Support: 1.29467
🔹 Target: 1.27035
Would you like any modifications to the analysis? 🚀

GBP/USD Breaks Rising Channel – Bearish Target Ahead!Key Observations:
Rising Channel: The price was trading within an ascending channel, bouncing between resistance and support.
Breakout & Sell Signal: The price has broken below the channel support, indicating a potential trend reversal.
Bearish Target: The next key support level is around 1.27024, aligning with a previous demand zone.
Confirmation: If the price stays below 1.29165, further downside movement is likely.
Trading Idea:
Short Entry: After confirmation of a breakdown below support.
Target: 1.27024 (next major support level).
Stop Loss: Above 1.30127 (previous resistance).
This setup suggests bearish momentum as long as the price remains below the broken support. Traders should watch for retests and volume confirmation.

Gold (XAU/USD) on a 4-hour timeframe, showing a potential short Chart Analysis:
Current Price: $3,039.93
Resistance Level: $3,055.47 (marked as a key level where a sell opportunity is identified).
Target Level: $3,000.73 (suggested as the take-profit area).
Support Zone: Highlighted around $2,900.
Trading Idea:
The price is in an uptrend, but a potential reversal is expected at the $3,055.47 resistance level.
If the price fails to break above this resistance, a short position could be considered.
Entry Strategy: Sell near $3,055.47 upon confirmation of rejection.
Target: A drop towards $3,000.73.
Stop Loss: Above the resistance zone to manage risk.
Conclusion:
This is a counter-trend short setup, aiming for a pullback within the broader bullish trend. Traders should monitor price action near resistance before entering a trade.

CHF/USD Trading Idea – Bearish Reversal from Key ResistanceThis CHF/USD chart presents a compelling bearish setup, suggesting that the pair may be headed for a decline after facing strong resistance. The price action has followed a technical breakout and retest pattern, with a clear rejection from a well-defined resistance level.
Traders looking for short-selling opportunities should take note of the key price zones, support levels, and overall market structure before making a move. Let’s break it down in detail.
🔍 Chart Breakdown: What’s Happening?
1️⃣ Falling Wedge Breakout & Bullish Push
The price was consolidating inside a falling wedge, a pattern that typically signals an eventual breakout to the upside.
The breakout led to a strong bullish move, pushing the price toward a well-established resistance zone around 1.1414.
After breaking out, the pair made a significant upward run before stalling at this key resistance.
2️⃣ Key Resistance Level Holding Strong
The price touched the resistance zone but failed to break above it.
This rejection indicates that sellers are stepping in, absorbing the buying pressure.
The market is showing early signs of bearish momentum, hinting at a potential downtrend.
3️⃣ Projected Bearish Move: Lower Targets in Sight
If the current rejection holds, the price is likely to fall toward the nearest support levels:
✅ TP 1 (Take Profit 1): 1.1271 → First major support level, likely to be tested soon.
✅ TP 2 (Take Profit 2): 1.1201 → A deeper retracement if selling pressure increases.
✅ TP 3 (Take Profit 3): 1.1055 → Final downside target if the bearish trend extends further.
4️⃣ Stop Loss Placement – Risk Management
To manage risk, the ideal stop loss should be placed slightly above the resistance level at 1.1414.
This protects against potential false breakouts and unexpected market shifts.
📉 Trade Strategy – How to Approach This Setup?
🔸 Entry Point: Look for a confirmed rejection of the resistance level (e.g., bearish candlestick patterns like engulfing, shooting star, or pin bars).
🔸 Stop Loss: Place above 1.1414 to avoid getting caught in a short squeeze.
🔸 Take Profit Targets:
First TP at 1.1271
Second TP at 1.1201
Final TP at 1.1055 for extended downside moves
⚠️ Important Notes for Traders:
✔ Wait for Confirmation: Don’t rush into a short trade. Look for a strong bearish candle closure or a retest before entering.
✔ Be Aware of News Events: Economic releases, interest rate decisions, and major USD-related news can impact price movement.
✔ Monitor Market Sentiment: If USD strengthens, this setup is even more likely to play out.
🧐 Final Thoughts – High Probability Short Setup?
✅ Why This Trade Looks Strong:
The technical pattern is playing out perfectly, with a clear resistance rejection.
The risk-to-reward ratio is favorable, with well-defined entry, stop loss, and take profit levels.
The overall market structure supports a potential downside move if price continues respecting resistance.
📢 Bottom Line : If price remains below the 1.1414 resistance, this trade setup could provide an excellent opportunity for short-sellers targeting lower support levels. 🚀 Stay patient and wait for confirmation before pulling the trigger!
