KAVA-The beginning of the uptrend with targets of $ 20Wave 1 is finished around $ 5.38, and its corrective movement is completed around $ 1.12 level. The price is in the sub- waves of wave 3, in this uptrend, the 3rd wave can be extended up to the target level of $ 20 .
Marketanalysis

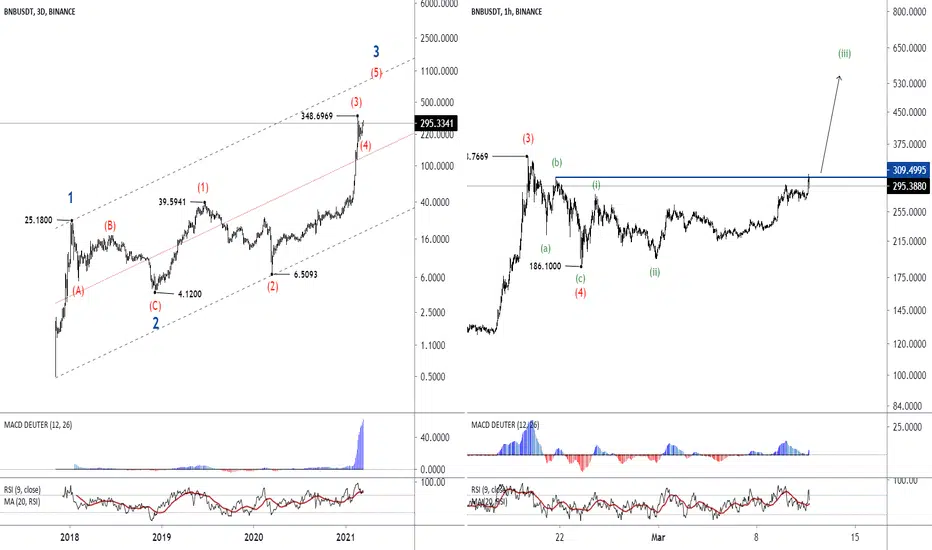
The end of Wave 4 at $ 186 rangeThe end of Wave 4 at $ 186 range, and the beginning of the uptrend and heading to the target of $ 850
In the 3-day chart, and according to the wave count, wave 3 from point 3 has been completed in the range of $ 348, also the corrective movement, which is a short retracement, has been completed in the range of $ 186. According to the drawn uptrend line, the targets of this uptrend can be in the range of $ 850 to $ 1,000.
one-hour chart, and the wave count of wave 4 shows, that by crossing the price from the range of $ 309, which is the end of wave b, we can receive the confirmation for the uptrend.
Gold - Double Zigzag pattern
In the daily chart, Wave III has been completed in the range of $ 2075, and its corrective wave is in the form of a Double zigzag pattern, in which the downtrend can be extended up to the range of $ 1650.
(Daily Chart )
In the 240-minute chart, the diagonal pattern has formed, which by wave counting the details, this pattern is at the end of wave iii from point C, which is finished around $ 1676. Currently the price is in wave iv, in which the uptrend can be extended up to the range of $ 1750 (in the form of 3 waves)
If the price drags above the downtrend line and stabilized with 5 uptrend waves, the IV wave will probably end in the range of $ 1676.
By monitoring the details of gold charts in the daily and 240 minutes time frames, we can conclude a downtrend can be extended up to the range of $ 1650.

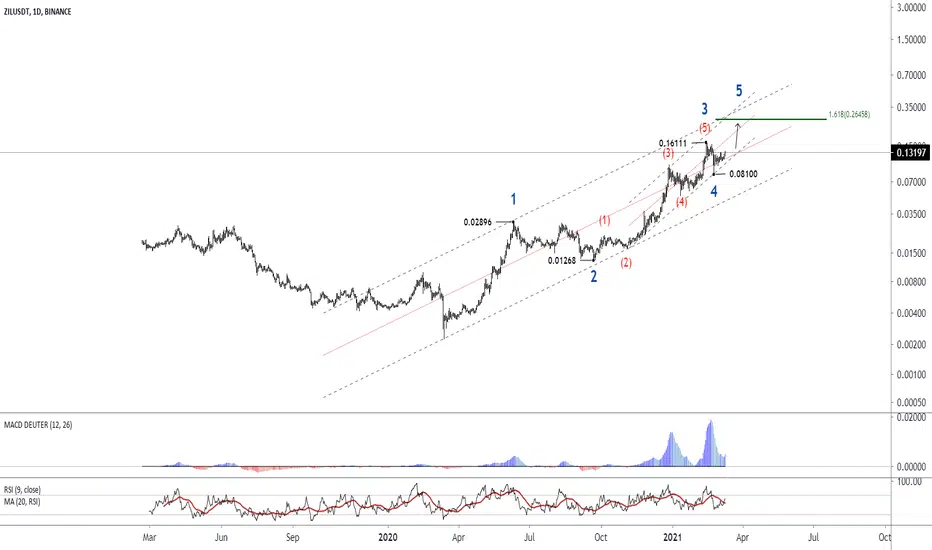
The end of wave 4 and the beginning of the 5th uptrend wave 5 According to the wave count done in the daily chart, wave 4 has ended in the range of 0.081 and the 5th wave has started, which the targets of this uptrend are in the range of 0.26 to 0.35.
GRTUSDTThe first uptrend has finished around $ 0.78; the price is in sub-waves of wave 3. From this point Wave 4 has ended in the range of $ 1.30, by crossing the price from the drawn trend line, we can expect the price increase and rise up to the range of $ 5.85.

EURUSD possible buyPossible future H&S formation or (eventual continuation to the top) after retest or market manipulation of the lows confirms

BZRX-The diagonal pattern in wave 2 from point 3The general downtrend has finished at $0.0880, by crossing the price from the range of 0.7454, which is the end of wave B, this scenario will be confirmed. Currently, the price is in the sub-waves of ascending wave 3, which in wave 2 of that the Ending Diagonal has formed in the range of $ 0. 3424. There is the probability of the formation of a strong uptrend in the near future for ascending wave movement


Overview: XRP it's has extremely prepare the next trend bullishIn this overview, I want to show you a lot screenshoot of what we can to see in the XRP for the next weeks to months, and also in short term. For that, this cryptocurrency noboday it's talking about it.
So, I will going to starting with the sequence to short term to long term to have this perspective in both multitimeframes analysis:
Looking in H1 and H4 timeframe, I see that XRP was formed a shoulder head shoulder inverted, that mean that XRP it's into this next bull movement toward my 2 targets at $0.50 cents and $0.60 cents. Also, We see that XRP it's in the accumulation zone to accumulate more XRP.
As I have in my portfolio 4,783 XRP coins. I thinking to bought more XRP to hold, my goal it's to reach 10,000 XRP to be in the par with Cardano that I have 11,237 Cardano coins. Now, XRP it's my most cheap crytpocurrency into my top 5 crytpocurrency. For that, the price it's around of $0.45 cents. For that, I don't missing this crytpocurrency in my radar for the next bull rally in XRP.
The bad news it's that it's the only crytpocurrency that I can't to trade XRP, unfortunately, much exchange it's dislisted XRP included my exchange Prime XBT and little more my new crytpo broker Simple FX, much exchange doesn't offer to negotiatiate or trade XRP, at least, I just use (Crypto.com) to hold XRP, it's the only what I do.
Now, in Daily chart, we see that XRP it's formed a simetric triangle zone, that it's an accumulation zone for the next weeks o months. As XRP it
s in the lower zone what form the support line, it's leading toward the objective of $0.60 cents in short term as the price it's around of $0.45. cents. Also, I see this perspective that XRP it's in the accumulation zone and we see that the next trade, XRP it's going to explode soon in the next weeks. For that, theres a good opportunity to re-accumulate more XRP coins if you don't bought, this it's your good opportunity to buy zone before XRO goes to $1 dollar. Because my XRP forecast it's proyect to $1.45 dollar, and that it's an up of 140%.
The weekly structure it's bullish, There's not much to talk in this timeframe. XRP it's following the trend.
In monthly timeframe, XRP it's leading toward the bull rally, this will be extremely important between medium to long term to reach the price maximum history of $3.50 USD approximately. I suggested to invest in this crytpocurrency in the lower zone before that XRP goes to $1 dollar or above of this price.
And finally, these are my targets profits to reach up in XRP. For that their adoption it's becoming a luxury when your XRP it's hit an extremely value that we can't to imagine it. For that, this it's my top 5 crytpo in my radar, just for below of Bitcoin, Cardano, Ethereum and Chainlink. For that, guys, XRP has much news in their use of case what XRP it's becoming the bank's money for their uses of cases.
For that, this crytpocurrency it's fascinating to invest!!!
Guys, if you found out that this idea it's extremely interesting what you see. Share this overview with others peoples, traders, friends and you're guress to comment here what do you expect in XRP in the future. And also, I invite you to watch my announce of my topics what I want to talk about in the next weeks in my tops cryptos ad my recent fundamental analysis of Chainlink.

MANABTC - Beginning of the 3rd ascending wave Beginning of the 3rd ascending wave with the target of Satoshi 1327
By the end of the 2 / B wave in the range of 216 Satoshi, the uptrend has begun, in the range of 786 Satoshi, the first uptrend ended. By break down of downtrend line the, 3rd Wave has started.
In the 240-minute chart you can check the sub-waves

Pole Dancer formation - do we have a yum yum style breakout?The chart is looking good! Companies like this are the future of cgildren's education. This stonk may be YOLO worthy...
Do your research!

The beginning of the uptrend in Wave 3 with target of $ 40
The first uptrend ended in the range of $ 9.82, in continuation, the corrective movement of that has finished in the range of $ 1.96. By drawing the channel line, we can set a $ 40 target for this token.
In the daily chart, the first 5 ascending waves which were able to cross the end of wave B, confirms the uptrend (wave 1)
( Daily Chart )
In the 240-minute chart, the first wave count from the uptrend waves and its corrective movement has been specified. By crossing the price from the specified trend line, we can get the confirmation for the uptrend. Needless to say, the main confirmation can be received by crossing the price from the range of 6.94, which should cross this range with 5 ascending waves.
*Finally, my personal strategy:
I will go long when the trend line is broken.

UK100- Expanded Flat patternIn the 240-minute chart, due to the 5 descending wave movement to the range of 6315, there is a scenario that, we encounter 5 more downtrend waves. The corrective movement of these 5 waves have been completed in the range of 6793 and the first wave from point 3/C has been finished in the range of 6535. In wave 2, the Expanded Flat pattern is formed.
By break down of the downtrend line in the 60-minute chart, hopefully, we can expect the continuation of the downtrend with 6150 targets.

The end of wave 4 with Expanded Flat patternIn the daily chart, the 4th wave from the sub-waves of 3rd wave has ended in the range of $ 21, and the uptrend has started. The initial target for wave iii is around $ 55. In addition, the main target is heading toward the range of $ 80.

Complex Corrective movement in Wave IVBy the end of Wave III in the range of 2075.14, the corrective phase has begun in Wave IV. Currently, and given the 5-wave corrective movement, there is a scenario that we are encountering a complex corrective movement that will be ended in the range of 1630 to 1680 dollars. Needless to say, the level of $ 1802 is a very important range, and if the price crosses this range, probably the corrective movement of wave IV is over.

The diagonal pattern in the range of $ 3.08
( Daily Chart )
In the daily chart, the first 5 ascending waves have ended in the range of $ 3.40 and the price has entered the corrective phase of this uptrend.
Note that this is one of the most likely scenarios.
The first corrective wave is finished around $ 2.25 (a wave a) and the corrective movement of this wave is around $ 3.08 in accordance with the RSI.
In the 240-minute chart, you can see the structure of the sub-waves, and in the 60-minute chart the price is currently in the first descending trend, which could fall to the short-term target of $ 2.53.
Very important notes:
The long-term target for natural gas (XNG), as has been shown in the daily chart is in the $ 1.92 range, which is the overlapping point of the two Fibonacci ratios.
- The trend line drawn in the 240-minute chart is very important and the price should be fixed below this range to confirm this scenario.

Loombtc- Bullish diagonalIn the 60-minute chart, the first 5 ascending waves have been completed in the range of 265 Satoshi, and currently the price is in the 3rd wave from point 3, which can move up to the range of 366 Satoshi and even more.
To get the confirmation for the uptrend, the price needs to cross the range of 243 Satoshi.

NANOBTC - Bullish DiagonalOn the daily and 240 -minute charts, the downtrend is broken, and we are waiting for the price increase.
The interesting point about this chart, is the Diagonal pattern which has formed in the 60 -minute chart.
The first ascending wave is completed in the range of 0.0001216 and its corrective movement is finished in the form of 3 waves with the Diagonal pattern in the range of 0.0001061.
By crossing the price from the range of 0.0001129, the first target can be in the 0.0001582 area.

EURJPY - Diagonal PatternIn the weekly chart, the Triangle pattern is broken and the uptrend is almost being confirmed
(Weekly Chart )
In the daily chart, by completion of Wave 2 in the range of 114.39, the uptrend has started in Wave 3, price is currently in this wave of which the targets of the uptrend can be in the range of 133.
(Daily Chart )
In the 240-minute chart, the wave counting has shown that, corrective movement of wave 2 from sub-waves of wave 3 has been finished in the range of 38% Fibonacci ratio. The most important point is that the Diagonal pattern has been shown in the one-hour chart.
By crossing the price from the range of 128.66, this scenario will be confirmed.

Weekly Outlook! 3/1 - 3/5Here we go over last weeks video and we take a look at a few things we are keeping an eye on for the coming week!

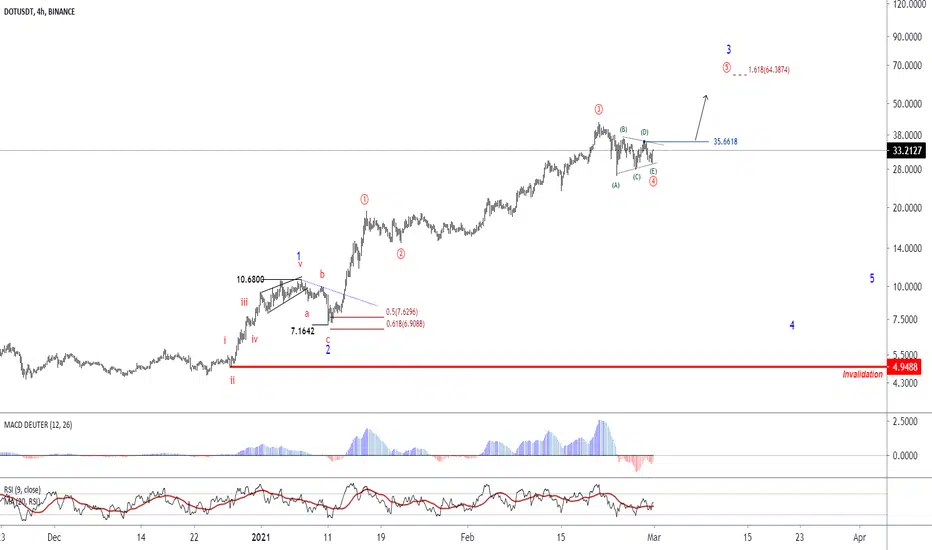
polkadot - Bullish TriangleIn the 240-minute chart and in the 4th wave, from the sub- waves of 3rd wave, a triangle pattern has been formed, which is being confirmed by crossing the price from the range of 35.66, and can form an ascending trend up to the range of $ 64.
OH MY GOD!!! Bitoin going to crash!!! We're going to down!!!The market it's make bearish in H1 and H4 confirmed. At the moment, I put my sell order limit at $49,000 USD towad the $42,000 USD.
There's an interesting short position in this zone of $49,000 USD to sell Bitcoin. And my SL it's around of $52,500 USD. Guys, inevitable, I'd reccomend to closed up your long position in Litecoin, Ethereum, Cardano and Bitcoin Cash as crytpomarket it's turn bearish and also, we hope more opportunites to bought more cheap.
This it's the H4 screenshoot. We see that Bitcoin formed a bearish risign wedge, and I calculate my objective to the support of $42,000 USD.
Daily chart it's look the bearish panoramic, that it's a correction before to continue up, and we see a bearish divergences in the RSI and price action too
And finally, in 3 Daily chart, we see that Bitcoin it's formed a bearish divergences in the RSI and price action. That it's a market correction.
For that, I will going to short Bitcoin!!! I hope that tis analysis it's support you and understand what happened in the crytpo market.

BTC Sell Off Here is What Happened and what you can learnHello and Thanks for stopping by, this is my first tutorial post so go easy on me haaaaa
Ok well all is self explanatory really as you can read by the chart .
Lessons that can be learned from this can be repeated over and over again but the truth is we will always see the same scenario playing out over and over again because that is what feeds those who are succesfull at trading .
Simply put what you see on the chart is a example of greed and stupidity, Ok we have seen it all 1000s of times before but someone out there does not want to make the same mistakes again and this post is designed to help you better prepare yourself for this eventuality and give you some positive guidelines to improve as a trader .
1, Do not Long Tops and dont short bottoms . FOMO might work some of the time but most of the time you will regret it
2, Plan the Trade and trade the plan or you will only plan to Fail
3, Patience always pays * wait for the Retrace or the breakout depending on the trade you want to take with a solid plan in mind
4, Always use a SL and know when and where you are wrong. Risk management is so important learning to protect your capital keeps you in Business
5, There is a time and a place for Leverage learn this without going BUST
6, Understand the importance of Position size and use a Position size Calculator if that makes it easier
7, Learn the power of Footprint Charts and how to use that candle Data to your advantage. Seeing Millions at the top or bottom really is a great advantage
8, Take profits on the way up or down at strategic points , Locking in profits guarantees you get paid and you wont get caught out being Greedy
9, The market has no emotions only traders do ! If you are emotional you are probably taking too much risk of your capital...
10, Accept that being wrong in Trading is Normal, provided you calculate every trade you will only lose the minimum and live to trade another day
11, Most of the time There will always be that grab Liquidity move, up or down, remember that ! Rather than placing a SL where its crowded. Don t think Like the Herd
12, Learn why Open Interest is important and how funding impacts you ! This is probably overlooked by many whom trade BTC Perpetuals
I will leave you with this Quote " The Market does not know you exist. You can do nothing to influence it. You can only control your behaviour"
Thankyou for reading my post and I hope it helps somebody .
