UNISWAP-Ending diagonal patternIn the 240-minute chart, the first 5 ascending waves are completed in the range of 61986 Satoshi, and the corrective movement is completed in the range of 34774 with Ending Diagonal pattern. Due to the price increase, there is a scenario that wave 3 has been started, the initial target of which is 134977 Satoshi and the final is the targets of 235459 Satoshi.
Marketanalysis

KNCBTC-The formation of a very strong uptrend in 3 / C waveIn the daily chart, the first 5 ascending waves have been completed in the range of 21818 (1 / A), and its corrective movement has been completed in the range of 2210 with 3 descending waves.
By breaking the downtrend line, we can consider it as the advent of an uptrend in the 3 / C wave, however, we can receive the main confirmation when the price crosses the range of 7025, which is the end of wave iv.

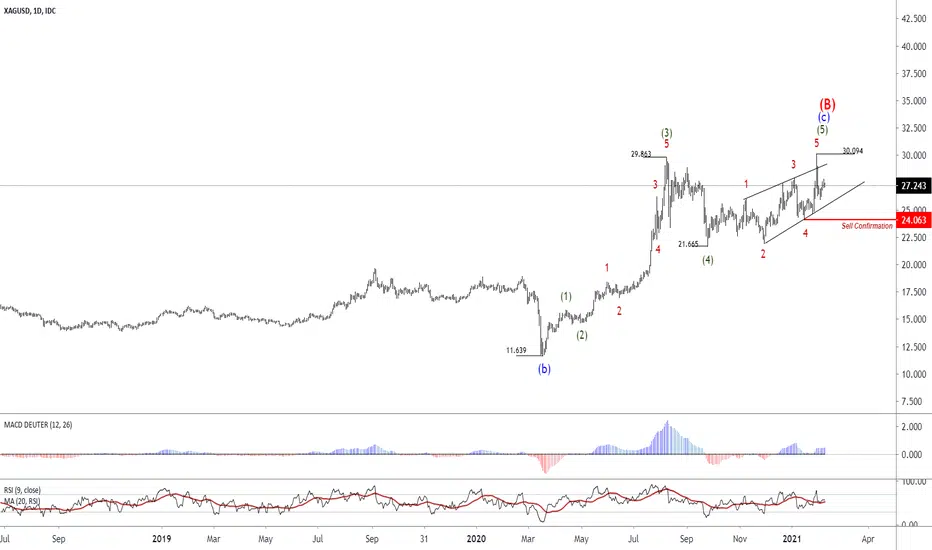
The formation of the Diagonal pattern at the end of 5th waveThe formation of the Diagonal pattern at the end of 5th wave from point b
First, let's take a look at the weekly chart. The first uptrend ended in the range of 49.83, and the price is in corrective phase for this uptrend, which can be extended up to the $ 8 level.
( Weekly Chart )
In the corrective phase of (2 / B), there is the possibility of the termination of wave A in the range of 13.65 and also wave B is in the form of Expanded Flat, which might be finished in the range of $ 30.09.
In the daily chart, by ending the b wave from point (B) in the range of 11.63, according to the Expanded Flat pattern, we should have 5 ascending waves, which are completed in the range of 30.09 and the Diagonal pattern is formed in its 5th wave.
If this pattern is being confirmed, i.e., the price can cross the range of 24.06, we can expect a downward trend with very high targets, although the initial target according to the Diagonal pattern could be in the range of $ 21.66.
The Triangle patternThe Triangle pattern is forming in wave 4 from the first ascending wave of point 3
As you can see in the image, the uptrend is completing in the first ascending wave from point 3, currently, the price is in wave iv of this wave. The triangle pattern is formed and by crossing the price from the range of $ 34,985 we can get the confirmation for the uptrend, and we can go for the first target of $ 54,700.

Coti-The beginning of ascending uptrend for the target of $ 0.33The first 5 uptrend has ended in the range of 0.098, and also its retracement has finished in the range of 0.02596 with the Diagonal pattern.
Currently, the price is in wave iii from point 3 / C, the end of this wave is price area of 0.33., however, it should be noted that, this price is the first target, we can expect a price increase up to 90 cents.

Q: Can I sell Bitcoins for a short time?A: As you can see in the daily chart, there is a very strong uptrend, which has been extended up to the range of $ 411950. In this range, wave III is over and we should wait for the retracement trend of wave IV. Since wave II had a short corrective movement, correction of wave IV could be long and extended up to the range of 0.618 Fibonacci ratio.
The drawn trend line is very important.
(Daily Chart )
Monitoring 240-minute chart for a detailed review of wave IV:
The price decline in the range of $ 29,241 is in the form of 5 mixed waves, which can be a Leading Diagonal pattern. The upward movement in the range of $ 40,955 is in the form of 3 waves. Also, the RSI was unable to hit the above 20-day moving average. In addition, we can see a decline in the volume at the MACD. Given all of these signs, by crossing the red trend line, there is the possibility, the movement for the downtrend for the range of $ 22,750 has been started. The main confirmation for this downtrend can be received by the price crossing the $ 32171 range.

This is a warning note, please study the descriptions carefullyThere are two scenarios for Ethereum, of which both are descending!
In the first scenario, which is shown in the 240-minute chart, the uptrend from $ 910.82 to $ 1763 is in 3 waves format, and it is likely that we encounter the Expanded Flat pattern. In this case, with the price crossing the range of $ 1271, we should expect a downtrend below $ 1000, up to the range of $ 870 to $ 760.
In the second scenario which has been shown in the daily chart
The first uptrend has ended, of which the 5th wave has been (Extended Wave), by crossing the price from the range of $ 1271, we can predict for the second time, the expansion of downtrend movement up to the range of $ 800, which is the corrective wave for downtrend of wave 2.
(Daily Chart)
**This case has been seen in all cryptocurrencies except Doge, of which the situation is in favor of this currency, due to its widespread support in this descending trend.**

Gold-The completion of the first descending waveThere can be many scenarios for gold
One scenario is that the first downtrend has ended in the 240-minute chart and the corrective movement of the price can be in the range of $ 1892, and in continuation the downtrend can be expanded for the range of $ 1645.
On the daily chart, we are expecting the downtrend up to the range of $ 1645.
( Daily Chart )

USDCAD-Waiting for the downtrend expansion As you can see in the daily chart, we are waiting for the descending trend up to the range of 1.2039.
In the 240-minute chart, wave iii from sub-waves of (iii) has ended in the range of 1.2588, and its correction has ended in the range of 1.2882, the price currently is in the last wave of the downtrend, in wave (iii).

The termination of the Diagonal patternLet us first point out that the price is forming a Triangular pattern in the weekly chart. The price is currently in wave D of this pattern.
(Daily Chart)
In the daily chart, the first uptrend (wave A) has ended in the range of 111.68 and the price with the Diagonal pattern has completed the corrective phase of this uptrend in the range of 102.59. By crossing the price from the range of 105.67, the initial confirmation of the uptrend will be received, and now we need 5 waves pattern.
In the 240-minute chart and by monitoring the details, we see that 3 waves out of the first 5 waves are composed, and the price can extend the uptrend after a corrective movement that can be developed up to the range of 105.19 to 104.84.
The range of 104.39 is very important to us.

Misleading and mixed 3-wave patterns In the 240-minute chart, the structure of all waves is in triple format, which indicates the end of the existed trend. Previously, there was the possibility, that the Diagonal pattern completing in the range of 1.3736, but with price retracement and the created uptrend, it is possible, this pattern at wave C from point iii forming a Diagonal pattern. According to this scenario, the uptrend can be extended up to the range of 1.3795, and in case, it just goes below the range of 1.3562, we can be hopeful for a downtrend formation.

The completion of the first descending wave from i pointThe wave b has ended in the range of 1.23492 and the first 5 descending waves have ended in the range of 1.1952, there is the possibility that the price enters to the corrective uptrend phase, which can be extended up to the targets of 1.21 to 1.2195.
In my opinion, the 1.2267 range is a very important range, and by the price crossing this range, the probability of a trend change is very high.
Please see the analysis of the daily chart as following:

WHY IS FOREX not moving? Here is the answer!Hey tradomaniacs,
As you may have noticed the market is not moving as it should looking at fundamentals and news which is why I`m still staying aside.
A positive newsflow of economic data and very good earning reports plus a rising stockmarket are not really driving currencies as they should due to the fact possible stimulus could continue to boost US-YIELDS, which is currently in favour of the US-Dollar .
In this case we got two intermarket-correlations which are contrary making it harder for forex-pairs to move smooth and clear (especially risk-on-pairs such as AUD/USD and NZD/USD ).
Another example is USD/CAD as the market does not really know where to go as CRUDE OIL currently rises with the US-Dollar .
DXY (US-DOLLAR-INDEX) is by the way creating its first divergences looking at Momentum and indicators such as MAC-D and RSI and I`m waiting for the market either to break through the key-resistance or to create a double-top.
Bond prices and yield are by the way inversely related.
So what shall we look at?
As long as YIELDS continue to be strong with risk-on in the stockmarket we might see currencies stuck in major trend-areas.
This means we either wanna see risk-off in stocks for a bullish USD or falling YIELDS with rsik-on in the stockmarket for a bearish USD!
LEAVE A LIKE AND A COMMENT - I appreciate every support! =)
Peace and good trades
Irasor
Wanna see more? Don`t forget to follow me!
#Patience

Triangle pattern in 4th wave of the first descending pointBy double-checking the charts of this currency, in the 240-minute time frame, and according to the triple wave structure of the sides, which has been started from the range of 1.2132 and extended up to the range of 1.2155. The scenario of a Triangle pattern is under formation, which is in the 4th wave from the first descending point. By crossing the price from the range of 1.2058, we can get the confirmation for the completion of the first wave from the downtrend.

XRPBTC: Diagonal patternAs you can see in the image, in the 3-day chart, the Diagonal pattern has been completed in the range of 653 and the uptrend has started, this is a very long ascending trend and its initial confirmation is that the price has crossed the range of 4264, which is at the end of the 4th wave.

doge renkos daily What could go wrong? Doge Is going to get pumped up again In time. Let's face It the people want It. With yesterdays pumping and dumping and Elon Musks Intervention with BTC, I know things worked out nicely for me. Now I hear doge Is offering defi as a service. Which Is only relevant because dogecoin has some purpose for the first time other than a store of value. Will this trend continue? I've road two highs now with Elon Musk Intervening both times. Plus the market making opportunities when It trades at high volatility don't hurt Will we see continuous market manipulation, and explosive behavior again In time In regards to dogecoin. I think the trend will continue.

ETH: Diagonal pattern for the target of $ 800 The 12-hour chart indicates, how to count waves, where the wave iii from sub-wave 3 has ended, to get the confirmation the price needs to pass the $ 1047 range. In case this level is crossed, the pattern will be confirmed, and again we can expect the targets of $ 800- $ 900 for this currency.
In the 240-minute chart, the Divergence is also quite evident.

EURUSD: The completion of wave 2 from the first waveIt is very likely that the first wave is ending in the range of 1.2053, and its retracement is going to finish in the range of 1.2189. If the price crosses the range of 1.2076, a sharp downtrend in wave 3 will be confirmed.

CHF/JPY SELLThe market has been ranging since December 2020. In which the price failed to break above the major resistance level (shown by the green square) multiple times since 2016, making it highly unlikely for the price to break this level.
Due to the possible double bottom being formed I expect the price to test the major resistance level, then fall until it reaches the monthly support level shown by the yellow square.

BTC: Double Zigzag patternIn the 240-minute chart, the structure of the downtrend is in triple waves format, which firstly was detected in the form of a Triangle, but after the price development from the range of 30300, the scenario converted to the Double Zigzag pattern. There is another probability for price reduction up to the range of $26800.
In any case, while we can’t get the confirmation for the uptrend that the price crosses the range of $ 37874, in this case, is the targets of the uptrend are in the range of $ 48,000 to $ 52,000

Gold: Expanded FlatThis pattern is almost confirmed in the 240-minute chart in the $ 1874 range, we can get the main confirmation by crossing the price from the range of $ 1832 range.
The target of the downtrend is in the range of $ 1736.

Link: The completion of 4th Wave from point 3As you can see in the 240-minute chart, the price is in the sub- waves of 3rd wave, the 4th Wave hits to the channel line in the range of $ 17.10 and ends at that area. In my opinion, the target for the uptrend is $ 80 to $ 150, but the initial target is $ 38 to $ 40.

The completion of a Diagonal pattern in the range of 1.3746The last uptrend has ended in the 1.3746 range and the price has started a downtrend, the convergence in the RSI is obvious, by crossing the price from the range of 1.3446 we can get the main confirmation for the decline up to the range of 1.3132.
Needless to say, we must note that according to the descending scenario, in the weekly time frame the price reduction is very long term.
The range of 1.3850 is very critical; this analysis will be violated by crossing the price from this range
