Zcash – Probability of uptrend formation to the range of $ 183The first 5 ascending waves started from the range of $ 18.13 and ended at the level of $ 102.42. The corrective movement of this uptrend has been completed in the range of 46.27 which is approximately equal to the Fibonacci ratio of 0.618. By crossing the price from the range of 89.77, which is the end of wave B from the correctional structure, we can be hopeful to start the uptrend in C / 3 wave. This wave initially can touch the range of $ 183 and then reach the level of $ 384
Marketanalysis

NEO - The beginning of wave 3 from bullish with the target $100The first 5 uptrend waves started at the level of 3.89, has ended at the range of 25.85.
The corrective wave of this trend was very complicated and in the form of Expanded Flat and Double Zigzag patterns, which is completed in the range of 12.21, that is equal to 0.618 Fibonacci ratio. Currently, by crossing the price from the range of 21.82 (the end of X wave) and breaking the downtrend line, we can be hopeful to get the following targets.
First target: $ 42
Second target: $ 47
The third and final target is $ 100

OMG - The beginning of the uptrend in wave 3 / AThe first uptrend, which started in level of 0.3031, ended in the range of 9.82, in continuation the price entered the corrective phase of this uptrend, which is a simple 3-wave pattern that ended in the range of 1.99.12. This corrective movement has been completed in the range of 0.786 Fibonacci ratio.
Then, with the breaking of the downtrend line, we can be hopeful that the downtrend is over, and also by crossing the price from the range of 5.18, we can get the main confirmation.
The general targets are in the range of $ 39, in addition, we can focus on $ 15 and $ 17 as the short-term targets.

BQXBTC - Ending DiagonalIn the daily chart, as shown in the image, the first wave from 5 ascending waves has been completed in the range of 2125 Satoshi, and with a simple pattern -the corrective movement has been finished in the range of 392.
According to this analysis, by crossing the price above 990, we should expect a price rise up to the range of 1593 (targes of the pattern)
As the price is in wave III, it has the potential to move up to the range of 3424 and even higher targets.
The chart depicts how to place the order.

Where I think a huge chunk of Bitcoin inflow is coming fromA chart Peter Schiff does not want you to see.
Bitcoin is no doubt David in the fight against safe haven goliath gold. Bitcoins market cap is growing at an incredible rate, and I imagine as seen in this chart there have been a lot of selling into BTC. Let's now view it below with a gold cryptocurrency.

Overview Market Analysis: Great Britain Pound still bullish!!!In this macroanalysis, we see that Pound still bullish against the U.S. Dollar and then, the inflation of the U.S. Dollar it's another siganl that FED ccontinue unstable the U.S. policy market. That it's a big warning to invest in United States, as the correlation on Bitcoin it's the same of Great Britain Pound that continue bullish. So, we are in the bearish cycle for the U.S Dollar and bullish cycle for the Great Britain Pound.
Now, looking in weekly update, I put a new important key trend line support that Pound still bullish. My next target will be the $1.43 USD. That it's so amazing to know it and put a long position in GBP/USD with good lots to make near of 800 pips.
But,if you're looking in monthly chart, the trend on Pound it's so bullish and I have a forecast that Pound could reach up toward the $1.62 USD.
What do you think about this overview? Could Pound continue agains the rival U.S. Dollar, and America could to have an issue to collapse the economy based in the more inflation?

XRP - The completion of 2nd wave in the range of 0.170The 2 / B wave has ended in the range of 0.1140 and the price was able to reach the range of 0.7900 with 5 ascending waves. Under the influence of market news for this currency, the price pushed down to the range of 0.1700. (Completed the 2nd Wave)
Currently, by having the price hitting the channel line, there is a scenario that wave 2 is over and wave 3 has been started. I am personally waiting for the targets of $ 8 to $ 13 for this currency in the 2021 year.
For this currency the first buy target range again is on 0.3468 price level, the aforementioned range have been concluded according to the Price Action rules, and also, the second buy area will be set after the end of the first 5 uptrend waves.
( 10Days Chart )

Gold – Formation of the first wave from the point of 5In the daily chart and by price crossing the trend line, the uptrend is confirmed. In the 240-minute chart, according to the wave count, the price is in sub-waves of the 3rd wave from “ i “ point , which can be extended up to the range of $ 1967.

GBPUSD - Diagonal PatternThe structure of the wave is in the form of three waves, and there is a scenario that we encounter the Diagonal pattern. Probably the 5th wave is shortened.
By crossing the price from the range of 1.3539, we are waiting for a downtrend in the 2 / A wave.

EURUSD - Diagonal patternThere is the possibility that, the Diagonal Pattern in 5th wave from point 1 has been completed in this price level, and in case if the price crosses the range of 1.2214, we will wait for the price decrease.


EURJPY Head And Shoulders patternEJ has formed an inverted Head and Shoulders pattern on the daily chart. And while price was doing so it was accompanied by 2 large impulse candles. I am looking for a retest of the neckline which happens to be a 50% retracement. When the time is right a bullish reversal pattern on the 4 hr chart may signify an entry!!


Dow Jones: Awaiting Confirmation for Diagonal PatternIn the 240-minute chart, the Diagonal pattern is formed in the V wave, to get the confirmation for the downtrend as well as this pattern, the price needs to cross the range of 29722. The initial target of this downtrend is around 28900 area, (according to the Diagonal pattern target)

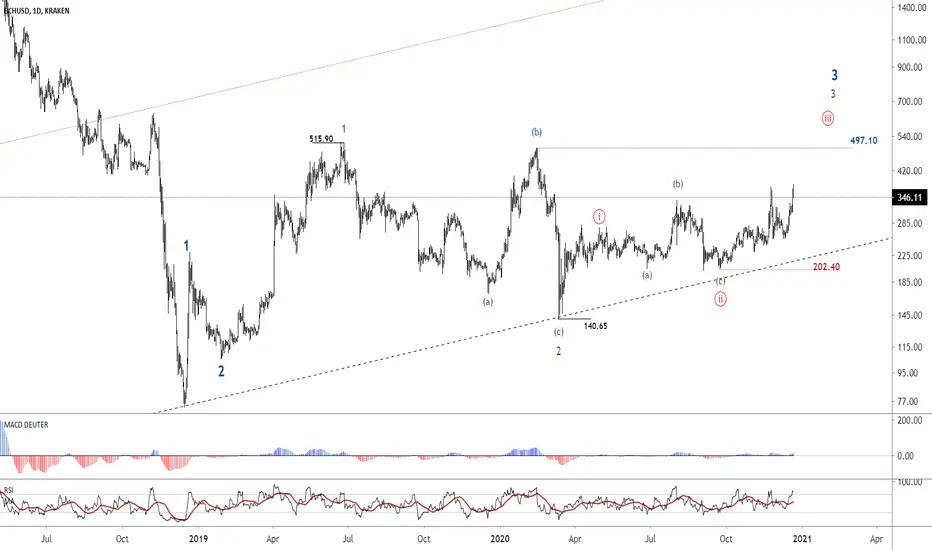
Trying to gain popularity and formation of ascending movement In the weekly chart, there are two important ranges. The first range is $ 497.10, by crossing this range, we can be hopeful for an uptrend formation for the targets of $ 2,200 to $ 3,000. Also, if the price crosses the range of $ 231.07, it may encounter the Triangle pattern, in which a long corrective movement is predictable and then we expect a descending movement up to the range of $ 45-50.
( weekly Chart )
In the daily chart, we can have this wave count that wave 2 has ended in the range of 140.65, and the price is forming wave iii. However, to confirm the uptrend, the price must cross the range of $ 497.10.
Personally, I’m interested in putting my investment in Light Coin (SHA256).
GBPUSD – The Uptrend Trend Target of 1.3946As you know, the price level of 1.3132 is a very important range, and if our price crosses this range, our scenario will be changed.
According to the wave count in the 240-minute chart, wave iv has ended in the range of 1.3132 and the uptrend has started in wave V, which its targets can be in the range of 1.3900, the wave count has shown in the 60-minute chart.

EURUSD –The target range of 1.2600 in the UptrendWith the price crossing the range of 1.2166, the uptrend has been confirmed, the price is currently in the 5th wave from the 3rd point. After the completion of this trend, the corrective movement process begins in the 4th wave. The midline of the drawn channel is very important to us and we can go long while encountering this midline

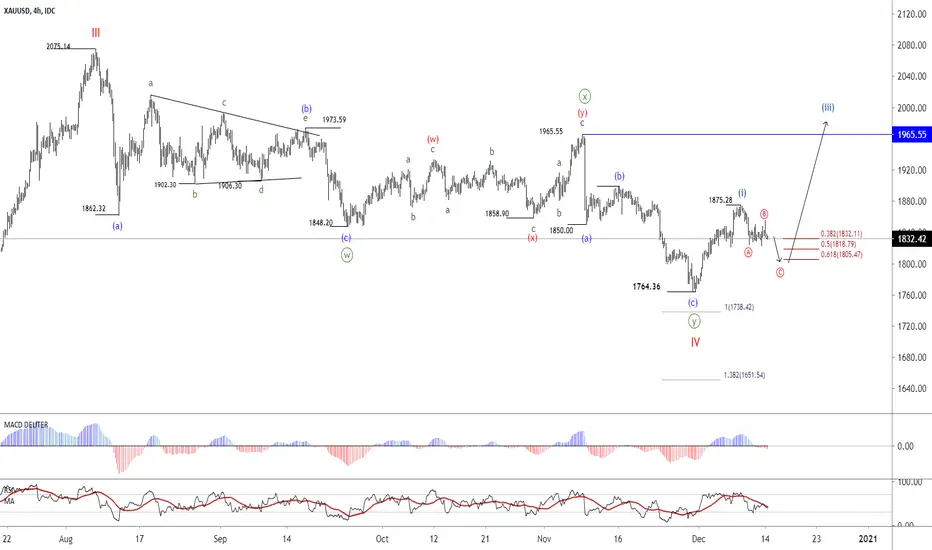
Q: What is your idea about gold in this week? A: As shown in the picture, wave IV has ended in the range of $ 1764, and the price is rising in the V wave. From the sub-waves of this uptrend, wave ii has ended in the range of $ 1818, also by the price crossing the range of $ 1855, we are waiting for the price increase for the target of $ 2200. The first ascending wave from V point, is likely ending in the range of $ 1965 and after a corrective movement, the price will return to the uptrend phase.

To the moon with full powerFrom the Bitcoin family, Litecoin is a digital asset token of the Litecoin network that can surprise everyone. My only complaint is that I own the least of this token.
In the weekly chart, and according to the wave counting, the price is in the 5th wave of the uptrend, according to the Fibonacci ratio in wave 5, this uptrend can be extended up to the target of $ 1688.
(Weekly Chart)
The price is in the 5th wave from the sub-waves of the 3rd wave, in which the price has the largest movements as usual.
As you see, the daily chart is totally clear, there is the possibility that the first wave from the 3rd point ends in the range of $ 438. In continuation, I expect the advent of a strong uptrend, initially for the target of $ 597 and finally the target of $ 1600.

Dow Jones – The advent of Diagonal pattern on the 240minuteChartThere is the probability for the completion of the first 5 ascending wave of 1 / A
(Weekly Chart )
In the weekly chart, we had this wave counting, this uptrend is likely in the wave 5 from point of 1 / A.
( Daily Chart )
In the daily chart, with the end of wave 4 in the range of 18213.70, the 5th wave has started, currently the price is in the sub-waves of the V wave.
The Diagonal pattern is formed in the 240-minute chart, which can be ended in the range of 30325 to 30500, this pattern will be confirmed by crossing the price from the range of 29820.
The targets of this pattern are the range of 28920 (starting point of the pattern), by considering the gap, we can also include the range of 28440. The third target is in the range of 26143.

Zig Zag pattern In the iv wave, a Diagonal pattern is formed, by crossing the price from the range of 0.5248, we can be hopeful for the advent of an uptrend. This pattern is in the C wave from iv point

EURJPY – The Uptrend with the target of 128In weekly chart, the wave of 2 / B has ended in the range of 94.11, the price is currently in wave 3 from point 3 / C.
( Weekly Chart )
In sub- waves of wave 3, the wave 2 is completed with a Diagonal pattern in the range of 114.39.
In the daily chart, with the completion of wave 2 in the range of 114.39, the first ascending wave in 3 is ended in the range of 127.07, and its retracement movement is finished in the range of 121.51.
(Daily Chart )
In the 240-minute chart and by reviewing the details, it is clear that the price is in the wave 3 of iii, which should be a long wave. The confirmation of this uptrend will be received by the price crossing the range of 126.73.

Gold - The first ascending wave in the V waveAn uptrend that starts at $ 1764 and ends at $ 1875 can be a 5-wave movement.
The price is currently in the corrective phase of this trend, which can be extended up to $ 1805. The main confirmation for the uptrend will be received when the price crossing the range of $ 1965