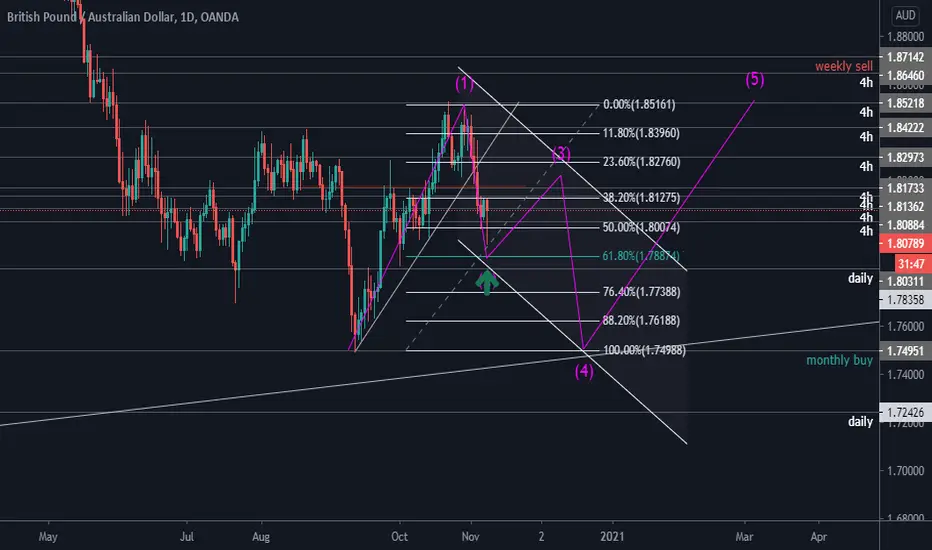
GBPUSD – probability of completing CorrectiveGBPUSD – There is the sign of probability of completing the corrective uptrend
The range 1.3482 is a very important range for us, which by crossing the price from this range, we will encounter changing the trend.
Currently, according to Fibonacci percentages, there is a scenario that wave 2 has ended in the range of 1.3398. The first confirmation for the advent of a downtrend is crossing the price from the range of 1.3105.
by the resumption of this movement if the price crosses the range of 1.2853 and with 5 downtrend waves, the downtrend in wave 5 can be confirmed.
please see the previous analysis by following this link.
Marketanalysis

BTC - $ 21,500 moving targetsIn my opinion, in a not too distant future, Bitcoin will reach the price range of $ 167,000 to $ 225,000, and this guestimate is not out of reach when the valued banks are also talking about the $ 300,000 movement range. Due to this, new customers will be attracted to the market, which eventually increases the liquidity and demand for purchases, due to limited bitcoin, the price will increase.
The third price wave, which continued into the $ 19666 range, was like the gold diggers in old days, the only people who profited from the era, were those who sold the shovels, pickaxes, and drilling rigs to extract gold (a metaphor for people who were and are selling mining equipment.)
But now the reward of beliefs comes through patience.
Now is the time for people who believe in cryptocurrencies to get their rewards. I remember two or three years ago a subject was opened in a forum (when Bitcoin was $ 6,000) and someone claimed to be back from the future and the economy will be collapsed. He was telling bitcoin won’t have any value! people who have only 0.01 of this currency flee to places where life is too quiet. Many people made fun of this person, but now when I’m looking at this market, I give him some rights. For example, there are big contracts that Ripple has signed, and Ripple Net intends to be used in BOA - Bank of America and it has been finalized!
All this indicates that it is possible that we can no longer call the Blockchain an infant, and from now on we must consider a child who shows new capabilities.
Maybe this are future forecasts and one day will come true:
I think we are coming to a time when all the borders of countries are disappearing and the holders of the famous digital currencies are creating new countries. Like different communities, they use ASICs to protect their castles. It's a scary story and I hope we never see it. But give only one percent chance to this scenario to turn the reality. Where do you want to be stand?
It might not be a bad idea to take a risk to enter an unknown market of cryptos.
Chart Description:
In weekly chart, our target range is $ 167,000 to $ 225,000.
In the daily chart, we are completing the 3rd wave that this uptrend can continue to the target of $ 21,500 and then in continuation, we will enter the corrective phase, which is likely to be a very short corrective movement. The range of $ 13,880 is very important and the price should not exceed this range in this corrective movement.
According to the Elliott wave rules, wave 3 should be the longest wave, but we should also consider this fact which in many stock markets, metals, and digital currencies, wave 5 has always been the longest wave, so we can hope 5th wave becomes the Extended wave, in which we will reach the goal of $ 167,000.

EURUSD - Ending Diagonal pattern EURUSD - Ending Diagonal pattern and the probability of completing the uptrend in wave B.
In 240-minute chart at 5th wave from C point, it is likely that the price is forming a Diagonal Pattern, which by ending of that, a large downtrend will be started. According to the current wave count, only 3 waves of this pattern have been completed and this is the only existed scenario.
In continuation, you can see the daily and weekly analysis as follows:

USDCHF - Expanding Diagonal PatternThe upcoming pattern is too rare, the analysis may confront error. If the pattern is detected correctly, we should wait for the price to rise to the level of 0.9296 as an initial target.
We will get the confirmation of this pattern, when the price crossing the range of 0.9147.

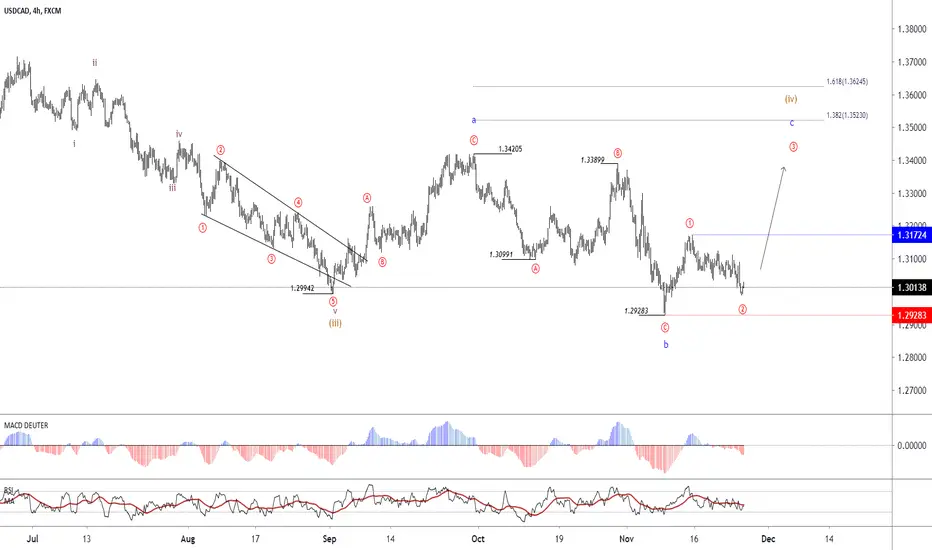
USDCAD - Probable Expanded Flat Pattern formation in Wave IVThe structure of the downtrend which has been started from the range of 1.3420, has finished in the range of 1.2928 which is in the form of 3 waves. Given this trend, we will probably have a 5-wave uptrend in C-wave, which could be extended up to the target of 1.3523.
If the price crosses the range of 1.2928, this analysis will be violated. In case the price crosses the range of 1.3172, we can expect an uptrend forming hopefully.
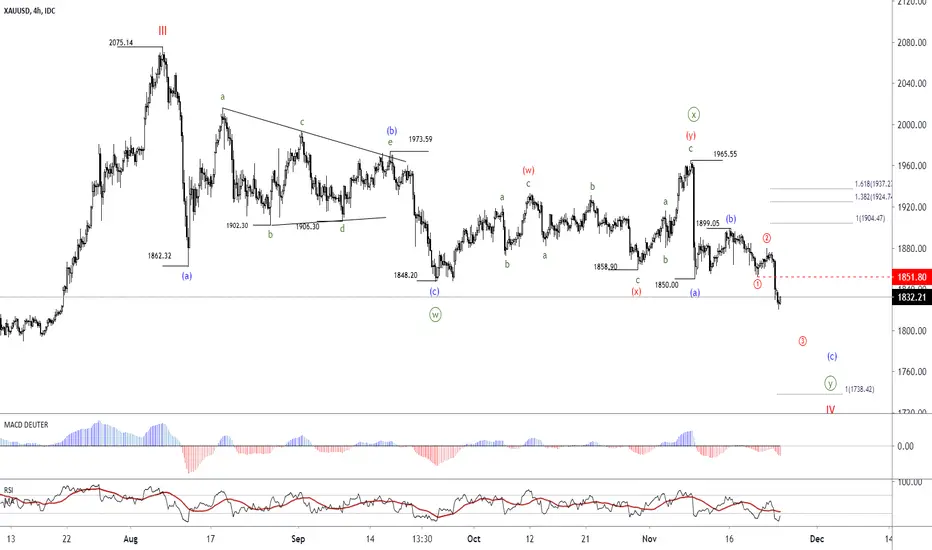
Gold – The confirmation of the downtrend up to the range of $ 17by the price crossing the range of $ 1851, and the confirmation of the downtrend and the completion of the “b “wave in the range of 1899.05 has been received. The targets of the downtrend are in the range of $ 1760
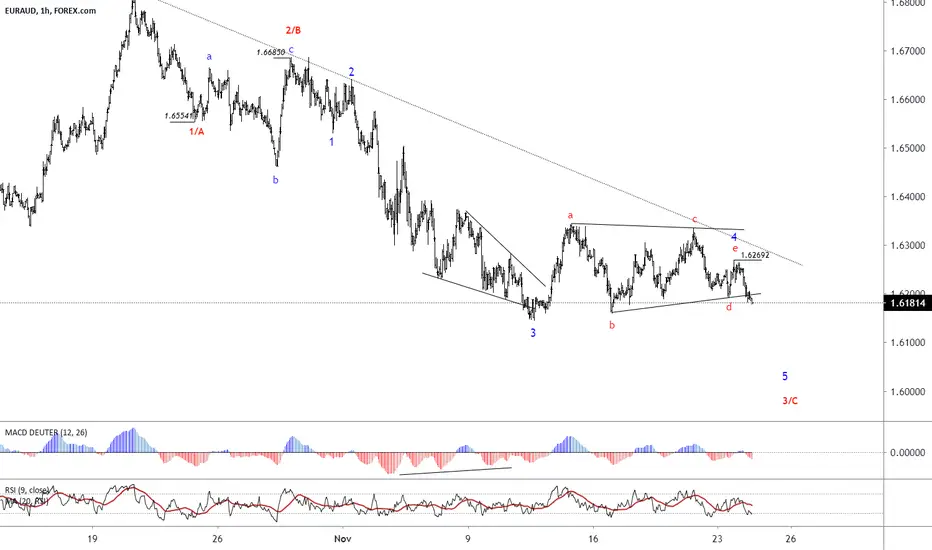
EURAUD - Displays template time of patterns. In the previous analysis, there was a scenario that an uptrend would take shape. Over time, by the wave count changes, the Triangle Pattern in wave 4 has formed. The range of 1.6100 to 1.6050 could be the primary targets
NADUSD - The Ending Diagonal pattern represents the end of the fIn the 60-minute chart, the divergence in MACD and RSI is quite clear, and also the 3-wave structure of the sides shows the Diagonal pattern.
By crossing the price from the range of 0.6878, which is the end of the 4th wave of this pattern, we can get the confirmation for the downtrend and the targets of 0.6795 and then 0.6700 price level.

USDCHF - Expanded Flat pattern in wave 4There are many scenarios for this currency in the daily and weekly charts, but the current pattern in the 240-minute chart is Expanded Flat, which can be extended in the up the range of 0.9275 to 0.9387.
It should be noted, this is a corrective movement of wave 4, after the completion of correction, the downtrend will begin in the last wave
If the price exceeds the range of 08978, this scenario will be violated. In case the price crosses the range of 0.9139, the ascending trend will be confirmed.


EURJPY LONGA good probable setup for EURJPY.
Throughout the week, wait and pay attention for market structure and price action to develop. Apply confluence, as well.

B.A.C BANK OF AMERICA DESCENDING BROADENING WEDGE (END & ID) BANK OF AMERICA : BAC DESCENDING BROADENING WEDGE
EN : WE CAN SEE THAT BAC IS FORMING A PATTERN CALLED DESCENDING BROADENING WEDGE THIS PATTERN IS A STRONG BULLISH PATTERN, WE HAVE TO WAIT UNTIL CANDLE BREAKOUT FROM THE PATTERN, THERES GOT A CHANCE THAT BAC WILL DO HIS DOWN MOVEMENT TO AROUND 23.95 - 22.58 AREA
THE REASON IS SIMPLE
1. STOCHASTIC OSCILLATOR HIT THE OVER BOUGHT AREA
2. WE CAN SEE THE SWING HIGH AT TOP ON 3 SEPT 2020 LOWER HIGH (LOWER PEAK) AT STOCHASTIC MAKING A LOWER HIGH (LOWER PEAK) AND 12 OCT LOWER HIGH AGAIN (LOWER PEAK) BUT THE STOCHASTIC IS HIGHER HIGH (HIGHER PEAK) SO A BEARISH DIVERGENCE IS FORMED THIS MEAN BAC WILL DO HIS DOWNSIDE MOVEMENT
SURE BAC WILL CONTINUE HIS BULLISH THAT WE CAN SEE AT WEEKLY CHART THE TREND IS STILL BULLISH
IF THE BREAKOUT HAPPENED BAC TARGET PRICE WILL BE AT 27.75 THIS IS THE PATTERN TARGET PRICE
BAC ALSO WILL CONTINUE ITS BULLISHESS UNTIL 30.45 AND 34.05 BECAUSE OF THE GAP AREA BUT MAYBE IT TOOK TIME FOR CLOSE THIS GAP EITHER 2021 OR 2022
THANKS. …
ID: KITA BISA MELIHAT BAC SEDANG MEMBUAT PATTERN YANG DISEBUT DESCENDING BROADENING WEDGE PATTERN INI ADALAH PATTERN BULLISH, KITA HARUS MENUNGGU SAMPAI DENGAN CANDLE BREAK OUT DARI TRENDLINE DBW INI, TETAPI SEBELUM NAIK AKAN TERJADI PENURUNAN HARRGA KE ANTARA 23.95 – 22.58
ALASANNYA SIMPLE
1. STOCHASTIC OSCILLATORNYA SUDAH MENCAPAI TITIK JENUH PEMBELIAN
2. KITA BISA LIAT SWING HIGH YANG DIATAS PADA 3 SEPT MEMBUAT LOWER HIGH(LOWER PEAK) DAN DI STOCHASTIC JUGA MEMBUAT LOWER HIGH (LOWER PEAK) DAN PADA 12 OCT MEMBUAT LOWER HIGH LAGI TETAPI STOCHASTICNYA MEMBUAT HIGHER HIGH (HIGHER PEAK) JADI TERJADILAH BEARISH DIVERGENCE INI BERARTI BAC AKAN ADA PENEURUNAN HARGA
TENTU BAC AKAN MELANJUTKAN BULLISHNYA DAN KITA JUGA BISA MELIHAT PADA WEEKLY CHART TREND BULLISH MASIH ADA
JIKA BREAKOUT TERJADI MAKA TARGET PRICE BAC AKAN PADA 27.75 INI ADALAH TARGET PRICE PADA PATTERN TERSEBUT.
BAC JUGA AKAN MELANJUTKAN BULLISHNYA SAMPAI DENGAN 30.45 DAN 34.05 DIKARENAKAN GAP AREA TERSEBUT TETAPI ITU MEMERLUKAN WAKTU UNTUK MENUTUPI GAP TERSEBUT ANTARA TAHUN 2021 ATAUPUN 2022
SEKIAN TERIMAKASIH
BY RUPIN GOH
DISCLAIMER
No information published constitutes or offer, or recommendation, or advice, to buy or sell any investment instrument, to effect any transcation, or to conclude any legal act of any kind whatsover.
The information published and opinions expressed are provided by myself (Rupin Goh) for personal use and for educational purposes only and area subject to change without notice. Rupin Goh makes no representations (either expressed or implied) that the information and opinion expressed guarantees accuracy,adequantess or completeness. In particular, nothing contained consitutes financial legal, tax or other advice. nor should any investment or any other decision be made solely based on the content.
All opinion is based upon sources that Rupin Goh believes to be reliable but he have no guarantees that this is the case. therefor, whilst every effort is made to ensure that the content is accurate and complete, Rupin makes no such claim.
Limitation of liability
Rupin disclaims, without limitation, all liability for any loss or damage of any kind including any direct, indirect or consequential damages.
Copyright
All material produced is copyright to Rupin and may not be copied, emailed faxed or distributed without the express permission of Rupin
Notes: all orders are valid until the next report is published, or a trading strategy alert is sent between reports.


EURNZDPrice has been dropping for a while. Now, it is still about 90 pips from weekly trend line and 140 pips from strong support level - where we may expect and look for new trade opportunities.

BioNTech delivers like promised | NEW COVID VACCINE DATA | Hey fellow Traders!
Today From MAINZ, Germany to NEW YORK .
In the last Analysis we talked about upside potential of the freshly developed Covid-19 Vacccine from NASDAQ:BNTX and NYSE:PFE
Also calling out those huge gains even before all those news were released.
"Today those companies announced their mRNA-based vaccine candidate, BNT162b2, against SARS-CoV-2 has demonstrated evidence of efficacy against COVID-19 in participants without prior evidence of SARS-CoV-2 infection, based on the first interim efficacy analysis conducted on November 8, 2020 by an external, independent Data Monitoring Committee (DMC) from the Phase 3 clinical study. After discussion with the FDA, the companies recently elected to drop the 32-case interim analysis and conduct the first interim analysis at a minimum of 62 cases. Upon the conclusion of those discussions, the evaluable case count reached 94 and the DMC performed its first analysis on all cases."
This means we are right on track for the FDA Fast Track Drug Approval, on which the whole world put their hopes on. With increasing daily cases this news are like a rescue ring in the middle of the ocean.
But lets get back to the chart.
We had a huge upper resistance level at the psychological mark at $100 but if this move today turns out to not just be a bull trap and we can see a solid consolidation phase, im optimistic to see a new support level building up at the prior resistance.
As we can see the uptrend is still intact and we could form a nice resistance/support level over time. With the incoming cataclyst it should be pretty obvious that we are likely to see a evven stronger upmove soon. But this stock is still a playball from big hegdefonds and investors. So be careful when trading this.
Personally i´ll use the next the next rebound to stock up, wait for the news and then sell nearly all those shares on good news.
Why i am sure about this?
- Well the stock had the same moves for the past months, and if you understoof this, it was like a money making machine.
- First come first served
- Millions of pre sold Vaccine doses to dozen of countries.
- Momentum
- No insider sold yet
- MRNA TECHNOLOGY
- CANCER MEDICICNE IN THE PIPELINE
- Incredible Management Team
- And of course Everyone wants to finally get their old life back.
- $1.4 B Potential Revenue
- Bill Gates
Thank you for taking your time to read this.
I hope this was interesting and useful to you.
Best greetings and happy trading! :)
Disclaimer: All writers opinions are their own and dod not constitute financial advise in any way whatsovver. Nothing published by me constitutes an investment recoomenddation, nor should any data or Content be relied upon for any investment activites. I strongly recommend that you perfom your own independdet research and/or speak with a qualified investment professional before making any financial decisions.


EURAUDUPDATE:
After my previous trade idea, price has broken the zone immediately and it is about 100 pips from daily important zone.


TRICK OR TREAT - CORRECTION PLAYBOOKHello!
I hope many of you have been prepared for a pull in the indexes. The whole move lower right now is fueled by the fact that nobody owns protection into November, which is crazy considering there are elections coming, and now suddenly all the fund managers and retail crowd are slowly starting to realize it. The correction is very much needed to let some air out of the overblown equities market.
I am expecting a pull below /ES 3200 level , which is then going to be followed by a multi-day squeeze to punish some stubborn bears getting involved. After that, catching the short ain't gonna be easy and there will be all kinds of games being played by different market participants. But at the end I am expecting us to bottom near the /ES 3000 level .
Good luck!
Tonis

