Total Crypto MarketCapTotal has bounced off of resistance, but the indicators are pretty low. The value has also reached the extreme bottom now and is very likely to bounce up in a try of reaching the 1,4~1,5 T marketcap. We need to monitor DXY, BTC and SPX to see if that is possible.
Marketcap

TOTAL Crypto MarketCapWhat if the market held the lows from 7/26 and our lows right now is a double bottom?
I have a small long on at the lows in SOLUSD at 31.13 stop out moved to 31.22
If these lows do not hold it's going to be likely we can test the low lows and have a big nasty drop.

TOTAL 2 MarketCapThe main comment about crypto's marketcap is already published under the TOTAL analysis, but here we can see that VolumeTrend is reversing up and Momenter has signaled a reversal in Momentum.
Bullish for now.

Crypto TOTAL MarketCapAs you can see - we reached the triangle's target perfectly and bounced off of it. All indicators are either resetted or in middle ground open for rising - We can witness a push to the descending trendline once again.

3/3 times this was a good time to buy crypto. Is now the 4th...?Playing around with statistics and probabilities... Some people seem to believe in RSI and stoch RSI indicators (overbought / oversold markets). Especially when combined with powerful price action such as resistance and support levels. Such confluences seem popular statistical signals to buy or sell the market or at least start a DCA process.
Let's check what it suggests this time - and remember "past performance does not guarantee future results". ;-)
The total crypro market cap seems to have retested a significant level: 2018 Jan all-time market top. That level was broken through only several months later and the price never came back down to retest this level. Until the recent past few weeks. It is said that new All-TIme-Highs need validation via retesting previous All-Time-High levels before heading even higher. Now this has happened and the price has held above this level - so far. We are also below another important historical support (now turned into potential resistance). So the break of the down-trend has not yet been confirmed by price action.
However, statistics-wise this was a good time in the past to invest in crypto and hold it for new ATHs. 3/3 times such a low RSI and Stochastic RSI level confluence has proven a good time to buy crypto (mainly BTC of course, not the exotic meme coins that are nowhere to be seen today). What do I consider low? Both the weekly RSI and weekly Stoch RSI moving below the lower extreme threshold (their respective colored areas) at the same time. On a closer look, the weekly RSI + Stoch RSI confluence also worked when the RSI value was between 27-37 while the Stoch RSI was at extreme low levels.
So I bought some strong crypto now and will see the results in a few months. I never use up all my free capital, neither should you. Alwayss keep some gunpowder dry just in case history invents new statistics. ;-)

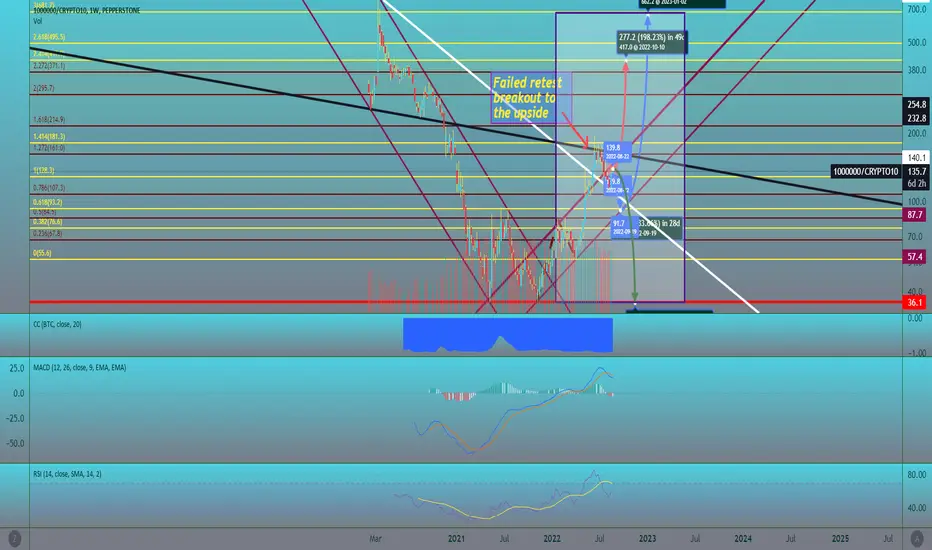
Unique Perspectives on CryptoThis graph represents the inverse chart of the top 10 Cryptocurrencies' market cap. I spotted a few conflicting signals which I described using 3 forecasting lines (Red, Blue, and Green lines). With correct SLs, TPs, and open orders set - great profits can be made.
Furthermore, I will rate the likeliness of each potential outcome
Outcome 1 (red line) (Bullish for this graph/Bearish for BTC)
Reasoning:
-Successful breakout from the closest white line to the current (Aug 22) candlestick. Therefore, the breakout should continue.
-Purely following the trend and candlesticks patterns, a strong move to the upside last week should be followed by a few(range of the red line) bullish candles.
-Last week's bullish close flipped the signal from bearish to bullish in the Trend-Based Fib extension analysis. This is due to last week's candle bullishly absorbing the whole bearish movement from the last 3 weeks, to close above the 1(128.3) fib support.
Although last week's candlestick closed close to the 1(128.3) fib support, the move be seen as a retest(from the fib line).
Likelihood of happening: 5/10
Outcome 2 (blue line) (Bullish for this graph/Bearish for BTC)
Reasoning:
-The closest purple line to the current (Aug 22) candlestick is retested (to the downside) from a failed breakout to the upside.
-After the fall it shall bounce off its next and major diagonal support presented as the lower purple line with the same gradient. It is a strong support line; the high time frame makes it even stronger.
-Afterwhich, the bullish rally should continue, to hit the top Fib lines within the extension.
Likelihood of happening: 6/10
Outcome 3 (green line) (Bearish for this graph/Bullish for BTC)
Reasoning:
-The first anticipated fall follows the same idea as Outcome 2, but follows with stronger bearish action.
-A turning point (to the downside) in the current trend may be spotted by the candlesticks reversing at the black line running through the middle of the chart. It is acting as one of the strongest resistance points on the chart.
Likelihood of happening: 5/10
It is important to know that we are heading into a scary, unique recession. It is critical to account for fundamental factors. Some fundamental analysis can be found on my page.
Plz like and subscribe if you enjoyed my content :)
TSLA versus F - Stock Price and so Market CapThis DAILY chart shows the RATIO between Tesla and Ford stock and so comparisons
between market cap.
A rising ratio indicates that TLSA is gaining market cap compared with F while a decreasing
ratio shows the opposite.
A long-term investor who wants to own either TSLA or F or a blend of the two could use
a chart like this to make trade decisions.
When the ratio is high and approaching the upper BB with high relative strength, such
the hypothetical investor may want to either sell TSLA or buy F.
When the ratio is increasing lower with the value approaching the lower BB and
confirmation with low relative strength he/she might want to buy TSLA or Sell F
or some combination.
This strategy might be back-tested vs an equal proportion of F and TSLA.
without any share swapping.
One caveat moving forward is TSLA has China headwinds, with COVID lockdowns
and the geopolitical uncertainty of the Taiwan situation; F not so much could
easily trump technicals. Additionally, it could help explain why Musk liquidated
$ 6 Billion in shares. NASDAQ:TSLA

Stablecoin DominanceStablecoin Dominance is a measure of crypto market sentiment. It is calculated as the percentage of the total crypto market cap that is comprised of stablecoins. A decreasing value signals a risk-on market while an increasing value is a sign of risk-off conditions. USDT, USDC, BUSD, and DAI are the stablecoins selected for the calculation.

Bitcoin Detailed Top-Down Analysis - Day 39Hello TradingView Family / Fellow Traders. This is Richard, as known as theSignalyst.
39 out of 500 days done.
I truly appreciate your continuous support everyone!
Let me know if you like the series, and if you would like me to change or add anything.
Always follow your trading plan regarding entry, risk management, and trade management.
Good Luck!.
All Strategies Are Good; If Managed Properly!
~Rich

TOTAL CRYPTO MARKET CAP - MEDIUM TERM - 28 JULY 2022CRYPTOCAP:TOTAL in August will enter in strong accumulation phase. Some traders and analyst looking for lower lows over 600-650B total market cap. If this scenario happens BTC will be over 13"000, ETH over $600, but strong price action in this moment is really naive to be ignored. Many institutions are out, many whales are still under the water - some dive even deeper.
In crypto you definitely need a strong conviction and medium term vision. You can check my Related Medium term ideas about ETHBTC and #Bitcoin
If you have any questions related to this trading idea I will be happy to provide you with answers.

👀 That's how I see the market on 26.07👀 That's how I see the market on 26.07
BNB locally fell out of the pattern. We don’t trade TA, because as you can see, before that, he cunningly shaved TA traders in the opposite direction. It's not even surprising anymore 😅
EOS on spot. It fell out of the wedge in a Week, then returned. The potential is huge, see posts above. I buy a little every day ⚡️
BTC also violated TA rules. Previously, it hit the previous support and went down. MM is just collecting liquidity 🤔
Market CAP has previously been directly on support, below is huge liquidity. You should not forget about this, because MM only thinks about it 📮
The global economy is in 💩. From this, the crypto should only grow, but no, something has changed. Nevertheless, buy on spot every day in parts in the coming month - we have a clear understanding of the global.

What is going on? (Macro Scale)We all know that Btc is sucessfully retesting it's downtrend which it has broken through yesterday and this claims that ongoing upward movement will continue..
But what about other data? What does macro scale other than BTC chart telling us?
1.DXY: is on the way back to it's 1w support which is 104.0366 so i expect it will continue to decline at least till that support which is good for crypto market.
2. USDT.D: is on the way back to it's daily support 5.81% which is also good for crypto market till it reaches it's support
3.BTC.D: is on the way back to it's daily support which is 41.42%. If BTC.D is declining when BTC is going up, altcoins will pump up more than BTC.
4. Total Cap: is going up to it's daily resistance 1.16T which is obviously good for crypto market
5. Total 2: is going up to it's daily resistance which is 612.747B which favors the idea that altcoins will pump more than BTC.
6.ETH/BTC: is very near to it's daily resistance which is 0.71526. I think this is the most important thing. I am asking that when the macro economic conditions are all against an increase in crypto market why BTC is increasing? But remember first ETH rose up than BTC and other coins followed this time.. That' s just after the announcement of merge date which is on September. So we can say that ETH is leading the market this time. So if ETH/BTC breaks the resistance of 0.71526 we will see a very good times in short to medium term but if ETH/BTC resistance stops ETH'S leading we will be back to boring sideway movements.
We will see..

LITECOIN to Take $19 Billion From The TOTAL2 Altcoin MarketcapWe have a Bullish 3 Line Strike as well as a Tweezer Top Visible on the Monthly Timeframe which would Currently put LTC on a path to take atleast a 3.7% Market Cap Dominance over the Total2 Crypto Market Cap which at TOTAL2's current USD value would put LTC at a Market Cap of atleast $19 Billion which is a little over 11 times more than it's current Market Cap; Assuming that the Circulating Supply of LTC remains near where it is, that would imply that the LTC/USD price will go up to around $584.85 per coin of this TOTAL2/LTC chart were to play out.

MARKET CAP BTC MARKET CAP ANALYSIS:
I introduce with this new type of analysis on market capitalization an important concept to study about the behavior of the blockchain as part of the future economy. Soon we will compare the capitalization of Bitcoin with that of the Crypto market in general.
Introducing a new indicator through the RSI and the MACD, new concepts such as oscillation energy and market pressure, directly related through mathematical tools to price and volume action.
--------------------------------------------------------
Introduzco con este nuevo tipo de análisis sobre la capitalización de mercado un concepto importante a estudiar sobre el comportamiento de la blockchain como parte de la economía futura. Proximamente compararemos la capitalización de Bitcoin con la del mercado Crypto en general.
Introduciendo un nuevo indicador mediante el RSI y el MACD nuevos conceptos como energía de oscilación y presión de mercado, relacionadas directamente mediante herramientas matemáticas a la acción del precio y volumen.

Altcoins could see more pain as Feds keep up Interest rate hikesUsing a 4 hourly chart. Unfortunately, as we move into this bear market with all of the recession and inflation fears we will continue to see a drawdown in crypto prices. As I posted recently on a hidden bearish divergence with the Altcoin market cap chart we are starting to see a pullback already. I have a fractal for illustrative purposes only and as a visual of what can happen price-wise. Inflation numbers come out July 13th and then after this we will know how aggressive the Feds will be with the next rate hike.

Last dip coming soon.This chart shoes Crypto cap analysis. Which show market is going in a downtrend and there is no support till zone 850-825.
I think it's gonna take one more dip which can be the last buying opportunity. So be ready for your last chance to grab coin at cheaper price.

Altcoins Bearish Hidden DivergenceWe are posting a Hidden Bearish Divergence on the daily chart with Altcoin Market Cap.

Total Cryptocurrency Market Cap. Going Above 1.5B (75% Jump)The cryptocurrency market is starting to slowly recover after many months of strong bearish action.
We saw literally the worst period ever for Bitcoin since its inception... The recovery can be strong.
Up to 75% the TOTAL cryptocurrency market cap. can grow.
That's above $1,500,000,000...
This can turn into incredible growth.
Plan ahead and be prepared.
The summer will bring a stop to all the market blood.
In the summer we go green with the trees.
Namaste.

TOTALMCAP - Bear Market RallyTwo charts for the TOTALMCAP, on the left excludes BTC
The left chart shows a bottom along 3.618, this may cause a breakout that coincides with a bear market rally
The right further shows this with vertical lines representing bull market and bear market periods, we are currently at the bear market rally stage
This aligns also with the 200MA which should also hodl

Total Market Cap to 254B by September ( Chart #6 )Having linked the Bitcoin chart since its inception with Ethereum, Total Market Cap and ETH/BTC
All charts will be released successively

Crypto's previous market cap high Market cap is heading back down again to test the last high of the 2017 bull run. Approx 763b market cap was the last bull market high.
With BTC having already breaking the last bull run high for the first time ever, will we see the market cap of crypto do the same?
if we do my prediction is BTC will drop to at least 12k and ETH to at least $700 but I am hoping it will drop to $300 drop which will line up perfectly with its usual percentage drop of around 94%.

Crypto TOTAL MarketCap - Line in the sand...762b?20k BTC has the psychological level but imo this is the level traders should be watching (and we see you $DXY )
Keep eyes on this 762b TOTAL marketcap level and the deep black hole we enter if we drop out.
I keep banging the table on the CME BTC FUTURES chart. When/If the historical meme BTC charts are invalidated we shall see the importance of the CME BTC macro uptrend
CME gaps below us all the way down to 9700. Gap at 17-18 has not technically filled due to the long holiday weekend. gl hf
______________________________________________________________________________________________________________________
This content is for informational, educational and entertainment purposes only. This is not in any way, shape or form financial or trading advice.
Good luck, happy trading and stay chill,
2degreez

future of BTC ( Is it possible to see zero? yes but...) I want to say that bitcoin may be zero, but let's use our previous data to see what is going to happen to bitcoin?
We have to admit that we are in a downtrend that I think has come a long way but has not yet reached the end of the road and given the price history we can expect it to bother the holders again and it is normal when the BTC pair is The US dollar.
In smaller timeframes, especially weekly with the loss of the moving average of 200, I, like many of you, am worried about the future of bitcoin, so I came to higher timeframes to see history in a bigger sight and the important prices (price ranges) that We have to be better able to monitor it.
I do not give an opinion against the downward trend and I do not have a recommendation to buy yet, but within the limits specified in the chart, you can make your purchase with your own analysis, or if you have bitcoins, consider capital management in those areas.
This cycle check is used only for estimation and has no signal for buying and selling. By starting to receive the signal in lower timeframes, you can decide to buy or sell in the specified ranges.
