DOT (Polkadot) Coin {Market Cap} Analysis 10/04/2022Fundamental Analysis:
Polkadot is an open-source sharded multichain protocol that connects and secures a network of specialized blockchains, facilitating cross-chain transfer of any data or asset types, not just tokens, thereby allowing blockchains to be interoperable with each other. Polkadot was designed to provide a foundation for a decentralized internet of blockchains, also known as Web3.
Polkadot is known as a layer-0 metaprotocol because it underlies and describes a format for a network of layer 1 blockchains known as parachains (parallel chains). As a metaprotocol, Polkadot is also capable of autonomously and forklessly updating its own codebase via on-chain governance according to the will of its token holder community.
Polkadot provides a foundation to support a decentralized web, controlled by its users, and to simplify the creation of new applications, institutions and services.
The Polkadot protocol can connect public and private chains, permissionless networks, oracles and future technologies, allowing these independent blockchains to trustlessly share information and transactions through the Polkadot Relay Chain.
Polkadot’s native DOT token serves three clear purposes:
staking for operations and security,
facilitating network governance,
bonding tokens to connect parachains .
Polkadot has four core components:
Relay Chain: Polkadot’s “heart,” helping to create consensus, interoperability and shared security across the network of different chains;
Parachains: independent chains that can have their own tokens and be optimized for specific use cases;
Parathreads: similar to parachains but with flexible connectivity based on an economical pay-as-you-go model;
Bridges: allow parachains and parathreads to connect and communicate with external blockchains like Ethereum.
Following the network’s redenomination after a referendum on Polkadot, DOT balances increased by 100, so one old DOT was equivalent to 100 new DOT. This meant that the initial maximum supply of 10 million old DOT in August 2020 became 1 billion new DOT tokens. The redenomination was undertaken purely to avoid the use of small decimals and make calculation easier. While all balances were increased by a factor of one hundred, this did not impact the distribution of DOT or holders’ proportional share.
Polkadot’s first initial coin offering (ICO) was held in October 2017, and the Polkadot price was $0.29, with 2.24 million tokens offered. The second ICO was held in July 2020, and the Polkadot price offered was $1.25, and 342,080 DOT tokens were sold.
The current CoinMarketCap ranking is #12, with a live market cap of $19,263,288,614 USD. It has a circulating supply of 987,579,315 DOT coins and the max. supply is not available.
Technical Analysis:
Looking at the Market Value and Fluctuation Patterns in historical data of the Asset from Jan 2021, we can see there has been a completed Cycle with ATH: 47B$ , thus retracement to 10B$, followed by 3 Months of Re-Acumulation Phase till End July 2021, which developed the New Cycle with its New ATH of Approx. 55B$, followed by Market Cap Correction to 14B$ which is Below the 61.8% level of Fibonacci retracement of 0 to the Latest ATH (55B$). this means the Capital has Been accumulatiing since its retracement for its 3th cycle which can have the new ATH of 160B$.
There exist the Hidden Bullish Divergence of Market Cap Value and MACD at the 4 Hours Time Frame , which is the very Significant sign of Bullish Trend Continuation which eventually Start the new Bullish cycles.
As the Capital Accumulation Start its Bullish trend From these kind of Discounted Zones such as Fib 61.8 or lower , we can Rationally expect the ATH to be easily Achievable and ultimately developing the new cycle thus new ATH.
There are Total of 3 Targets defined by the Average Confluences of the Fibonacci Expansion and Fibonacci Trend Base Extension. these confluences Points can even be counted as the Major Pivot Points .
The 3 TP gets its confirmation as the Bullish trend Triggers the 2 TP followed by some Market Cap correction and Reaccumulating. on its Up Formation rally.
Marketcap

What If USDT.D back to Up trend ?🟢USDT.D
📊 Daily
✍USDT Dominance Update:
WHAT IF????
What if USDT.D bounces back towards the upper trendline? It will be an 18% gain which will be bad for BTC and other altcoins in a higher timeframe.
Note: This is a daily chart, a higher timeframe where the market will fluctuate several times on lower time frames. This means we can do scalping on various altcoins.
So be ready.
⚠DYOR
✍ Analyzed by Hossein
📊04.10.2022

$xmr #monero $btc 2.79B-3.65B 2021 jan open high level.
7 march buy the fcking dip $xmr usdt(2.79B)
9 march top the sell usdt$xmr (3.65B)
rebuy 26 march 3.65B above push up 2022 year open level(4.26B)
today if hold 4.26B level first target jan high 4.59B ok? step by step if above jan high 4.59B fly mode on for $xmr...
enjoy it.....

TOTAL2 - We are quite safe from BearsThe 50MA is protecting us from Bears
This 50MA on this Weekly timeframe will most likely hodl and lead to a big price hike in price
Simple yet effective Analysis

total3 crypto marketcapmaybe retest 705B level and hold up this zone..
if break 705B level confirmed bear season for altcoins...
step by step first 705B hold second 838B level attack maybe break and hold everything will pump..:)))))

market cap usdt dominanceAs I expected, after breaking the trend line, a pull back occurred. The downtrend will continue to go up to 3.4.

Btc1! Daily CME GAP Analysis Update🟢#BTC Update
Price currently in consolidation phase with frequent liquidity grabs and stop hunts. We also had BTC filling a CME gap earlier which is a good sign for expecting a move upwards, we have also successfully reed D1 200 EMA which is a good sign as well since a re is very important for market to gain back momentum.
Weekly closure will clear out things further and we can possibly expect a move sooner, where breaking through and holding above our first resistance at $47300 approximately will be a bullish sign.
Analyzed by Hossein
📅 04.04.2022
⚠️ (DYOR)

Why I am NOT holding BITCOINThis above is the well known Bitcoin Dominance chart. It keeps making lower lows and lower highs.
I hold zero BTC in my portfolio.
In the scope of an investor, there are plenty other cryptos with much more potential. Bitcoin remains the safest cryptocurrency with its proof of work, but people are starting to understand that it has very limited use cases, very slow transaction speed, and cannot scale. In short, it is getting old and it is harder to get returns like 2x by holding BTC (that would mean a 100k BTC right now).
The FLIPPENING didn't happen, yet. But it is getting closer.
Current BTC marketcap is 882B while ETH is 420B.
We can't see much information on this chart, that is why I coded a simple indicator that put into perspective the progress of ETH getting over BTC in market cap. (You can get it on my profile scripts page)
The chart shows Bitcoin marketcap divived by Ethereum marketcap. On September 2019, Bitcoin's MarketCap hits ATH against ETH, by being 10 times bigger. Today, the ratio is about 2x only. When this ratio drops below 1, the FLIPPENING will happen.
We can easily draw a descending channel on the daily. This helps forecast an approximative date for said FLIPPENING: IF WE REMAIN IN THIS CHANNEL, THE FLIPPENING WILL HAPPEN BEFORE FEBRUARY 2023. A breakout is possible, but rather unlikely.
My point is: I don't want to miss the train. Some cryptocurrency projects are building the future of the internet RIGHT NOW, and bitcoin isn't. It is going to be replaced.
I will then be looking at some of the biggest layer 1 opponents which are popping off right now. I like to call them Bitcoin Destroyers.
Here is 8 of them:
All of them are beating Bitcoin right now and could stand a chance at replacing him in the long run.
Not financial advice, do your own research.

AVAX (Avalanche) Coin {Market Cap} Analysis 03/04/2022Fundamental Analysis:
Avalanche is the fastest smart contracts platform in the blockchain industry, as measured by time-to-finality. Avalanche is blazingly fast, low cost, and eco-friendly. Any smart contract-enabled application can outperform its competition by deploying on Avalanche.
Avalanche launched on mainnet, September 21, 2020. Since then, the platform has grown to secure over 450+ individual projects, $118M+ of AVAX burned (reducing supply), 1,350+ individual block-producing validators, and over 1.5M+ community members around the globe.
AVAX is the native token of Avalanche. It is a hard-capped, scarce asset that is used to pay for fees, secure the platform through staking, and provide a basic unit of account between the multiple subnets created on Avalanche.
The total supply of AVAX is 720 million. Its token distribution is as follows:
2.5% - seed sale, with 10% released on mainnet launch and the rest being released every three months.
3.5% - private sale, with 10% released on mainnet launch and the rest being released every three months.
10% - public sale, with 10% released on mainnet launch and 15% released every three months over a period of 18 months.
9.26% - allocated to the foundation, released over ten years.
7% - community endowment, released over twelve months.
0.27% - testnet incentive program, released over one year.
5% - strategic partners, released over four years.
2.5% - airdrops, released over four years.
10% - team, released over four years.
50% staking rewards
Staking AVAX currently provides an annual reward of 11.57%, with the minimum time for staking being two weeks with a minimum of 2,000 AVAX.
The current CoinMarketCap ranking is #10, with a live market cap of $26,215,418,498 USD. It has a circulating supply of 267,355,674 AVAX coins and the max. supply is not available.
we have already Analyzed the AVAX (Avalanche) Coin Asset, you can read more Fundamentals and understand the Project:
Technical Analysis:
Looking at the Price Value and Fluctuation Patterns in historical data of the Asset from Jan 2021, we can see there has been a completed Cycle with ATH: 60$ , thus retracement to 8$, followed by 3 Months of Re-Acumulation Phase till Mid August 2021, which developed the New Cycle with its New ATH of Approx. 145$, followed by Price retracements to 50$ which is the 61.8% level of Fibonacci retracement of 0 to the Latest ATH (146$). this means the Price has Been accumulation since its retracement for its 3th cycle which can have the new ATH of 430$.
There exist the Hidden Bullish Divergence of Price Value and MACD , which is the very Significant sign of Bullish Trend Continuation which eventually Start the new Bullish cycles.
As the price value Start its Bullish trend From these kind of Discounted Zones such as Fib 61.8 or lower , we can Rationally expect the ATH to be easily Achievable and ultimately developing the new cycle thus new ATH.
There are Total of 3 Targets defined by the Average Confluences of the Fibonacci Expansion and Fibonacci Trend Base Extension. these confluences Points can even be counted as the Major Pivot Points .
The 3 TP gets its confirmation as the Bullish trend Triggers the 2 TP followed by some Price correction and Reaccumulation. on its Up Formation rally.
Currently the Price Value is at 38.2% Fibonacci retracement level; it means it has broken the resistance level and had rechecked it backed and it has been Proved to be the support area .

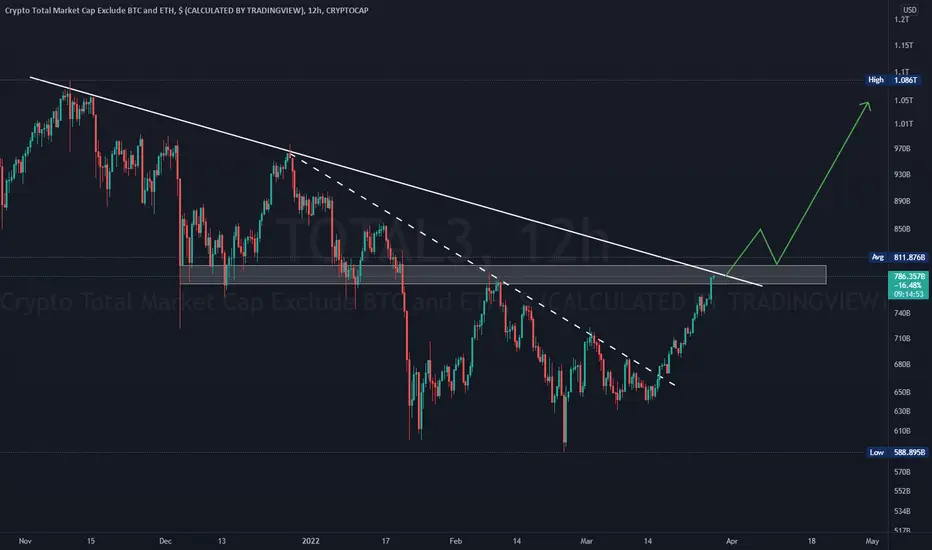
An ABCD BAMM Hints $540B Will Be Added to Small & Mid Cap CoinsThis is total 3 and it tracks the total market cap of all the Cryptocurrencies combined Excluding BTC and ETH and there is currently Hidden Bullish Divergence on the weekly and a potential AB=CD Pattern in development that if it plays out would add around 540 Billion Dollars to the Total 3 market cap taking us to the top of the channel where we may then face a greater reversal.

SOL (Solana) Coin {Market Cap} Analysis 03/04/2022Fundamental Analysis:
The Solana Foundation has announced that a total of 489 million SOL tokens will be released in circulation. At the moment, about 325,986,609.90 SOL of these have already entered the market.
The SOL token distribution is as follows:
16.23% went towards an initial seed sale,
12.92% of tokens were dedicated to a founding sale,
12.79% of SOL coins were distributed among team members,
10.46% of tokens were given to the Solana Foundation.
The remaining tokens were already released for public and private sales or are still to be released to the market.
Solana price during the initial seed sale, held on April 5, 2018, was $0.04. Given the recent ATH, that represents an impressive 5400X return on investment (ROI).
The current CoinMarketCap ranking is #6, with a live market cap of $44,775,942,866 USD. It has a circulating supply of 325,986,610 SOL coins and the max. supply is not available.
Technical Analysis:
There exist Bullish Divergence of Price Value and MACD , which the sign of bearish trend reversal and start of the new Bullish trend which may lead to the new Economical Cycle.
There are Total of 3 Targets defined by the Average Confluences of the Fibonacci Expansion and Fibonacci Trend Base Extension. these confluences Points can even be counted as the Major Pivot Points .
The 3 TP gets its confirmation as the Bullish trend Triggers the 2 TP followed by some Price correction and Reaccumulation. on its Up Formation rally.
Currently the Price Value is at 48.6% Fibonacci Retracement level from its ATH; it means that, it has broken the 61.8% Fibonacci Retracement as the Resistance level and had rechecked it backed and it has been Proved to be the support area .
The Fibonacci Tools have been Drawn From 0$ to the ATH, so the Specified Levels are well Defined and Proved.
The Asset is at the Accumulation Level Currently, which means soon the smart money will Flow in it and the Price Value will get Pump and Appreciates.
Probably we may not again see this 78.6% Fibonacci Retracement Level or bellow in the current cycle.

COMP (Compound) Token {Market Cap} Analysis 03/04/2022Fundamental Analysis:
Like many digital assets, only a fixed number of COMP tokens will ever come into existence. The total supply is capped at 10 million COMP and as of writing, less than a third are in circulation (~3.3 million).
Out of these 10 million tokens, just over 4.2 million tokens will be distributed to Compound users over a 4-year period. The second biggest allotment (almost 2.4 million COMP) goes to the Compound Labs, Inc shareholders, whereas 2.2 million tokens will be distributed to the Compound founders and current team with a 4 year vesting schedule.
Finally, 775,000 COMP are reserved for community governance incentives and the remaining 332,000 tokens will be allocated to future team members.
The exact rate of COMP emission is subject to change over time, as voters are able to increase or reduce the emission rate by passing a proposal through community governance.
The current CoinMarketCap ranking is #90, with a live market cap of $1,021,434,119 USD. It has a circulating supply of 6,686,099 COMP coins and a max. supply of 10,000,000 COMP coins.
Technical Analysis:
There exist Bullish Divergence of Price Value and MACD , which the sign of bearish trend reversal and start of the new Bullish trend which may lead to the new Economical Cycle.
There are Total of 3 Targets defined by the Average Confluences of the Fibonacci Expansion and Fibonacci Trend Base Extension. these confluences Points can even be counted as the Major Pivot Points .
The 3 TP gets its confirmation as the Bullish trend Triggers the 2 TP followed by some Price correction and Reaccumulation. on its Up Formation rally.
Currently the Price Value is at 78.6% Fibonacci retracement level; it means it has broken the 78.6% Fibonacci Retracement as the Resistance level and had rechecked it backed and it has been Proved to be the support area .
The Fibonacci Tools have been Drawn From 0$ to the ATH, so the Specified Levels are well Defined and Proved.
The Asset is at the Accumulation Level Currently, which means soon the smart many will Flow in it and the Price Value will get Pump and Appreciates
Probably we may not again see this 78.6% Fibonacci Retracement Level or bellow in the current cycle.

FIL (Filecoin) Coin {Market Cap} Analysis 02/04/2022Fundamental Analysis:
Protocol Labs describes Filecoin’s tokenomics, or economic model, as a “market for data” where users can sell their storage space to other users, who are looking to rent. Five stakeholders will be able to trade tokens: developers, clients, miners, token holders and ecosystem partners. There will also be three Filecoin markets, according to Protocol Labs: file storage, file retrieval and on-exchange token trading.
In fall 2020, 400 miners participated in what was called the “Space Race” testnet phase, increasing Filecoin’s network data capacity by over 325 pebibytes; approximately 3.5 million FIL tokens will be released to the Space Race participants.
The current CoinMarketCap ranking is #37, with a live market cap of $4,752,814,707 USD. It has a circulating supply of 185,777,188 FIL coins and the max. supply is not available.
Technical Analysis:
There are Total of 3 Targets defined by the Average Confluences of the Fibonacci Expansion and Fibonacci Trend Base Extension. these confluences Points can even be counted as the Major Pivot Points .
The 3 TP gets its confirmation as the Bullish trend Triggers the 2 TP followed by some Price correction and Reaccumulation. on its Up Formation rally.
Currently the Price Value is at 78.6% Fibonacci retracement level; it means it has broken the 78.6% Fibonacci Retracement as the Resistance level and had rechecked it backed and it has been Proved to be the support area .
The Fibonacci Tools have been Drawn From 0$ to the ATH, so the Specified Levels are well Defined and Proved.
The Asset is at the Accumulation Level Currently, which means soon the smart many will Flow in it and the Price Value will get Pump and Appreciates
Probably we may not again see this 78.6% Fibonacci Retracement Level or bellow in the current cycle.

UNI (Uniswap) Token {Market Cap} Analysis 02/04/2022Fundamental Analysis:
The total supply of Uniswap’s governance token, UNI, is 1 billion units. These will become available over the course of four years, after which Uniswap will introduce a “perpetual inflation rate” of 2% to maintain network participation.
Token distribution currently consists of the following: 60% to Uniswap community members, i.e. users, 21.51% to team members, 17.8% to investors and 0.69% to advisors. The latter three distributions will occur according to a four-year vesting schedule.
Out of the majority set to go to users, 15% can be claimed by those who used Uniswap prior to Sep. 1, 2020. These even include users who submitted transactions which were never successful — they are eligible for 400 UNI.
The UNI token serves the purpose of enabling shared community ownership in the growth and development of the decentralized protocol. This allows UNI holders to participate in the governance of the Uniswap protocol and wider ecosystem, in a neutral and trustless manner. The success and adoption of Uniswap products will positively impact Uniswap price, hence incentivizing token holders to contribute to the self-sustaining development of the ecosystem.
Four years after the UNI token launch, in September 2024, a perpetual inflation rate of 2% annually will take effect. This is to ensure that participation in the Uniswap ecosystem continues, by disincentivizing passive holders.
The current CoinMarketCap ranking is #24, with a live market cap of $8,210,903,997 USD. It has a circulating supply of 689,033,313 UNI coins and a max. supply of 1,000,000,000 UNI coins.
technical Analysis:
The market Cap is currently at the Accumulation Phase which is the phase of Smart Money Inflow and lets the Institutional and High Net Worth investors to Step in which leads the Cycle and Push the Price Value of the said Asset to higher levels.
There exist Bullish Divergence of Total Value and MACD which the sign of bearish trend reversal and start of the new Bullish trend which may lead to the new economical cycle.
There are Total of 3 Targets defined by the Average Confluences of the Fibonacci Expansion and Fibonacci Trend Base Extension. these confluences Points can even be counted as the Major Pivot Points .
The 3 TP gets its confirmation as the Bullish trend Triggers the 2 TP followed by some value correction and Reaccumulations, on its Up Formation rally.
Currently the Total Value is at 78.6% Fibonacci retracement level, it means, it has to break many resistance levels and shall rechecked them backed and it has to Prove them to be the Accountable Support Areas.
Probably we may not again see this 78.6% Fibonacci retracement zone or bellow...
66B $ is a fare target for this assets Market Capitalization.

XMR (Monero) Coin {Market Cap} Analysis 01/04/2022Technical Analysis:
There exist Bullish Divergence of Total Value and MACD which the sign of bearish trend reversal and start of the new Bullish trend which may lead to the new economical cycle,
There are Total of 3 Targets defined by the Average Confluences of the Fibonacci Expansion and Fibonacci Trend Base Extension. these confluences Points can even be counted as the Major Pivot Points .
The 3 TP gets its confirmation as the Bullish trend Triggers the 2 TP followed by some value correction and Reaccumulations, on its Up Formation rally.
Currently the Total Value is at 61.8% Fibonacci retracement level; it means, it has broken the resistance level and had rechecked it backed and it has been Proved to be the support area .
Probably we may not again see the 61.8% Fib or bellow...
27.5B $ is a fare target for this assets Market Capitalization.

market cap usdt dominancedominance usdt finally breaks his uptrend line and we can see a different coin growth.

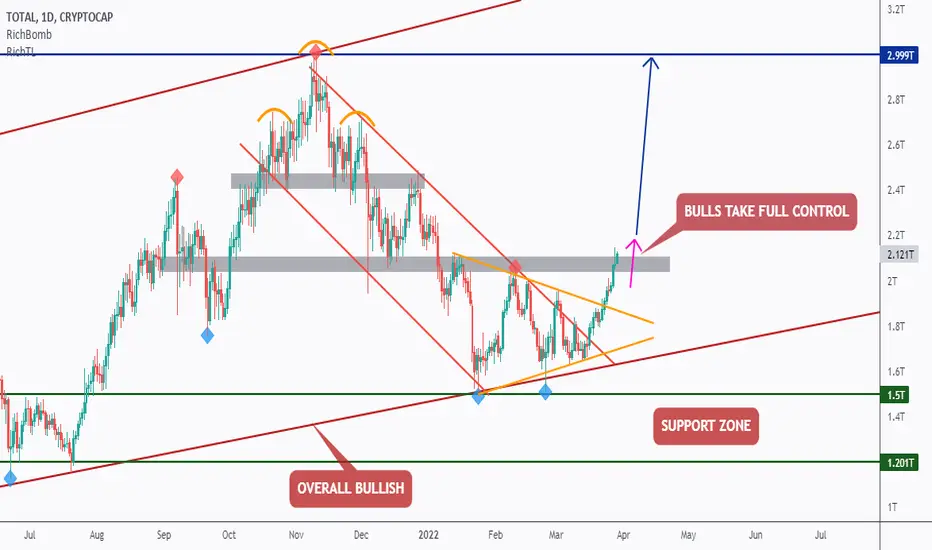
TOTAL - One More CheckPoint To Go!Hello TradingView Family, this is Richard, as known as theSignalyst.
I usually keep an eye on TOTAL to get a feeling about the overall crypto market bias. Just like I keep an eye on DXY when it comes to Forex.
The bulls are clearly pushing the past 2 weeks , after rejecting our lower bound/brown trendline and green support.
Then the bulls took control from a short-term and medium-term perspectives by breaking above the last minor highs, the upper red trendline, and the upper orange trendline.
As mentioned in my previous posts many times, for the bulls to take over from a long-term perspective, we need a momentum Daily candle close above the last major high marked in gray.
" One More CheckPoint To Go!"
Interesting Times Indeed!
Always follow your trading plan regarding entry, risk management, and trade management.
Which scenario do you think is more likely to happen? and Why?
All Strategies Are Good; If Managed Properly!
~Rich
#Altcoin MarketCap TOTAL3 after breaking the small daily trendline now its ready to break above the massive trendline.
Expecting another wave to start after this breakout!
$BTC MARKET CAPBitcoin Market Chart Analysis: $160 Billion is not going to hurt anybody, Pump it Bogandoff.

total market cap breakout, bullish indicationit is seen that the Symmetrical Triangle of total market cap on 1Day chart is breakout, if it keeps on going up the it will be very bullish for btc and some other major altcoins

The possible path of bitcoin movementAfter passing the positive and negative news, finally moving towards 50k seems to be the right path.
The situation of the market cap should also be considered
Valid channel status

Total Crypto Marketcap based on Expanding Cycle TheoryIf the Expanding Cycle Theory proves to be correct and we peak out in November 2022 (give or take could happen earlier or later in the year), this is what we could be looking at with all crypto hitting over 11.2 Trillion in value. This scenario will put Bitcoin at or around a 4 to 5 Trillion market cap while Altcoins having the dominance will have the remainder of Lion's share. I am using the Shift Pitchfork along with a fractal and an ascending channel. I am also using the Beam band to give us a possibility of future direction if Bitcoin hits the top of its Beam band. This is all speculation as we do not know the exact peak or blowoff top for Crypto on this bull cycle as the patter has now changed.
If you are interested in the Expanding Cycle Theory please visit Datadash on youtube and also Benjamin Cowen and they both have similar points.

200 Trillion Market Cap. 2025-27We say the total cryptocurrency market capitalization will go beyond 200 Trillion in just a few years, 2025 - 2027.
What do you think?
It will be 100% certain, just a little higher.
Share your thoughts in the comments section.
Thank you for reading.
Namaste.
