waiting to break 1 trillion marketcap (total2)After breaking the 1 trillion mark, the price growth phase seems to begin.
Marketcap

Bitcoin Daily Analysis Update🟢🟢#BTC on daily TF looks messy as it more looks like the price is ranging more. Currently, the price faces strong physiological resistance at 40,000$ and holds the 39,000$ area as support. If the daily candle closes above 40000$ then Expect a strong breakout this weekend. It is so important to keep 36800$ Support By next week we can see some clear direction in it. Use proper stop in all your trades.
⚠ This Analysis will be updated.
✍ Analyzed by AmirHossein.
📆0.3.12.2022

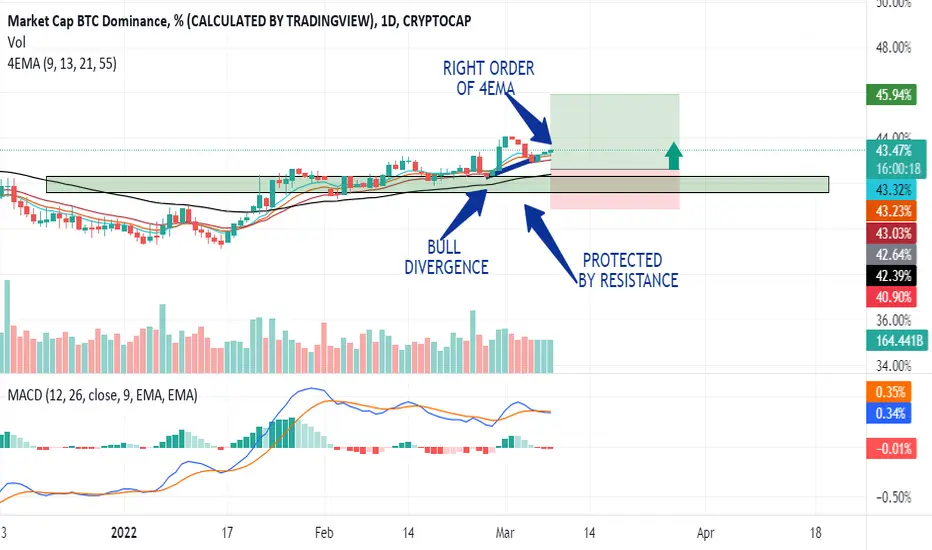
GOOD DAY FOR MARKET CAP DOMINANCE BTC % ✌Good morning,
Today there is an intersection of many strong indicators
First, there is a bull divergence confirmed by MACD😎
Seconde, we are above the VWAP❤
Third, the 4EMA indicator is in the right order and well condensed👌
forth, we are protected by resistance😎
👀 I didn't really study the profit so protected yourself from market reverses!!
Good luck 💖
Bitcoin is Now Worth More Than the Russian RubleAfter the collapse of the Ruble in the wake of Russia's invasion of Ukraine this week Bitcoin has now officially surpassed the Russian Ruble -- according to CoinMarketCap:
"Bitcoin has a market cap of approximately $835 billion while the ruble has a market cap of around $626 billion."
MOEX -- the tracker for the Moscow Stock Exchange went dark after the combination of sanctions and people pulling money out of banks/exchanges went into effect. The country is now in economic turmoil -- some are speculating that even altcoins like Ethereum and Dogecoin may have surpassed Russia as well. (Though the data for it is now available, yet.)
While some countries are currently celebrating the economic "victory" over Russia, some analysts are expressing concern over secondary effects over oil and gas prices, potentially further worsening inflation and supply-chain woes that were already starting to mount all across the globe.
With a US recession looming in the horizon, what does this mean for crypto? So far there hasn't been any indication that the losses of fiat currencies leads to the decline in the asset itself. In the long run, this may prove to be an important factor in how the industry pans out over the next few years.
www.coindesk.com

BTC - Video Top-Down Analysis - Update!Hello TradingView Family / Fellow Traders. This is Richard, as known as theSignalyst.
Here is a detailed update top-down analysis for BTC .
Previous Analysis:
Which scenario do you think is more likely to happen? and Why?
Always follow your trading plan regarding entry, risk management, and trade management.
Good Luck!
All Strategies Are Good; If Managed Properly!
~Rich


KEY Support & Resistance Zones.Let's keep an eye on these key S/R zones.
Don't trade with what you're not willing to lose. Safe Trading, Calculate Your Risk/Reward & Collect!
Love it or hate it, hit that thumbs up and share your thoughts below!
This is not financial advice. This is for educational purposes only.

2.3T MARKETCAP RETEST INCOMINGI believe there should be a retest to 2.3T Marketcap. once we retest the high we should a drop back down to 1.3T sometime later in the year. Canada is gonna be a nice lead up to pushing the Crypto market higher. Blocking peoples bank accounts, now people are going to be looking for other ways around government. War is in the air..........

BITCOIN - What does Fibonacci say?Bitcoin had fallen about 18% since last week when it began to decline. The recent fall of bitcoins has also had a leverage effect on Alts, and almost all Altcoins have fallen during this period. Bitcoin is currently priced at around $ 36,900.
Today's market cap is about $ 1.65 trillion, which is a few percent less than previous days. The trading volume of the last 24 hours was about 108 billion dollars. Bitcoin dominance in the digital currency market is about 42.2%.
Today's Fear and Greed Index of the cryptocurrency market stands at 20, which is in the Extreme Fear range. Last week, with the fall of Bitcoin, this index also increased from the range of 50 to 20.
By drawing the Fibonacci tool on the previous wave of Bitcoin, we can determine the Fibonacci support points on the current wave. Bitcoin has already broken the 61.8% Fibonacci level. If the downturn continues, the 78.6% Fibonacci level could be the following support for Bitcoin.
The 78.6% level in Fibonacci is a strong technical level and may stop the fall. So the next bitcoin support is in the 78.6% Fibonacci range. If bitcoin stops at this level, the high levels will be considered as resistance areas in bitcoin.
If the current price does not recover and does not reach the level of 78.6%, the level of 61.8% will appear as support for Bitcoin, and for further growth of Bitcoin, it will have to make short-term floorings at this level.

Total Market Cap 1D Analysis🟢The TOTAL marketcap is heading towards the major support of $1.5 trillion area. TOTAL cap need to hold this support otherwise we see heavy dump in market.
⚠ This Analysis will be Updated
📅 02.21.2022
⚠️ (DYOR)

TOTAL - Sooner or Later, The Bulls Would Take Over!Hello TradingView Family, this is Richard.
I usually keep an eye on TOTAL to get a feeling about the overall crypto market bias. Just like I keep an eye on DXY when it comes to Forex.
As per my last TOTAL analysis, we are still bearish trading inside the red channel.
WEEKLY: Technically we are trading inside that big brown channel, and we are currently in a correction phase after rejecting the upper bound / brown trendline and 3T round number.
DAILY: After breaking below the head and shoulders neckline, marked in gray, the bears took over and TOTAL started trading inside the red channel, making lower highs and lower lows.
That being said, we know that we are overall bearish , but what are the possible scenarios?
Scenario 1: Projection in Blue
A sudden shift in momentum, by an aggressive movement from here to break above the current last high.
Scenario 2: Projection in Purple
TOTAL trades lower to test the support again and forms a new swing high around the upper red trendline. Then the bulls would take over by breaking above that new high.
Which scenario do you think is more likely to happen? and Why?
All Strategies Are Good; If Managed Properly!
~Rich

BItcoin 4H Analysis🟢 In a 4hour time frame bitcoin have successfully broken down the Double Top neckline whereas also support Key level marked as NECKLINE and retested out below the zone level
An Order block can be seen at the level of 39k$ to 37k$ whereas the volume profile shows the low volume around we might see the price there as well.
Use the appropriate loss limit for your trades, which has a very high possibility of emotional movement in the market.
⚠ This Analysis will be updated.
--------------------
Amir Hossein
📅 02.20.2022
⚠️ (DYOR)

USDT.D Daily Analysis🟢USDT's dominance bounced from the uptrend line support to form a twin floor pattern and is now above the neckline of this pattern, which also acts as a support. If the retest is successful, it is expected to move upwards, which will be a sign of decline for the market because the USDT and BTC dominance are inversely related to each other.
Use the appropriate loss limit for your trades, which has a very high possibility of emotional movement in the market.
⚠ This Analysis will be updated.
Amir Hossein
📅 02.19.2022
⚠️ (DYOR)

TOTAL3 is getting primed for a launch again!check out the notes on the chart for details.
TOTAL 3 is priming up every hour that passes. this is the 3 day chart and its exgemely bullish...the chart has now a nice cup and handle formed and ready to pop

ETH market cap forming a bullish pattern? Hello traders,
Man, there is just bearish news after bearish news it seems lately, I mean, WW3 amirite? Well, the geopolitical mess aside, I firmly believe that this run is not only not over but, far from it.
This ascending triangle that is possibly forming on Ethereum market cap coincides with this theory. If we get more buyers coming into the market pushing the market cap to breakout of the top resistance line in betting we will have a nice big old pump in our future.
Let me know your thoughts in the comments!
Savvy

TOTAL - One More CheckPoint To Go!Hello everyone, if you like the idea, do not forget to support with a like and follow.
Here is the top-down analysis for TOTAL, feel free to request any pair/instrument or ask any questions in the comment section below.
Best of luck!

total market cap chart ops !! be careful i think we going to hit the targets below. that could effect on BTC might be 3900 or less

total market cap chart here is the TMC chart we see here that we should NOT break the yellows line if we want to go to the moon. for now I think we going to have regulars flat ( continuing pattern ) but first we going down to touch the below line at ( 1.928 ) first them ( 1.916 ) after that we ready to fly to get more money for our currencies to increase. again please god i hope not touching the yellows line.

IS THIS BULL MARKET OVER ? Not yet here's what you need to know!I'll just keep it short,
USDT.D is hitting the long-term resistance around 4.87.
Break above and close above this level means the beginning of the bear market which will eventually lead to the break below the 30k level.
Whereas, rejection could take BTC to $43k+ level again.
$35k also happens to be monthly support which makes it quite important.
if BTC manages to hold $35k by Jan month's close the cycle will stay intact.
Currently, there's too much manipulation in the market and things are still uncertain.
This chart is the best indicator for the market direction.
Better use it in HTF.
Rejection is the key to new ATH, less likely but still possible as long as BTC is trading above $28k to $32k area.
What to do?
Wait for the right time.
We have been sitting aside and waiting for the right time to trade since BTC broke below $53k.
This decision helped us to save a lot of funds.
Your priority should be to protect your funds and avoid leveraging here.
My message to you will be to relax and Don't stress too much about money
Try to get engaged in things you love, it could be going on vacations, trekking, learning some new hobbies, hitting the gym.
Just take your time and don't give up!
Thanks for reading.

This need to break.If the total market cap is above 2.05t within 2 week then btc will create new all time high.
Until thene don't take trade with high levrage and large amount.
I don't prefer trade in alts.
Happy trading 🙂

MARKET CAP TELLING A STORYAs many times as they said it was done.... it wasn't.
As many times as they told us we were feels... We weren't!!
As many times as they held a laugh at our enthusiasm... We kept smiling too...
This is not the end..... This is just the beginning!!!

TOTAL - My Trading Plan in a video!Hello everyone, if you like the idea, do not forget to support with a like and follow.
Here is the top-down analysis for TOTAL, feel free to request any pair/instrument or ask any questions in the comment section below.
Best of luck!

CRYPTO MARKET CAP BULLISH LEVELSWe need to go up to 123 and stay there to be bullish. Also, be aware of the triangle.
