!!BEARISH ATTACK!!Greeting from IRAN to all trading community 💙✔
Total market cap was moving through an ascending channel since 24th March
After a while of struggling, 1.8T dollar major level got broken and total market cap started an attack to reach 2T dollars
2T dollars got broken and green days came for cryptocurrency world
Total market cap has reached a new ATH (~2.2T Dollar) , after that we witness two other attack to this level which both was unsuccessful
Price made a (Triple Top Pattern) and BOOOOM
Bears got control of the market and dropped the chart to its major support level at 1.8T Dollars
It's time for bulls to bring back the market cap above the 2T Dollars
Use these RED DAYS for investing because better days in on the way ....
KEEP IT SIMPLE :)
Marketcap

Bitcoin Marketcap versus Altcoin Marketcap (2017)Bitcoin marketcap vs Altcoin marketcap in 2017, after BTCUSD topped altcoin marketcap gained a incredible 59% in just 21 days!

Total Crypto Market Cap Excl. BTC Escalation in 2021 Bull CycleI use Total Crypto Market Cap Exclude Bitcoin as one of the most important indicator to optimize my exposure on altcoins. It's a great tool that should always be considered.
Where will it top at the end of this bull cycle is the topical question. But my question is how much this new market will be able to erode the market cap of traditional financial markets.

3 week strategy for DOGE to $1 T Market CapWhen dealing in a future's market
look for lengths of consolidation and see
what the average time is spent for those consolidations
this give "an idea" of how long the market takes to correct
-------------------------------------------------------------------------------------------------------------
In the case of DOGE
it looks (more or less)
every time DOGE consolidates (on the 2-day time frame)
it lasts about 10 Bars or 3 weeks
so....we have 3 weeks to work this market!
First we put a nice market order 30% of our position @ 0.36 USD (I always like to have skin in the game)
Place a limit order for @ 0.28 USD which is a 20% drop from Market Price with 20% of our position
- All the most recent bull flags in our bullish continuation pattern
have been supported by the 0.236 on the FIB RETRACEMEN
taken from the initial thrust of volume on April 11th, 2021 top the most recent top which is 50Cent (how cool is that)
********************I am assuming this pattern is a bullish continuation pattern which is the reason behind this trade*************************
(click the link to learn more about the characteristics of a bullish continuation pattern youtu.be )
Last but not least a limit order taking up 40% of your position @ 0.12 USD
Then We Play Futures
for DOGE,
SHORT the price down to the 0.618 (0.12 USD) with 10x leverage using 10% of our position
Since the position closes at 12 cents (-62%) , a 10x short leverage means we get 620% gains
Stop Loss ratio is at a 1:1.5 ratio (Risk/Reward) but feel free to use your own R/R)
62%/1.5 = 41% stop loss = a 50CENT DOGECOIN (how cool is that)
10% position is liquidated
NOW.....
THIS PART IS QUITE COMPLICATED but if you plug in your own numbers you might see it more clearly
the 40% market position has now gained 41%
( 20% position from the limit order at 28 cents could possibly add another 60% )
WE WILL PRETEND IT DIDNTT HIT - this is a worse case scenario
60% of that profit (the 41%) was forfeited from the SHORT which <<<<
leaves 40% left <<<<<<<<<<<<<<<<<<<<<<<<<<<<<<<<<<
40% = 16% gain from of initial investment of the market 40% position
and is also the worst case scenario besides DOGE to ZERO <<<<<<<<<
Because these are special times and life changing moments
(BITCOIN BULLRUN coupled with #Wallstreetbets meets TikTok
we are able to sit and make trades and take profits for insane gains
ALL MY PAPER TRADES WILL HAVE A GOAL TO 200X THE INITIAL INVESTMENT
A market buy has a SELL ORDER IN PLACE at $75 DOGE which is a 200x from market price
the limit buy at 12 cents would have a sell order at $25 which would be 200x from limit price
The 6x that was caught on the way down
could be thrown on 12 cents as well that would be
making your sell order at 200x a lot sooner than $25
Do the math, plug in some numbers
hope you find this useful
DISCLAIMER _ NEVER FINANCIAL ADVISE
This gives me experience on trading futures markets whether I'm right or Liquidated.
Its a very risky probability and because of that
I only use 10% of the position of the total amount I want to buy
After our short is complete a limit order should trigger at 0.12 USD for a 40% lump sum purchase
plus 6x your 10% which is now 50% of your whole position to do what one desires

BTCUSD : NEW POTENTIAL ATH IS COMINGHi to all,
BTC broke its descending correction move in main bullish trend. Now i'm waiting a new ath from BTC between 62.8K & 64.2K in short term.
Bitcoin Dominance is below 56 and at the same time Total marketcap is growing-up over 2bn. It means a new rally is coming at BTC and AltCoins.
58.800$ is the support before this bullish wave. Good Luck to all.
If you find it useful, please support this idea with LIKE and feel free to ask all your questions as a COMMENT.

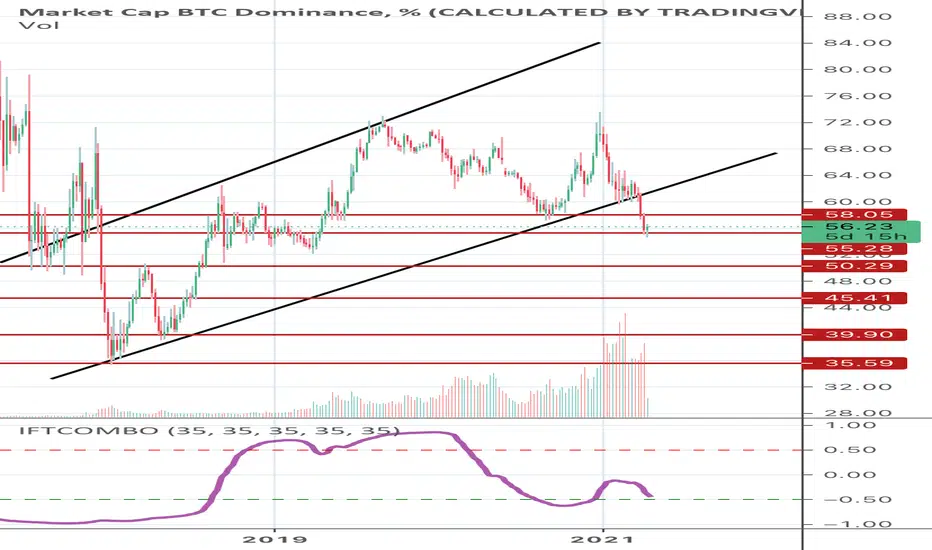
Weekly BTC Dominanceevery BTC move means retest after breaking the big resistance. I expected this breakdown will resume till touching the last resistance.
Alt Coin Macro Total Market Cap Monthly Analysis Alt Coin Macro Total Marketcap Analysis
This is a simple macro chart of the 1 Month Alt Coin Total Market Cap excluding BTC.
In reference to the previous Kraken Wick BTC Dominance chart I did ( ) , I found it interesting that the month of February 2021 with the Kraken Wick is the same monthly candle that broke the previous Alt Coin Total MC ATH. Since then BTC has been losing dominance to Alts.
Another thing I am keeping track of over the next months is the monthly RSI. We have not yet hit the previous ATH RSI resistance line. In my opinion there is still a good probability that the Alt coin total market cap has room for growth.
Another thing to take note of is the previous bearish divergence at points August 2017 and December 2017 created with the Price Action and RSI. I am keeping an eye on a possible scenario of a new bearish divergence forming over the next months as a way of helping detect Topped out conditions.

BNB DominanceAs expected and discussed in my previous ideas,
BNB is and took a lot of dominance in the previous weeks and it is looking like there's still room for growth ahead of us,
The Binance Chain is growing so is it's Market Cap,
One of the top centralized exchanges in terms of trust and liquidity!
A lot of adoption around the Innovation center, ICO's, Lending and sold out DeFi products.

CRYPTOCAP "Road to 2 Trillion... now 4"**Educational Purposes ONLY**
I've been charting the "Road to 2 Trillion". What a ride it has been so far!
Now we march on to $4T as this Bull Cycle continues on.
Looking forward to watching this one play out!
-MUNC3

Entire Crypto market to reach 30 Trillion by at least 2030This is the log scale of the entire crypto market.
Treat your Bitcoin as if it is at a million already because you will look back and wish you did.
While there will be multiple halvings and multiple market cycles if you stay committed, stay focused, and patient you will be rewarded. If you're just trying to get rich you will lose. We are here to serve others and if you only think of yourself and stay selfish your hard earned money will go to those that serve others as Bitcoin will change the way the world works.
Bitcoin will be manipulated.
Bitcoin will be banned.
Bitcoin will be regulated.
But in the end of Bitcoin will replace fiat money as a one world currency and store of wealth and it will upend the current financial system.
In the bible it speaks of a single currency in which all people will use and barter with. Bitcoin is that prophecy fulfilled but it's still in its infancy.
Defi, on/off ramps, ease of use, safety, security, etc. These are all indications of it's fast and continued evolution. Yet it's still only decade old and will last for hundreds of years, much longer than any of us will be alive.
Back in 2011 when I purchased my first Bitcoin it was very difficult. I had to send an email to make a purchase, they sent me a bank account routing and account number I had to deposit fiat into, and in turn sent me my bitcoin. It took a few days to clear and finally I had the bitcoin in my wallet. There were no hardware wallets, no metamask, nothing to really secure your crypto. Mt. Gox wiped out anyone that was really trading back then. It was the wild west and I was primarily using crypto to purchase drugs through 2011-2013 - props to Ross, he was and still is a visionary and maybe someday he will have the opportunity to live free. But even back then I knew Bitcoin was going to change the world. When Coinbase came along I started buying small amounts of BTC and ETH and holding knowing that it was more risky to hold fiat than it was to hold Bitcoin. Bitcoin truly changed my life as it has many early adopters.
The central backs are never going to stop printing money. 2008 was just the beginning and now we are in hyperdrive with the printing, and it will not slow down. It has to speed up to keep the system from failing. Money is truly our life's energy stored and when those in power manipulate it we are all being stolen from. And so finally, there is something we can control without the fear of it being taken away, devalued, or stolen. We are in complete control of our life's energy and it will change the world and give power to the people that choose to take it. In early 2018 I began putting all my business income into crypto, I knew the banks were in control of my money and I grew frustrated with their power. Intuitively, I couldn't keep allowing the system to control me. As a non-conformist i fought back through Bitcoin and in doing that have increased my wealth by the millions when measured in fiat.
I will never sell a single Bitcoin and I encourage you never to sell also. If you need fiat just borrow against it with Defi. You hold to keys to your life and giving it away is the choice we all have to make. When Bitcoin reaches it's full potential it will change the world as it is already starting to do. Even a year ago it seemed like a small possibility to most but as everyone has seen, this current system we are all forced to live is gong to to steal from you. You now hold the power and every time you change fiat to BTC you take a stand against the powers above you. One day, one month, one year at a time. Whatever you do don't give your power away. And at the end of your life you can look back and know you were a good steward with what you were given. Your family, your kids, and your legacy will be prosperous. Stay strong, stay vigilant, and never ever give up.
In our lifetime the crypto market is going to 30 trillion and probably much higher than that. Everything will be measured in Bitcoin, not the US dollar or any kind of fiat denomination. Come back in 10 years and this prophecy will be fulfilled. God Speed!

Happy new Market Cap ATH ! Double your investmentAccording to previous analyzes, as you can see in the chart, the overall market cap of the market has been able to surpass its previous and psychological ceiling of $ 2 trillion, which is a promise for good and green days in the upcoming markets.
In the last 90 days alone, the overall market cap of the market has grown from 1 trillion to 2 trillion (100% growth), in which bitcoin and many other digital currencies have been able to achieve more than 300% return.
Now, it is hoped that by the end of the summer of 2021, this volume will grow 100% again, and we will definitely face $ 150,000 bitcoin and $ 10,000 ethereum.
Keep Calm & HODL

MCAP Another view(b) is a Head and shoulders view, with a left shoulder and a head already formed, expecting a rejection at the next Gann line
(a) suggests price will smash through the next line, as it did previously with the same structure
(b) is a bearish short term view
(a) is a strong bullish view
This is the altcoin marketcap
In the chart above i show where the altcoin market may extend to, June 2022

$AEI #stockmarket #live #news #business #trading #stocks #stockAlset EHome International Inc., through its subsidiaries, engages in property development, digital transformation technology, and biohealth activities in the United States, Singapore, Hong Kong, and Australia. The company owns, operates, and manages real estate development projects, as well as lease units; and provides consulting, implementation, and development services related to digital transformation of enterprises. It also focuses on the research, development, and sale of Linebacker, a therapeutic drug platform; Laetose, a functional sugar substitute; and 3F, a multi-use fragrance. The company was formerly known as HF Enterprises Inc. and changed its name to Alset EHome International Inc. in February 2021. Alset EHome International Inc. was founded in 2014 and is headquartered in Bethesda, Maryland. Alset EHome International Inc. is a subsidiary of Hancock Fabrics, Inc.

$REEF Long & StrongREEF bounced off strong support and has been trading sideways. The falling wedge pattern completes soon and as we all know falling wedges are bullish. It has yet to break out to reach its all time high of $0.30 and higher.
We are excited about their Q2 Roadmap as well as watching them continue to grow with others such as Cosmos, Polkadot etc.
REEF Roadmap;
www.notion.so


Choose your altcoins wisely Btc is soon doing the next leg upI know right? what a nice colorful picture... Despite the dump right now and the CME Gap CME:BTC1! from 54455 and 55195. It looks like for me Btc will stay today on my Green Trendline and until it breaks up and go for another leg up.
Now is the best time to choose your ALTS, and soon I would look on FOMO coins like doge or Alice... when new traders jumping in .... If you like some alt signals publish, give me a like...

Btc dominance downtrendlooks like btc is gonna continue to downtrend. IMO once the resistance trend line meets the support line as circled we see a nice move down and we pull away with the alt market...

1 Year investment can get into 10X - HISTORY REPEATSMaybe the $ 400,000 Bitcoin dream announced in the analysis of others will come true !
With just a quick look at the status of past trends in Bitcoin, you will notice the price ceiling ( ATHs ) and price correction intervals.
In each growth period (with more than +10,000% price increase) it has entered a corrective period and a large amount of growth has been taken from it. The correction time periods are almost the same, so the price floor can be easily discovered and based on the past average time, the end period of this period can be guessed.
The point of suspicion here is just the interval when we see another foam in the bitcoin chart due to the corona virus. However, at the beginning of 2022, we will have another low, or at the beginning of 2023, when I know the probability of 2023 is higher.
With this theory and by drawing a series of average growths of the past, you can easily realize the dramatic increase that is in front of you.
We have just crossed the $ 1.5 trillion market cap, which could easily reach 5 or even 10 this year, which could achieve all of this price growth.
So in the long run you win. Do not get involved in short-term emotions.
Don't Get into FOMO, Keep Calm & Invest Long-Term


Market cap fighting against the .702 again.Lets see if we break through here. We are fighting the resistance on top of a uptrend. I think we will fall out hard before a bounce that leads us sharply up for a nice run before monday leading into the week.

Are you ready for take-off? 🚀Breakout and retest of minor trend.
We need to break out of this "cage" to fly to the moon!
I am seeing good Future in this coin.
Let's watch it soar!


