Marketcap

Total Market Cap: Cup with handleSo I have had this idea that the total market cap itself might be forming a cup with handle pattern. At the very most i can see the rounding bottom and now it seems we have begun to retrace.
Typically we don't like to see too much of a retrace on the way down something around a 50 percent retrace from the low to high is preferred.
On the chart i have noted that right now we are at the 61.8% retrace from the low to high but that's only on linear scale if we check log scale you would see that we are sitting near the 50 percent retrace.
Log scale does however ruin the left side of our rounded bottom which is why i have kept the basis of this trade on the linear scale.
A measured move if we ever did break out bullishly would bring the Crypto market cap very close to all time highs which would be a great time for any of the cryptocurrencies worth their weight.
Too deep of a retrace downwards could ruin this set up but it's still worth looking at.
Ignore the trendline i plotted on the MACD it was drawn on a smaller timeframe. *

Bitcoin Dominance Update ( BTC.D) i uploaded chart on my channel on sep 18
and now bitcoin is following the chart perfect let's fuck this support and go down we need alts party

ALTCOIN Market Cap. Impressive Symmetry.This is just a quick reference to where the alt market may be heading after Bitcoin's latest sell off.
To me it is impressive how the market managed to follow a downtrend that symmetrical to the uptrend of January - June.
Do you think it can go all the way down to fill the pattern? Personally I see the next symmetrical Support levels as strong candidates for the start of the next uptrend based on a comparison with the previous Bull Cycle. Also the 1D MA50 should start reversing around 50.50 if it follows the symmetry.

Crypto total market cap longThe big total marketc cap support log trend that nobody is talking about and where we at now. It's clear to say that you are betting against the bigger picture if you don't LONG NOW.
Also it's clear that if we turn this trend into resistance then we are going to DIG HARD. There is no in between.
That said' perfect time for long with tight observations how it continues to form.

All these Bears in Crypto Bringing you Down?Lets be real, Bitcoin broke its trendline and it broke a topping pattern to the downside, however, there is still a strong opportunity here for bitcoin and the entire crypto market to recover.
The Chart:
This is a chart that I have not opened up in a long time, however, in green we can see that price action has maintained a price above the green slow moving trendline; in addition, this trendline is the very same trendline which most of the crypto market reacted off of in an extremely bullish manner. There are two important possibilities at this trendline, either the trendline will hold, or it will not. However, if price for the entire crypto community consolidates at this trendline for a longer period of time an moves up, its possible that this was merely a retracement to test this trendline as support. However, if this trendline is broken, then the next slow moving trendline is quite a distance away in both price and time, so it would be possible that the next bull market wouldn't occur for a long time.
Previous Analysis:

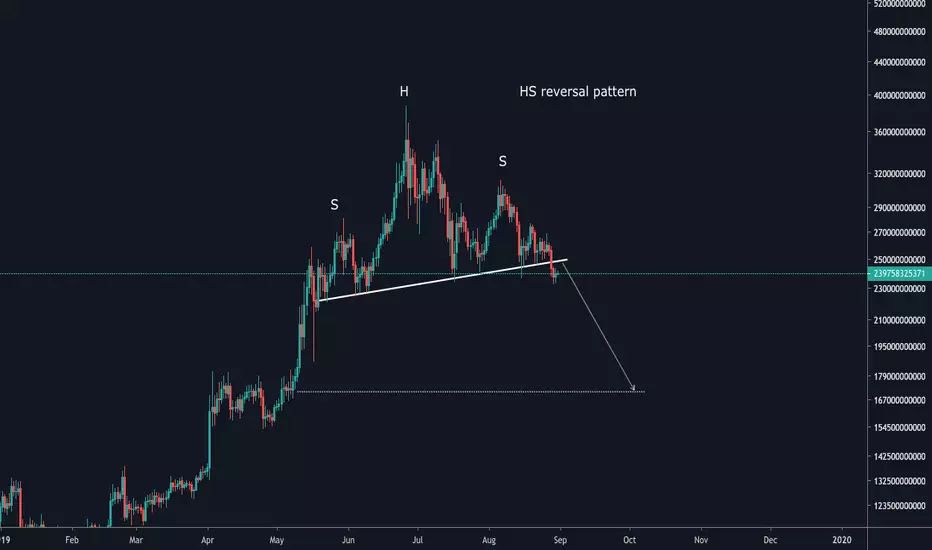
Alts to die?H & S forming in Alts Market cap.
is this the signal for us to get off from Alts.
have your say

Another Wave for ALTsBitcoin Dominance is about to start yet another wave down. This time it should reach 67.66% level which would provide further clues on the BTC.D direction. Break below would confirm a strong downtrend, while rejection of this level should lead to a consolidational period. Get more Alts while its not too late.

ALTS Chart doesn't look good. Expecting 50%+ declineAltcoins continue to suffer!
Fundamentally:
Why did Apple recover and boom? iTunes was launched back in the days, listening to music on the internet? WTF! Something innovative and inconceivable at that time!
As long as ALTS don't deliver real world products, and that probably doesn't happen for most of the companies, ALTS will just die out. Utility Tokens are not the real deal, because you just have a coin you can use in their network and in 99.9% the networks are not used... Why should Band Protocol, Matic, etc. or LTC pump? Not even the LTC network is being used.
I know, you may read between the lines and think: "hey, everyone is in disbelief, I have to buy", but really, what do most of the ALTS offer? Nothing!
One day, there may be this one altcoin delivering something crazy innovative of which we can not even think off
Technically:
The chart doesn't look good at all. We already lost uptrend support and there is a massive Head & Shoulder being built. This would mean the market cap loses more than 50% of it's value to appx. 31 Billions in total2 /alts marketcap.
Happy Trading!

Marketcap Excl. BTC: breakout wedge / next levels (2)Hi all.
Couple of weeks ago I posted a bullish wedge in the chart of the marketcap ex bitcoin (below)
Now it broke out the chart is testing the first support en resistance level. After making the first s/r level he will do the next one, and so on.
Thanks for the likes! Hit follow to subscribe to receive new updates and idea's.
Previous idea:

ChainLink is preparing to test 50 EMA - ($1.95)Fundamental Reason
Last days COINBASE: BTCUSD stated process of diversification towards ETH and XRP.
We can easily see that diversification from BTC Dominance to CRYPTOCAP:ETH.D and XRP Dominance which are pumping in the last few days.
Events from this kind are telling us that the potential drop is coming in the next 3 weeks. Before the drop to appear on the entire crypto market we are going to see growth in different alt-coins, most likely ChainLink will be one of them.
Technical Reason
At the moment BINANCE:LINKUSDT is at the oversold stage. RSI shows us potential Double Bottom formation. The price was able to rise above 200 Exponential Moving Average, which is speaking of strength and a higher probability for further growth. Volume is under 50 Moving Average, and a potential big move is coming. Likely the price will try directly at 50 candles Exponential Moving Average and tested it as resistance (price around $1.95).
Supports - $ 1.50, $ 1.45
Resistances - $ 1.95, $ 2.05
Good Luck!

Bitcoin will lead Crypto Market Cap higher!The market is in a bullish flag pattern and just bounced from double/triple bottom.
We have found strong support! Bitcoin is usually the one that decides the market direction.
There is great 1.618 Fibbonaci level to be reached in the midterm timeframe.
More strong arguments, detailed explanation and correlation with other indicators coming in the updates.
Like the post or follow the author in order not to miss them.
Stay tuned!
It's around 90% chance we are just before the push we have been waiting for months.


Crypto Total Market Cap Exclude BTC (TOTAL2) | UK Bulls Vs BearsI am looking at TOTAL2, the index for the total cryptocurrency market capitalization excluding Bitcoin ... Calculated by Trading View...
Here we have some signals to look at that can reveal potential scenarios for the future of the altcoins market capitalization... Let's take a look:
First let's notice the "support trendline" which is now in play. If this trendline is broken we can expect TOTAL2 to move lower and test the 0.786 Fib. retracement support level from the last bullish wave. Staying above this trendline can lead to a bounce up and test of EMA10 (79) followed by EMA50 (88).
We also have a falling wedge pattern and a neutral RSI.
Our main scenarios are drawn on the chart.
We believe TOTAL2 will grow in the coming months with potentially only one last strong drop left.
What's your take on where this index is headed?
Share with us in the comments section below.
Namaste.


Lets see how total market cap changes with bakkt launchTracking total crypto market cap leading up to bakkt deposits and live trading.

ALTCOIN MARKET IN MELTDOWNBe very careful with altcoins. One big drop yesterday meaning money went out of the alt-market and it actually kept the bitcoin dominance up due to the drop that happened.
Don't buy alt-coins with BTC you will lose.


Alt-Season coming! Sit on your belt before rocket launches!!!Hello traders and guys. Looking at the chart, Crypto Total Market is yet bullish!
Total MarketCap is tested Daily EMA50 line and bouncing up from EMA50 line and probably showing Inverse H&S as you can see in my chart.
However BTC Dominance was quite huge this year 2019 and now showing Rising wedge chart pattern.
Bitcoin is the king of crypto and the safest blockchain in the world. I believe it!
But then how about alt coins? Think what happened on Binance IEO coin BNB, ChainLink(LINK) and other major alts like ETH, BCHABC, DASH, EOS.
Alts was very bloody this year but alt season will be gone forever? Will BTC only survive in Crypto market? BTC can solve everything which have to be solved in crypto world's ecosystem?
I don't think so definitely! BLockchain still needs to be applied in many parts with proper ways. and there are better approach to solve this issue. Writing this article, I am still regret why I didn't launc ICO last year with my own idea. LOL Just a joke.
So to me, if alt season can come this year, Now is the moment to invest or setup a nice swing trading in alt coins. I think alts will grow quite much while BTC consolidating for a while.
I tried to choose some alts randomly, but seriously.
1. ETH
2. BNB
3. BCH
4. DASH
5. LINK
Good enough to give it a try with good entry!
Please leave comments!

Bitcoin Price vs. its Market Capitalization DominanceCorrelation Coefficient is a statistic measurement of correlation between two sets of data (of potentially any financial instruments) and shows the degree of relationship between them. It may help us to have a better understanding of market behavior. A few days ago, I came up with the idea of studying the correlation between Bitcoin (BTC) price in US Dollar ( BTCUSD ) and its Market Capitalization Dominance ( BTC.D ). So I made the setup chart and found something interesting. Bitcoin price sometimes has a very strong negative correlation with its Market Cap Dominance. In fact I'd better say that most of the time BTC has had negative correlation with its Market Cap Dominance. I think it is important and may lead us to have a better overview of how Bitcoin and other Crypto Currencies' (altcoins) market behave.
I searched Trading View for this subject and did not found any document related to this concept. If you know any documentation pertinent to this matter, please kindly let me know to include that in the proceeding research and analysis. I will update this study as research go on.
Appreciation for your attention,

Bitcoin is healing from the over speculation of Alts-Market recently over speculated on alts by greed and lack of understanding the nature of what a cryptocurrency is (2017)
-It damaged Bitcoin and severely lowered its market dominance
-Market seems to be readjusting the natural Bitcoin dominance
-Alts could have plenty more downside remaining, Bitcoin probably has a lot of juice remaining
-Punishment of the over greed and over speculative nature of alts, that attracted throngs of average joes
-If you think useless shitcoins having a hundred Million $ marketcap is normal, you will be trapped again
-Reverse = Alts/Btc bubble bursting
-Bear in mind that some alts are more resistant/stronger than some others, please do your own research
-Bitcoin is a strong nascent asset that punishes over bearish behaviour since 2010: wether people short it heavily, wether people over buy alts hoping to make money VS Bitcoin or even Usd, are punished.
Ciao!
