TOTAL CRYPTO MARKETCAPtrying to KISS (Keep It Simple Stupid) and short, the chart is on a 4 hour, but the the 50 SMA correlates with the 50 SMA on the daily, thinking we will have a spike up to the fib line then a retracement back to the 50 SMA, bull market is in. gonna be a good year I believe, go long but always be cautious about pull backs. congrats to all the HODLERS!
Marketcap

[TOTAL] Cryptocurrency Market Now on Bullish Alert! (It Goes HigWarning, the entire (TOTAL) cryptocurrency market is now on bullish alert.
Recently we shared a chart for the total cryptocurrency market cap. excluding Bitcoin (TOTAL2), mentioning its massive bullishness and a huge increase in trading volume and volume breakout, you can see all the details by clicking on the image below:
The entire cryptocurrency market cap., listed here on Trading View as TOTAL, looks as strong, if not stronger, than the TOTAL2 index.
We have all of our classic bullish signals developing and a very, very bullish chart.
Let's take a quick look into a few of these:
We can see a massively bullish RSI. The RSI hasn't been this high since January 2018, that's 1.5 years ago.
The RSI also hit a low point on December 2018 which hasn't been seen since January 2015. Think about it... That's most likely the lowest we will see in a while. The cryptocurrency market is really bullish right now.
TOTAL has broken above a strong area of resistance marked green on the chart. It took over 3 months to break below this level back in 2018, but only 2 weeks to break above it now in 2019... The bullishness this market is experiencing is massive.
This green zone we can see on the chart can now be used as very strong support and is very likely to hold TOTAL if it starts to retrace, but with Bitcoin super hot and the alts as well, we can look for additional growth.
The MACD entered the bullish zone (above the zero line) recently but is lacking some momentum, it shows plenty of room left available for growth.
Potential scenarios are marked on the chart above.
Conditions for change: Same as with TOTAL2, TOTAL remains bullish for us as long as it is trading above MA200 (black line). A close below EMA10 sends a bearish potential warning, but this index remains bullish as long as it is trading above MA200 and the last low.
We are extremely bullish on the entire cryptocurrency market for late 2019, 2020 and beyond. We believe that we are looking at the bottom for most altcoins and cryptocurrency, and once the bottom is in, the only place left to go is up.
What's your take on what will happen next?
Share your thoughts in the comments section below.
Remember to hit like if you want to now to show your support.
Thanks a lot for reading.
This is Alan Masters.
Namaste.

Total market cap for cryptoTotal market cap for crypto now we are going down to 182 billion soon befor pumping to 336 billion so the alts coin will dump again so be careful and convert all your crypto to usdc or pax I will update soon after biancne completed the maintenance

Bitcoin Market Cap Dominance still has a room to growThe #Bitcoin Market Cap dominance index still showing the room for the upside. The target zone is seen at the zone marked as the orange rectangle. Only when this zone is hit, the crypto traders can expect a larger corrective move on #BTCUSD and related pairs.


crypto ALTCOIN total market cap it's weekly chart but i think we are so close to ALTCOINS bullish trend
just after a few sub waves
TP marked in chart
remember:
just wait and don't panic!

#ALTSEASON soon? ALT-MARKETcap starting to rise again!!! Hi crypto-financial-partners!
It seems a possible #ALTSEASON very soon.
Why?
CryptoMarketcap is now is breaking a BULL FLAG and the GOLDEN CROSS !!! GOLDEN CROSS + BREAKING the BULL FLAG in ALTCOINs MARKETCAP
Which is your target?
Let me know your target commenting the post and enjoy next #ALTSEASON
If you think I am wrong, let me know with your idea!!
Thanks for reading!

Bitcoin MarketCap share could reach 72% With troubles facing Tether, traders will likely put their money in BTC (refuge) and maybe sell their alt coins which will put more pressure on Bitcoin price and make it go up even more. Basically I see BTC market cap share reaching 72% and becoming a refuge against alt coins (not doing well lately against btc).
My recent BTC trading ideas

Total Crypto Cap Analytic (6 May)TOTAL chart is MarketCap chart include BTC
TOTAL2 chart is MarketCap chart exclude BTC
Both charts show us a descending trend. So this time is not good to buy in

Bitcoin Dominance going to 75% After Meteoric Rise to 2019 HiOn April 23, the crypto markets took a turn that have some questioning the outlook on altcoins. While the altcoin market has been holding its own against Bitcoin, with currencies like Binance Coin posting 300 percent gains since the start of the year, the market appears to be swaying in favor of Bitcoin.
Long time cryptocurrency investors will be familiar with the the tug-of-war price movement between Bitcoin and altcoins. At times, the entire cryptocurrency marketplace buoys on positive sentiment and increased investment. However, a shifting between the pool of capital in alts and Bitcoin is also a common occurrence. For one, investors avoid the headache generated by taxes and capital gains by trading between currencies.
But for the most part, investors have recognized that Bitcoin tends to be a more price stable currency relative to the rest of the market, while also offering the ability to appreciate during periods of positive price movement–a feature that stablecoins are unable to offer. In times of bullish market sentiment, such as what is brewing for the industry at present, investors grow fearful of missing out on massive BTC leaps, such as the epic run which took Bitcoin to $20,000 in December 2017.
Despite the development interest and growth into platform currencies such as Ethereum, EOS and TRON, the marketplace for cryptocurrency continues to flow through the original cryptocurrency. Bitcoin holds a wide margin in market capitalization over the second highest coin Ethereum, a gap that is greater than $80 billion. In addition, Bitcoin market dominance has continued to climb throughout 2019, up from 51 percent at the start of the year to over 53 percent. Today’s price action has taken BTC dominance to just under 54 percent, its highest point since September 2018.
In fact, Bitcoin dominance has largely been on the rise over the last 12 months, with the coin reaching a relative low of 35 percent dominance in May 2018. While BTC experienced a slight retraction during the market fall of last December, the coin is making a recovery that could be trending towards the >80 percent dominance the coin historically experienced prior to early-2017.
More than likely, Bitcoin will not be able to eclipse its 2017 dominance of 85 percent, given the changing landscape of cryptocurrency. While BTC is by far the most recognizable currency in the industry, with Bitcoin holding household-name status familiarity (the coin is largely synonymous with cryptocurrency in mainstream markets), altcoin projects like Ethereum and EOS have carved out a substantial amount of developer interest. With Bitcoin yet to overcome the hurdle of scalability, its price is likely to stall again at upper limits in the absence of a solution like Lightning Network.
Cryptocurrency, assuming it can gain price traction again as in 2017, is still in need of proven usability. Investors and speculators may continue to drive up the price of Bitcoin and contribute to its market share dominance, but the entire landscape of currencies have to generate scalability in order to become an accepted technology.

Let's analyse ALT market...watching BTC Hello Guys,
we see a bull flag forming on ALT market cap which is a bullish pattern and indicating more money flow into the market.
target is given for the breakout.
Let's see what the king does ( BTC ).Sideways maybe!
Always DYOR
Cheers
MM67TRADER TEAM

Total Crypto Cap Analytic (3 May)MarketCap is following our arrow exactly. And it has a big possibility to breakout in this wave.
=> This is GOOD sign for ALL COINS

SIACOIN KEY MOMENT. GOLD SUPPORT SIA / BTCYou can buy and hold for big high.
You can buy it only when you break the big gold line.
My target for siacoin. 1200 and 1500 satoshi
----------------------------------------------------------
Você pode comprar e segurar para grande alta.
Você pode comprar só quando romper a grande linha de ouro.
Meu alvo para siacoin. 1200 e 1500 satoshi

SIA BTC / SO IT WILL BE THE BIG HIGH OF SIACOIN /LOL :)As soon as the MA 50 and MA 200 the large volume begins.
Wait for it!
This will be crazy to see.

SIACOIN WILL HAVE HER FIRST TOP OF ALL TIMES. SC BTCThis is my prediction for siacoin.
Search for your all-time top so far.
Wait for the MA 50 and 200 to cross and see for yourself.

Total Market Cap Total Market Cap Analysis
Alts bleeding heavily if btc retrace alts may take a breath if it take dump alts will dump badly and may lost previous supports

Total Market CapI think Total Market Cap will be decrease soon, keep your portfolio on USD is the smartest move in a short term.

ALTS TOTAL2 in longterm bearish territoryALTS seem to be in a bearish longterm territory:
Elliott Wave is missing wave number 5.
The correction of wave 2 and 4 are perfect, one steep, one flat. Wave 3 needs to be the longest.
A massive bear flag is being built.
Weekly perfected 9 on the TD sequential.
Target:
25 to 35 billions of ALTS market cap.

Bullish on the cryptocap @wizardsofcrypto #BTC Looking good
But not ready yet
Watch RSI
But Rising
Safe Tradingz
Wiz

Crypto Market Cap to 75 billion.The market cap is following the trend of the correction occurred in 2014. I expect a collapse of the same down to 75 billion, a target not reached in December 2018 but indicated in the past line. The graph is forming a bear flag and an abcd pattern. The bottom should be around 75 billion.
This is my personal opinion and this is not a financial advice! Good trading!

Cryptocurrency Marketcap Breakout Short Term ThoughtsLooks like it will be going for a retest of the high we set yesterday

Total Market Cap going to 200 Bln$Hello everyone today I look at crypto total market cap. What we can see, after fly from 140 to 157, they did not immediately go down but continued to grow; next psychological 200 billion.

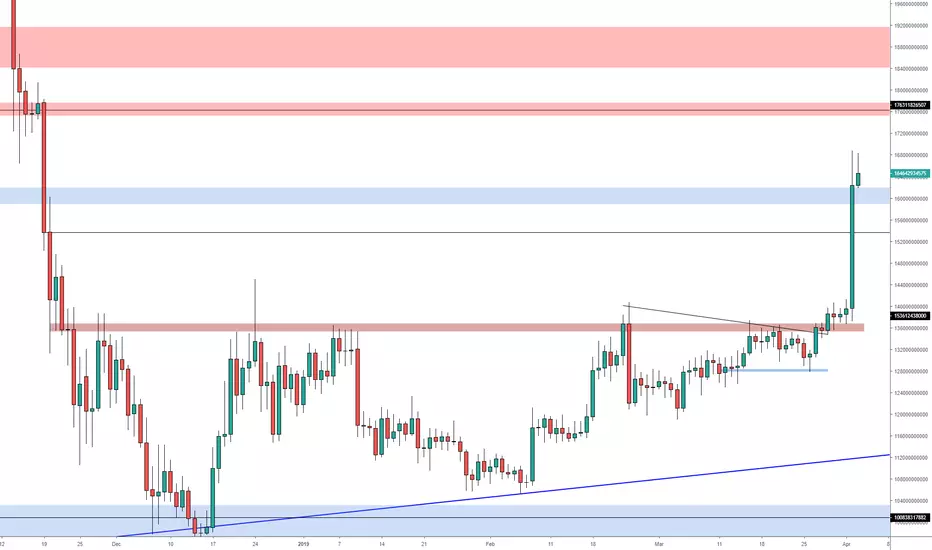
Total Cryptocurrency Market Cap Analysis Yesterday after holding the 136b support and closing above the 3 day range, we finally broke through the 140b level and surged higher. This being the total market cap gives you a sense of what the overall market was doing. Giving no regard to the 145b and 150b minor resistance region, we continued higher and closed above the crucial 160b level. Which ended up 16%+ for the daily session.
For now it is difficult to determine the next short term move, after such a dramatic movement. Which is why I usually step back from the charts and let the market breath for a day or 2 before re entering any margin trades. However the medium term bias for the time being is still bullish, especially after a strong close across the board as shown on the total market cap.
As long as we remain above the current 160b support level I believe we should see a continuation to the further upside targets at 175b and 188b. However if we do lose the current support I believe a retest lower to the 155b price level is orderly and healthy for higher price discovery.
*This is NOT financial advise and intended for educational purposes only*