Marketcap


CRYPTOMARKETCAP - LOOKS VERY VERY INTERESTING - CryptoManiac101CRYPTOMARKETCAP / USD TA
This looks very interesting, doesn't it. We have a nice semi bullish pattern with possible golden cross (unconfirmed) which is currently following our parabolic curve.
Will this be the start of the next bull run?
Could be
What's our timeframe?
We have until March 27 for Parabolic Curve to either validate or invalidate.
We have until late May for pattern completion unless we break up or down before that time. Most patterns do breakout around 70% into it which would give us approximate date of April 10 (give or take another week)
Invest smart!

Total Market Cap needs a push for the BULLSAs you can see by the chart displayed, the total cryptocurrency market cap is in a clear Equilibrium pattern despite certain coins breaking into weekly uptrends and some getting within 1-2% ranges from bull breaks. We also have the 12 and 200 Weekly Exponential Resistances just above the current price which creates a more favourable trading environment for the bears on a weekly time frame.
The reason I argue that this is a more favourable trading environment for the bears is:
1- Low of Equilibrium pattern is around 3300USD so there is still a lot of room to the downside to for a higher low and continuing to tighten.
2- 12 and 200 exponential resistances overhead.
3- (Referring to BTC as a trade) Since we are a lot closer to the top of the Equilibrium range as opposed to the bottom, if one wants a bit more risk in their trade and doesn't want to await confirmation, a stop loss above EMAs or EQ top would be less of a margin then a stop loss below supports if a long position was taken.
4- The Macro Trend is still bearish. Until the trend is ACTUALLY changed, then the current trend has to be respected.
IF you are bullish, based off this chart and trading from the weekly time frame, I would not take any positions at the moment as an efficient risk management plan does not seem possible until a better set up occurs.
All in all, the best thing to do in this situation would be to wait for confirmation of a marketcap EQ break before entering long or short on trades. If I was forced to take a position, then as stated above, I would go short with stop losses in place from above EMAs to above EQ on BTC.
I am the Unemotional, Devotional Trader that Society doesn't deserve, but needs!

Crypto Marketcap - Bear Market might be coming to an end!Judging by history, the Crypto total marketcap has been using the 20 week MA (Yellow line) as a strong resistance and support.
I feel it will be a clear indication the bear market is over when we can break above this moving average.
The RSI double bottomed around 30 in the last bear market before it changed trends. I am looking for something similar before this trend reverses.
Best estimate, this double bottom should happen around late March, early April.
- The Wiz

Cryptocurrency Total Market Cap. Exclude Bitcoin (BULL GREEN)Hello, my dear cryptocurrency lover... We love Bitcoin and trading cryptocurrency, it makes making money easy... with patience.
Ok, let's take a look at the chart and indicators for the total Cryptocurrency Market Cap. excluding Bitcoin . There are some interesting bullish signals to look at.
If you want to see our analysis for the total market cap. including Bitcoin, go here:
Now, if you want to, you can hit (like), and we can get started... Your suppor is truly appreciated.
Cryptocurrency Total Market Cap. Exclude Bitcoin - Weekly Chart Analysis
The first thing to look at is the blue trendline coming down from April 2018, I drew this one a few days back before the breakout... The thing is that this line is being broken. At the same time this breaks above MA200 (black line) and EMA10 (green).
So three major resistance taken out at once (downtrend line, EMA10 and MA200). This breakout is supported by increasing volume.
Trading volume has been increasing week after week for the past 5 weeks.
Let's take a look a the indicators
MACD (12, 26, close, 9):
The MACD is showing a clear bullish crossover and bullish divergence. The total market cap. for all the altcoins needs to reach EMA50 for this divergence to fully play out. So plenty of room left avaiable for growth. This is just getting started.
The histogram is clearly going in favor of the bulls now.
RSI (14, close):
The RSI is now in an uptrend and is at its highest since July 2018, that's quite the big change. A really strong signal especially considering that this is the weekly time frame we are looking at.
The weekly candle closes tomorrow, so we need to see a full green candle close for these signals to be fully confirmed.
As further bullish confirmation, a close above EMA200 (bold orange line) is required. Such close would signal massive strength, but even as it is looking now, the entire crypto-space is looking super bullish.
Load up on your favorite altcoins, because lots of profits will be made really soon.
Thanks a lot for reading.
Make sure to hit LIKE!
Thanks a lot for your support.
Wishing you a great Sunday!
Namaste.

Crypto Total Market CapOver the past week, the crypto market capitalization increased by 30% from 100 to 130 billion. A few days ago there was a maximum daily trading volume of 35 billion. Now we see a clear trend. We are moving in the ascending channel and by the end of the month market capitalization is expected to be in the zone of 140 + billion.
We begin to grow. A lot of good news. Which pushes investors to invest in projects at low prices.
RSI - oversold
above MA50,100,200

Cryptocurrency Total Market Cap Breakout + Bullish PotentialThe cryptocurrency market is moving. We are seeing green and we like... We love it!
I am now looking at the total market for the entire cryptocurrency market, all altcoins including Bitcoin, and we have several interesting signals.
Perhaps you might want to take a minute now to hit LIKE, and then continue reading what I am about to share... Thanks a lot for the support.
Crypto Total Market Cap Bullish Chart Signals
Daily time frame chart analysis (left)
On the left we have the daily time frame, where I want you to take a look at several things.
First we have trading volume increases, which is the best signal you can have to support a strong breakout. This huge increase in volume came to break above EMA50 (magenta) and MA99 (red).
The RSI is super bullish and the MACD is just following its steps now entering the bullish zone after having a bullish crossover.
Pretty simple, straight forward signals.
Weekly time frame chart analysis (right)
Here the action is just getting started, on the weekly time frame. You can see that EMA50 is still far but the total market cap is now above EMA10. This signal is only valid when the week closes.
Trading above EMA10 = bullish potential.
We have the RSI curving up strong and the MACD showing a bullish crossover.
The candlesticks formation and TD Sequential are also supporting a bullish move.
So the chart for Total Cryptocurrency Market Cap is starting to display some nice bullish signals, and we have these many altcoins and Bitcoin making strong moves which are reflected in the charts above.
This is the type of action we haven't seen in a while, and we are expecting a strong wave up in the weeks to come.
Enjoyed this post? Feel free to hit like if you want and I will keep on posting, more and more.
Namaste.

LSCC - Gateway for video LSCC - $1B Mkt Cap, 1.2B Ent Value, no dividend. Profitable earnings all 2018, not prior. Has IP, growth, strong technology future in smart connectivity, video, and SaS, or high value logic devices. Strong recovery from recent drop at 238 Fibretracement and climbing. About to report strongest earnings, albeit $0.08/share, which is up 700% over prior Q1 yr/yr. Dropped 0.69% on Feb 1 vs NASDAQ avg. down 0.25% and Dow up 0.26% (mostly lg cap). 4Q profitable in 2009, 2013-2014 along with 2018. Current PEG ratio is 1.72. Semiconductor is in top 35% of segments currently. Would have been up 41% if bought at recent low of $5.50 area.
Lattice Semiconductor Corporation is a United States-based company, which develops semiconductor technologies that it monetizes through products, solutions and licenses. The Company operates through two segments: the core Lattice (Core) business, which includes intellectual property (IP) and semiconductor devices, and Qterics, a discrete software-as-a-service business unit in the Lattice legal entity structure. The Company is a provider of customizable smart connectivity solutions based on its low power field programmable gate array (FPGA), video application specific standard product (ASSP), 60 gigahertz millimeter wave, and IP products to the consumer, communications, industrial, computing and automotive markets across the world. Its products include iCE40 Ultra/UltraLite, iCE40 LP/HX/LM, MachXO3, MachXO2, MachXO, HDMI Transmitters, HDMI Receivers, USB Type-C Port Controllers, Port Processors, Analog to HDMI/MHL Converters, MHL Transmitters, UltraGig 6400 and 802.11ad Chipsets.

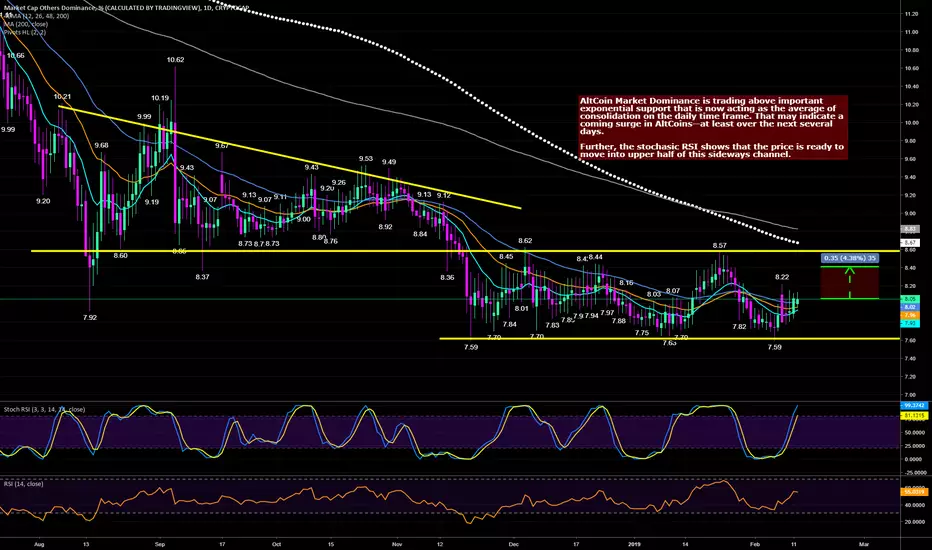
AltCoin Dominance Back-Testing EMA Support Before Next MoveAltCoin Market Dominance is trading above important exponential support that is now acting as the average of consolidation on the daily time frame. That may indicate a coming surge in AltCoins--at least over the next several days.
Further, the stochasic RSI shows that the price is ready to move into upper half of this sideways channel.
A different analysis of the Crypto marketI've decided to share some interesting charts about the crypto market.
Most of us are using the BTCUSD chart to analyze the market. But I think It may be better if we also have a look at the other charts beside the BTCUSD.
------------------------------------------------------------------------
One of the most interesting charts, in my opinion, is CRYPTO TOTAL MARKET CAP . You can see the analysis here:
As you can see, It's similar to the BTCUSD chart. But there are still some differences. The price "WAS" moving in a falling wedge, starting from first of 2018 and ending with the start of 2019. About one year of correction. For now, the pattern is broken. All of us know that the falling wedge is one of the best patterns for correction in a bull run. So the pattern is broken, the correction is done. So what do you guess about the next move? Right, the market cap will grow again, maybe another huge grow, maybe within this year.
(Remember that the traditional stock markets are falling, So where the money will go? Gold? Or maybe, Crypto?)
----------------------------------------------------------------------------------
The next interesting chart is about bitcoin dominance (MARKET CAP BTC DOMINANCE).
We can see that the btc dominance is moving in a Fib channel, Hitting the top and bottom twice. For now, we are at a critical point. If the dominance breaks the top, we can expect some rises, at least about 70%. But the most probable scenario is this: the dominance is unable to break the top and it will go to hit the bottom again, yes. Bitcoin is old, there are very interesting blockchains and digital currencies better than bitcoin blockchain in the market. Vitalik said the next growth will come from the depth, the applications, and usage, he is true. So in my opinion, we can see the dominance below 30% soon.
Please hit the Like if this idea is useful.
Sorry for my bad English guys ;)

Bitcoin Daily Update (day 323)Disclaimer: If you are primarily interested in copying other people’s trades then this is not for you. However, if you are willing to put in the work that it takes to learn how to trade for yourself then you have found the right place! Nevertheless please be advised that you can give 10 people a profitable trading strategy and only 1-2 of them will be able to succeed long term. If you fall into the majority that tries and fails then I assume no responsibility for your losses. What you do with your $ is your business, what I do with my $ is my business.
Click here for my Comprehensive Trading Strategy | Click here for my Comprehensive Trading Process | Click here to learn about the 2 BTC' to 20 BTC' Trading Challenge
Consensio: P > L MA > S MA > M MA (Watching for golden cross with L & M MA’ and for L MA to flatten)
Patterns: Phase 7 Hyperwave | Bear Channel
Horizontals: R: $3,706 | Want to see support hold above $3,532
Trendline: Bear Channel
Parabolic SAR: Broke bear SAR, bull SAR = $3,338
Futures Curve: Backwardation with 0.71% spread | Long entry confirmed when price took out the 2 week high. Now would like to see market re enter Contango while market pumps.
BTCUSDSHORTS: Tried to make a higher high, got rejected hard. Watching for double bottom.
Funding Rates: Longs pay shorts 0.01%
TD’ Sequential: G2 goes above G1 at $3,717
Ichimoku Cloud: Interesting that the bullish TK Cross was rejected
Relative Strength Index: Back above 50. Bulls are on the offensive.
Average Directional Index: ADX > 25 and +DI above -DI = bull trend
Price Action: 24h: +7.5% | 2w: +2.4% | 1m: -8.1%
Bollinger Bands: Tested the top band on this last move.
Stochastic Oscillator: D, 3D and Weekly Cross. Is very / powerful for those to occur at roughly the same time.
Summary: There are a couple major areas of resistance that I am watching closely. Bitcoin is still inside the bear channel and the resistance trendline waits at $3,800. I do expect that to break but will not be counting my ducks just yet.
If we do close above $3,800 then my next important area of horizontal support is $4,100 - $42,00. I do expect us to breakthrough there due to how we have eaten away at that resistance three times already.
After that is $4,700 where the weekly Bollinger Band MA is waiting along with the weekly Parabolic SAR.
The chart above is the main reason I am confident we are due for a significant bounce. We appear to have supported $100B total market cap and to me that is very important. That area provided significant resistance back in 2017 and as soon as we broke through the parabolic advance really started to gain momentum.
I have an alert set to trigger once / if we breakdown that area and I will be using that as a strong indicator of upcoming capitulation.

Boring Bitcoin Analysis Pt.2: Breakout Action!Bitcoin showing breakout from falling wedge. But what we hate from BTC breakouts — they often Fake (like many analyst here, hh), so keep this in mind when placing orders.
Boring Bitcoin Analysis Pt.1 you can find here:
Bitcoin Elliot Waves analysis here:
Market Cap showing interesting setup, and market relief very soon, you can check it below:
Good luck, have fun!

(-15%) Drop IS COMING for CryptoTotal Market cap is taking a square shape, and the market cap must be at 92B ASAP, but it has No enough Time, So i predict it will take a High Speed Drop to reach his target "which is -15%" before his time at 5th Feb, 6:00 AM, which will make a bid drop in the cryptocurrencies
* This scenario will failed if the time came AND the market cap broke 113B !

Bull Trap is comingCome on TOP TRADINGVIEW!
I will help you. No, wait. Know how to read candles? Or do you copy ideas to sell your signals?
Better start finding another service. This market is dead! Did you understand Without regulation no money will enter here! What is the 700 billionth of the marketcap? Where are they? Why did they run away?
The bottom is farther than you can imagine.
Better not post ideas like ZERO.
Bitcoin goes from 0 USD and goes to 20k is this normal! Blockchain is revolutionary !!!!! LMAO! Now get out of 20 and go to 0 is crazy? OK!

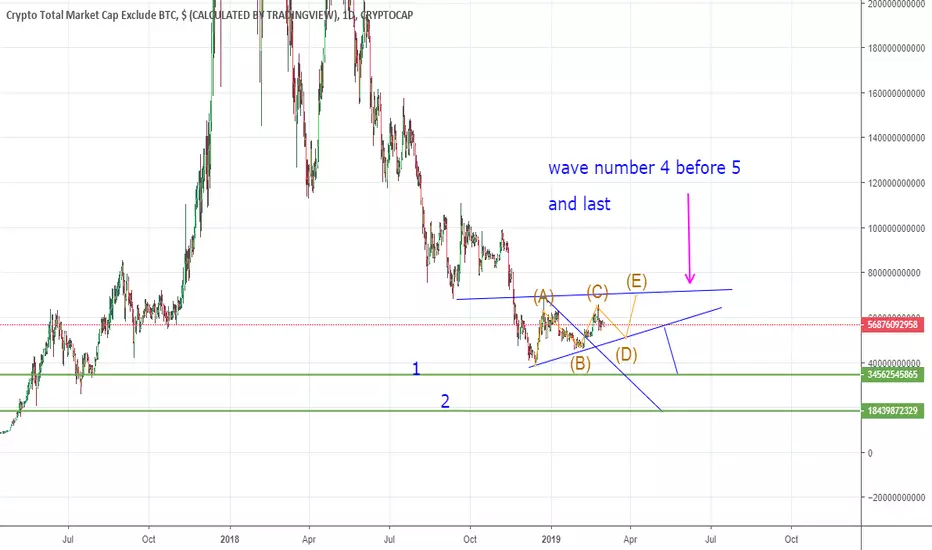
TOTAL2 MarketCap - BTC IN THE NAME OF GOD
This is crypto total market cap exclude BTC
if it happens we will have Alt party

Bitcoin Daily Update (day 314)Disclaimer: If you are primarily interested in copying other people’s trades then this is not for you. However, if you are willing to put in the work that it takes to learn how to trade for yourself then you have found the right place! Nevertheless please be advised that you can give 10 people a profitable trading strategy and only 1-2 of them will be able to succeed long term. If you fall into the majority that tries and fails then I assume no responsibility for your losses. What you do with your $ is your business, what I do with my $ is my business.
Click here for my Comprehensive Trading Strategy | Click here for my Comprehensive Trading Process | Click here to learn about the 2 BTC' to 20 BTC' Trading Challenge
Consensio: P < S MA < M MA < L MA = fully bearish (current candle is testing S MA)
Patterns: Phase 7 hyperwave | Bear channel
Horizontals: $3,478 provided the preliminary support on November 25 and the last few days have been threatening to turn it into resistance
Trendline: Channel
Parabolic SAR: Differs significantly based on exchange. Bistamp at $3,500 is most important to me.
Futures Curve: Backwardation with 2.5% spread
BTCUSDSHORTS: Pumping right through a G9
Funding Rates: Longs receive 0.0351%
TD’ Sequential: R6
Ichimoku Cloud: Look at how well the Tenkan-Sen is acting as resistance. Beautiful!
Relative Strength Index: Testing trend resistance
Average Directional Index: Crossed 20 indicating bear trend. Watch for confirmation with a cross above 25.
Price Action: 24h: +2.1% | 2w: -3.4% | 1m: -5.9%
Bollinger Bands: Resuming squeeze which indicates to me that the selloff on the 19th was a trap
Stochastic Oscillator: Daily buy signal. 3D still pulling back. Weekly posturing for buy.
Summary: The market is at a rather crucial spot and longs are starting to look very appealing. If we can close back above $3,500 then that would signal for me to start scaling in. On the other hand a close below the MA of my channel (~$3,325) would be very bearish.
The Bitcoin Market Cap dominance is very interesting to me right now as well. Since the summer of 2017 BTC has found strong resistance at 60% dominance and currently appears to be forming a descending triangle.
A breakdown from here would be likely to retest 40%. On the other hand if we could manage to return back above 60% then a return to 80% would be very likely. This is all right in line with the two options I am expecting from here.
My most likely outcome is one last dead cat bounce from here to fill the gap in the VRVP in the $5,200 - $5,800 area. If that happens market cap dominance will likely fall back to 40% while alts pump even harder. Then the rug gets pulled out from under and the market flies back to safety during capitulation.
My slightly less likely outcome is breaking down $3,000 from here and capitulating over the following weeks - months. I remain resolute that would be the quickest way to find a bottom. Flight to safety occurs during capitulation pushing BTC market dominance back to 80%+ and sending alts down the toilet where they belong.
Still too early to make a confident call either way. Time to remain on the sidelines and wait for more information.

A look at the entire cryptomarket marketcap's falling wedgewe can see here on the weekly chart of the entire crypto marketcap that the market is very much so inside a falling wedge...one that seems to reach its apex in the middle of march....but as with most falling wedges a breakout from the wedge tends to happen very soon after 3/4ths of the wedge has completed so a breakout can be anticipated sometime within the next few weeks. we can see the 200 weekly moving average in blue for the cryptomarket has been holding very strong support the past few weeks...if this 200 week simple ma holds then we could breakout of the wedge in the next 2 weeks...if that's the case then the bottom is essentially already in...if it doesn't hold and dips below the next likely target is a double bottom on the horizontal teal trendline we have already touched once. Any dip that could happen below that would likely just be a big bounce up off the bottom trendline of the falling wedge. Once we trigger a break upward from the wedge the bottom of the bear market will almost certainly be in. A breakout fakeout candle followed by capitulation is also a possibility to consider so its wise to make absolutely sure the breakout is validated before jumping to conclusion.

Cryptocurrency total "Market-Cap" weekly thoughts.Think about all the shit that still exists in crypto space, another 40b deleted before we re-evalute looks right.
